. 2019 Jun 6;74(5):877-890.e6.
doi: 10.1016/j.molcel.2019.03.031. Epub 2019 Apr 22.

ER and Nutrient Stress Promote Assembly of Respiratory Chain Supercomplexes through the PERK-eIF2α Axis

Affiliations

ER and Nutrient Stress Promote Assembly of Respiratory Chain Supercomplexes through the PERK-eIF2α Axis

Eduardo Balsa et al. Mol Cell. .

Abstract

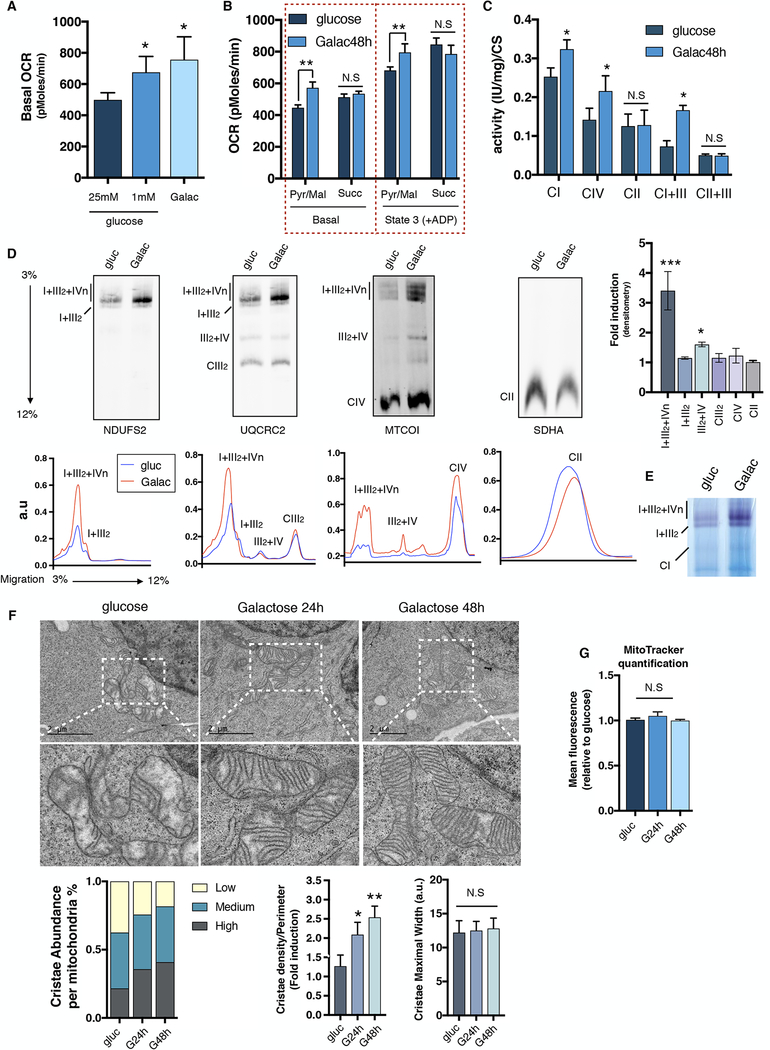
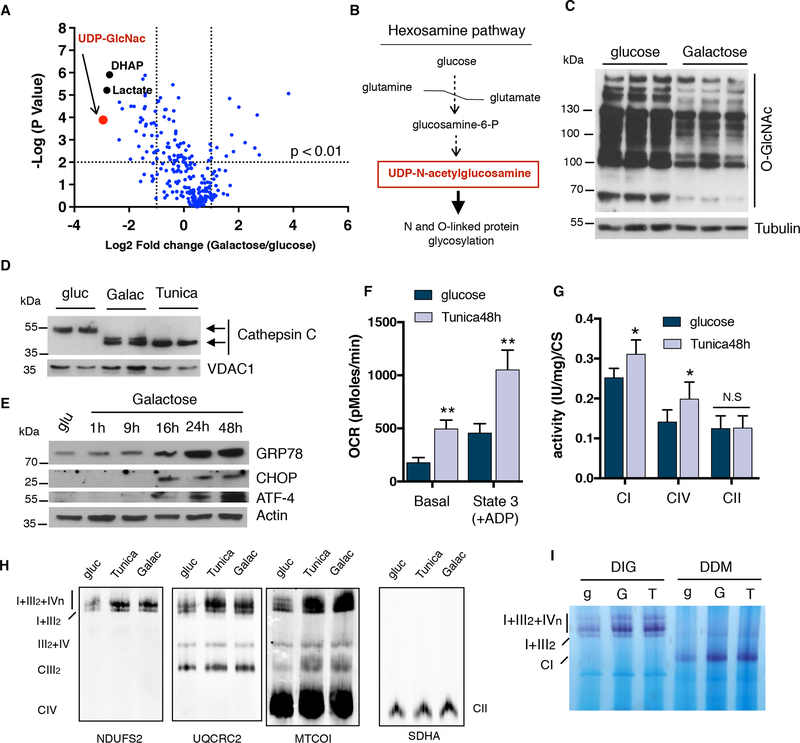
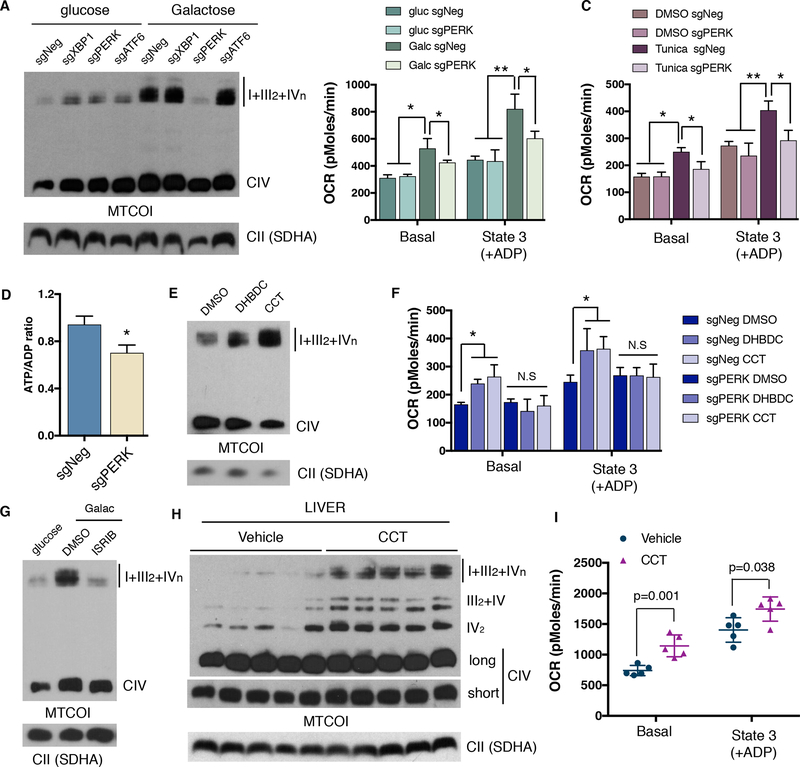
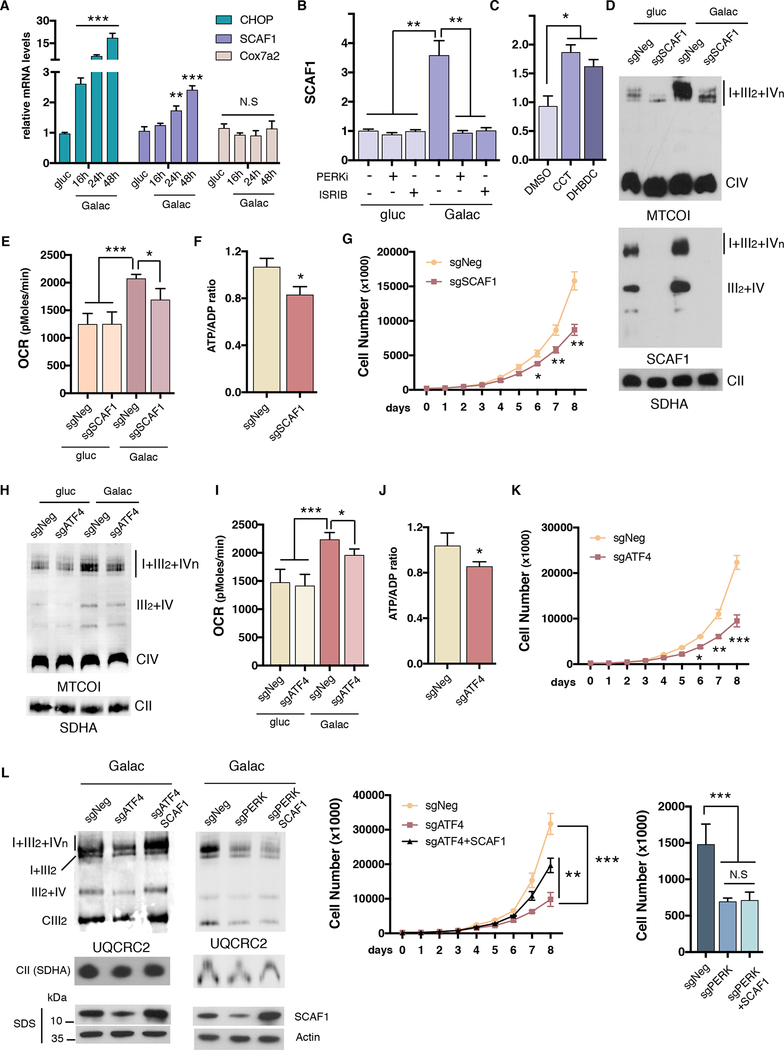
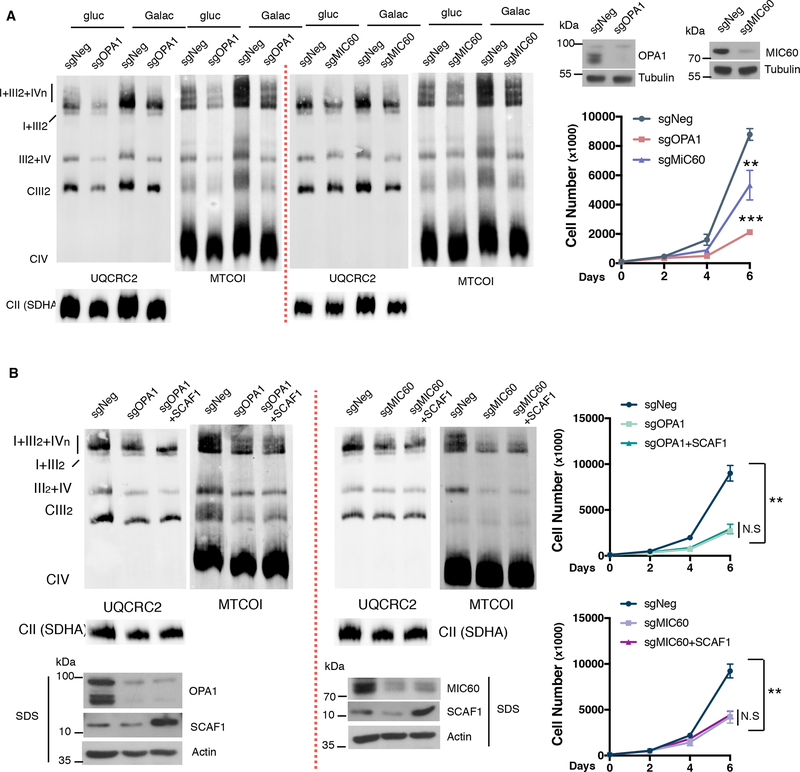
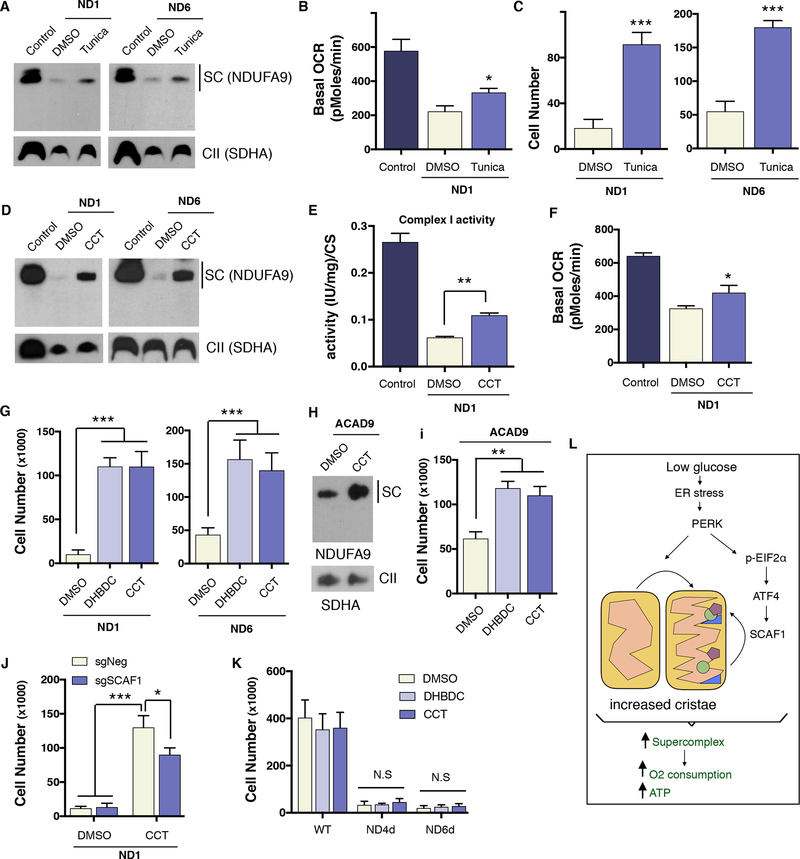
Endoplasmic reticulum (ER) stress and unfolded protein response are energetically challenging under nutrient stress conditions. However, the regulatory mechanisms that control the energetic demand under nutrient and ER stress are largely unknown. Here we show that ER stress and glucose deprivation stimulate mitochondrial bioenergetics and formation of respiratory supercomplexes (SCs) through protein kinase R-like ER kinase (PERK). Genetic ablation or pharmacological inhibition of PERK suppresses nutrient and ER stress-mediated increases in SC levels and reduces oxidative phosphorylation-dependent ATP production. Conversely, PERK activation augments respiratory SCs. The PERK-eIF2α-ATF4 axis increases supercomplex assembly factor 1 (SCAF1 or COX7A2L), promoting SCs and enhanced mitochondrial respiration. PERK activation is sufficient to rescue bioenergetic defects caused by complex I missense mutations derived from mitochondrial disease patients. These studies have identified an energetic communication between ER and mitochondria, with implications in cell survival and diseases associated with mitochondrial failures.

Keywords: ATF4; ER stress; PERK; hexosamine pathway; mitochondria; mitochondrial cristae; mitochondrial diseases; nutrient stress; protein glycosylation; respiratory chain supercomplexes.


Conflict of interest statement

DECLARATION OF INTERESTS

The authors declare no competing interests.

Figures

Figure 1:
Figure 1:. Limited glucose availability promotes mitochondrial oxygen consumption, Respiratory Chain Supercomplexes and Cristae density.
U2OS cells grown in glucose or galactose for 48h. Oxygen consumption analysis of (A) intact cells, or (B) isolated mitochondria, using Pyruvate/Malate or Succinate as specific substrates respectively. (C) Mitochondrial enzymatic activities of CI, CIV, CII, CI+III and CII+III normalized to citrate synthase (CS) levels. (D) Upper panel; Immunodetection of the indicated proteins representing CI, CIII, CIV and CII after BNGE of digitonin-solubilized mitochondria from glucose or galactose (48h). Right; Bands were quantified using ImageJ software and fold induction under galactose conditions is represented. Lower panel; Superposition profiles of the different supercomplexes and free complexes using GelEval software. (E) Complex I in-gel activity of digitonin-solubilized mitochondria from 48h glucose or galactose cultured cells. (F) Mitochondrial cristae morphology, abundance and density assayed by electron microscopy (EM) in glucose and galactose-grown U2OS cells at 24h or 48h. (G), Mean fluorescence corresponding to mitochondrial content in cells cultured in glucose or galactose measured by flow cytometry. SDHA was used as a loading control. Immunoblots shown are representative of >3 independent experiments and all other experiments are represented as mean ± s.e.m., n>3. Asterisks denote *p<0.05 or **p<0.01. For two comparisons a two-tailed t-test was used, for multiple comparisons, one-way ANOVA with Bonferroni post-test was applied. gluc/g, glucose. Galac/G, galactose.
Figure 2:
Figure 2:. ER stress induction leads to an increase in OXPHOS performance.
(A) Volcano plot of global metabolomics analysis comparing galactose vs glucose-grown cells. The most down-regulated metabolite, UDP-N-acetylgucosamine, is highlighted in red. (B) Simplification of the hexosamine pathway. (C) Immunoblot showing total O-linked glycosylation in cells cultured either in glucose or galactose. (D) Immunoblots showing a shift in migration of Cathepsin C due to impaired ER protein glycosylation in U2OS cells. (E) Western blot analysis of ER stress markers: GRP78/BiP, CHOP and ATF4 in U2OS cells cultured in galactose at the indicated time points. (F) Oxygen consumption rates, (G) mitochondrial enzymatic activities of CI, CIV and CII normalized to CS and (H) SC levels in isolated mitochondria from tunicamycin treated cells after 48 hours. (I) Complex I in-gel activity of digitonin (DIG) or DDM-solubilized mitochondria from glucose, galactose and tunicamycin treated cells. SDHA was used as a loading control. Immunoblots shown are representative of >3 independent experiments and all other experiments are represented as mean ± s.e.m., n>3. Asterisks denote *p<0.05 or **p<0.01. For two comparisons a two-tailed t-test was used, for multiple comparisons, one-way ANOVA with Bonferroni post-test was applied. gluc/g, glucose. Galac/G, galactose. Tunica/T, tunicamycin. UDP-GlcNac, UDP-N-acetetylglucosamine. DHAP, dihydroxyacetone-phosphate.
Figure 3:
Figure 3:. PERK increases mitochondrial respiration and electron transport chain supercomplexes in vitro and in vivo.
(A) BNGE analysis of CRISPR mediated ablation of ER stress effectors XBP1, PERK and ATF6. (B-C) Oxygen consumption rates of isolated mitochondria from PERK depleted cells cultured in glucose or galactose (B) or treated with tunicamycin (C) for 24h. (D) ATP/ADP ratio of PERK KO (sgPERK) and negative control (sgNeg) cells after 48 hours in galactose. (E) BNGE immunoblot of SC levels in cells treated with PERK activators DHBDC or CCT020312 for 72h. (F) Mitochondrial respiration of mitochondria isolated from control cells or PERK deficient cells after treatment with PERK activators for 72h. (G) BNGE immunoblot after inhibition of eIF2α phosphorylation with ISRIB. (H) SC levels assessed by BNGE and (I) oxygen consumption measurements of isolated mitochondria from mouse livers 4 days post CCT020312 injections. Immunoblots shown are representative of >3 independent experiments using CII (anti-SDHA) as a loading control. All other experiments are represented as mean ± s.e.m., n>3. Asterisks denote *p<0.05 or **p<0.01. For two comparisons a two-tailed t-test was used, for multiple comparisons, one-way ANOVA with Bonferroni post-test was applied. gluc, glucose. Galac, galactose. Tunica, tunicamycin. CCT, CCT020312.
Figure 4:
Figure 4:. SCAF1 is transcriptionally controlled by the PERK/eIF2α/ATF4 axis to mediate mitochondrial respiration and electron transfer chain supercomplex formation
(A) mRNA levels of CHOP, Cox7a2l/SCAF1 or Cox7a2 measured by qPCR in U2OS cells cultured under galactose at the indicated time points. (B) Galactose-induced mRNA expression levels of SCAF1 in cells cultured in the presence of PERK or eIF2α phosphorylation (ISRIB) inhibitors. (C) SCAF1 mRNA levels upon PERK activation with DHBDC or CCT020312. (D) SC levels, (E) mitochondrial respiration, (F) ATP/ADP ratios and (G) cell proliferation in galactose in CRISPR-Cas9 SCAF1 ablated cells. (H) SC levels, (I) mitochondrial respiration, (J) ATP/ADP ratios, and (K) cell proliferation of ATF4 ablated cells cultured in galactose media. (L) SC levels (left) and cell proliferation (right) under galactose, in ATF4 or PERK depleted cells (for 4 days) with or without ectopic overexpression of SCAF1. Immunoblots shown are representative of >3 independent experiments using CII (anti-SDHA) as a loading control. All other experiments are the mean ± s.e.m., n>3. Asterisks denote *p<0.05, **p<0.01 or ***p<0.001. For two comparisons a two-tailed t-test was used, for multiple comparisons, one-way ANOVA with Bonferroni post-test was applied. gluc, glucose. Galac, galactose. CCT, CCT020312.
Figure 5:
Figure 5:. Nutrient and ER stress induced Supercomplex formation rely on mitochondrial cristae integrity.
(A) OPA1 or MIC60 depleted cells were assessed for SC levels by BNGE (left) and cell proliferation under galactose conditions (right). (B) SCAF1 protein was overexpressed in OPA1 and MIC60 depleted cells. SC levels (left) and cell proliferation (right) was analyzed under galactose conditions. Immunoblots shown are representative of >3 independent experiments using CII (anti-SDHA) as a loading control. All other experiments are the mean ± s.e.m., n>3. Asterisks denote *p<0.05, **p<0.01 or ***p<0.001. For two comparisons a two-tailed t-test was used.
Figure 6:
Figure 6:. PERK activation ameliorates the bioenergetic deficiencies cause by human Complex I mutations.
(A) SC levels assessed by BNGE of ND1 and ND6 mutant cybrid cells treated for 72h with tunicamycin. (B) Oxygen consumption measurements in control cybrids and ND1 tunicamycin treated cells. (C) cell survival of ND1 and ND6 cells pretreated for 72h with DMSO or tunicamycinin in glucose then cultured in galactose media an additional 72 hours. (D) SC levels of ND1 and ND6 mutant cybrid cells treated for 72h with CCT020312. (E) Complex I activity and (F) Oxygen consumption levels in control and ND1 cybrids treated with DMSO or CCT020312. (G) Cell survival of ND1 and ND6 cells treated with DHBDC or CCT020312 in galactose for 72h. (H) SC levels and (I) cell survival of patient-derived fibroblast harboring a mutation in ACAD9 treated with DMSO or PERK activators. (J) ND1 SCAF1-negative and SCAF1-positive cell survival in galactose with DMSO or CCT020312 treatment after 72h. (K) Cell survival in galactose of WT, ND4d, or ND6d mouse fibroblast treated with DMSO or CCT020312 for 72h (L) Model depicting how glucose deprivation leads to an increase in mitochondrial ATP generation. During glucose-deprivation, PERK is activated stimulating increases in mitochondrial cristae density. In parallel, the PERK/eIF2α/ATF4 axis transcriptionally increases SCAF1 levels to assist in the formation of CIII and CIV containing supercomplexes. Overall, these molecular changes are aimed to stimulate the OXPHOS system and increase ATP production. Immunoblots shown are representative of >3 independent experiments using CII (anti-SDHA) as a loading control. All other experiments are represented as mean ± s.e.m., n>3. Asterisks denote *p<0.05, **p<0.01 or ***p<0.001. For two comparisons a two-tailed t-test was used, for multiple comparisons, one-way ANOVA with Bonferroni post-test was applied. Tunica, tunicamycin. CCT, CCT020312.

Comment in

References

    1. Acin-Perez R, Fernandez-Silva P, Peleato ML, Perez-Martos A, and Enriquez JA (2008). Respiratory active mitochondrial supercomplexes. Mol Cell 32, 529–539. - PubMed
    1. Annunziata I, Sano R, and d’Azzo A (2018). Mitochondria-associated ER membranes (MAMs) and lysosomal storage diseases. Cell Death Dis 9, 328. - PMC - PubMed
    1. Bao XR, Ong SE, Goldberger O, Peng J, Sharma R, Thompson DA, Vafai SB, Cox AG, Marutani E, Ichinose F, et al. (2016). Mitochondrial dysfunction remodels one-carbon metabolism in human cells. Elife 5. - PMC - PubMed
    1. Barrow JJ, Balsa E, Verdeguer F, Tavares CD, Soustek MS, Hollingsworth L.R.t., Jedrychowski M, Vogel R, Paulo JA, Smeitink J, et al. (2016). Bromodomain Inhibitors Correct Bioenergetic Deficiency Caused by Mitochondrial Disease Complex I Mutations. Mol Cell 64, 163–175. - PMC - PubMed
    1. Birsoy K, Possemato R, Lorbeer FK, Bayraktar EC, Thiru P, Yucel B, Wang T, Chen WW, Clish CB, and Sabatini DM (2014). Metabolic determinants of cancer cell sensitivity to glucose limitation and biguanides. Nature 508, 108–112. - PMC - PubMed

Publication types

MeSH terms