. 2019 Jul:25:119-130.
doi: 10.1016/j.molmet.2019.04.003. Epub 2019 Apr 10.

An actionable sterol-regulated feedback loop modulates statin sensitivity in prostate cancer

Affiliations

An actionable sterol-regulated feedback loop modulates statin sensitivity in prostate cancer

Joseph Longo et al. Mol Metab. 2019 Jul.

Abstract

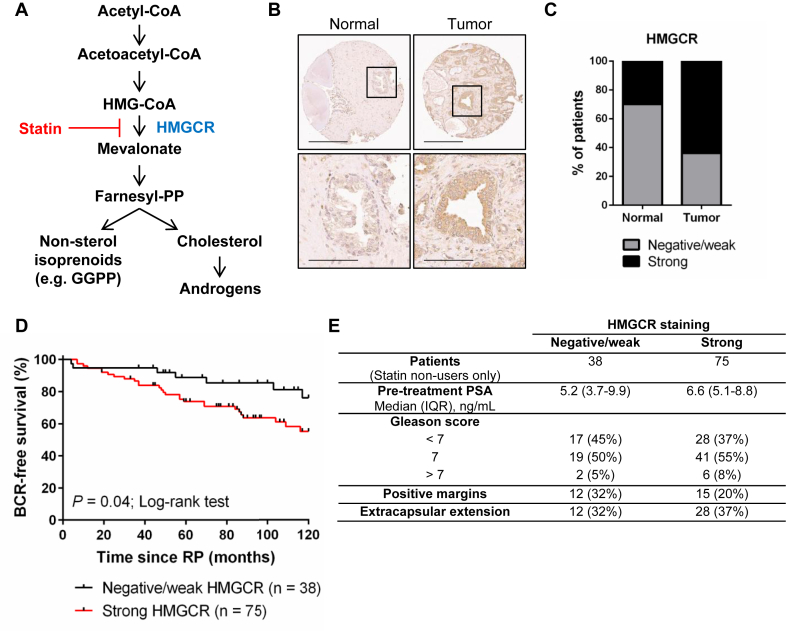
Objective: The statin family of cholesterol-lowering drugs has been shown to induce tumor-specific apoptosis by inhibiting the rate-limiting enzyme of the mevalonate (MVA) pathway, HMG-CoA reductase (HMGCR). Accumulating evidence suggests that statin use may delay prostate cancer (PCa) progression in a subset of patients; however, the determinants of statin drug sensitivity in PCa remain unclear. Our goal was to identify molecular features of statin-sensitive PCa and opportunities to potentiate statin-induced PCa cell death.

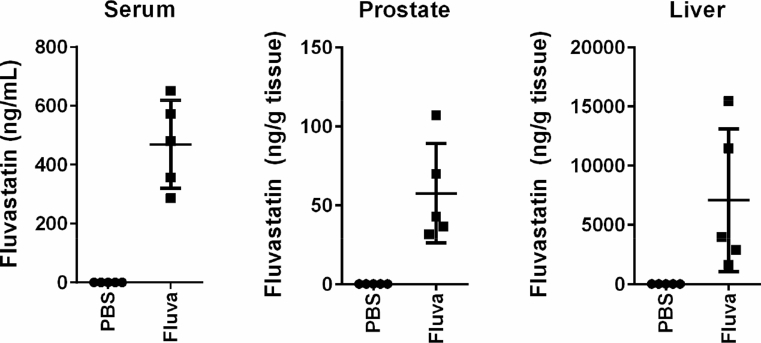
Methods: Deregulation of HMGCR expression in PCa was evaluated by immunohistochemistry. The response of PCa cell lines to fluvastatin-mediated HMGCR inhibition was assessed using cell viability and apoptosis assays. Activation of the sterol-regulated feedback loop of the MVA pathway, which was hypothesized to modulate statin sensitivity in PCa, was also evaluated. Inhibition of this statin-induced feedback loop was performed using RNA interference or small molecule inhibitors. The achievable levels of fluvastatin in mouse prostate tissue were measured using liquid chromatography-mass spectrometry.

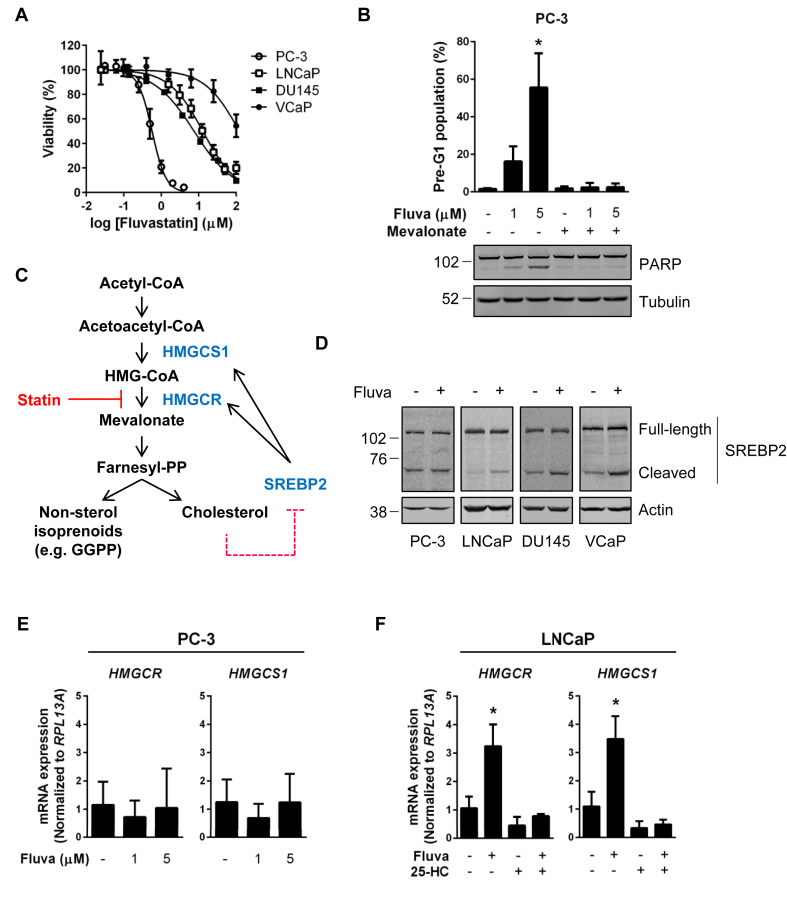
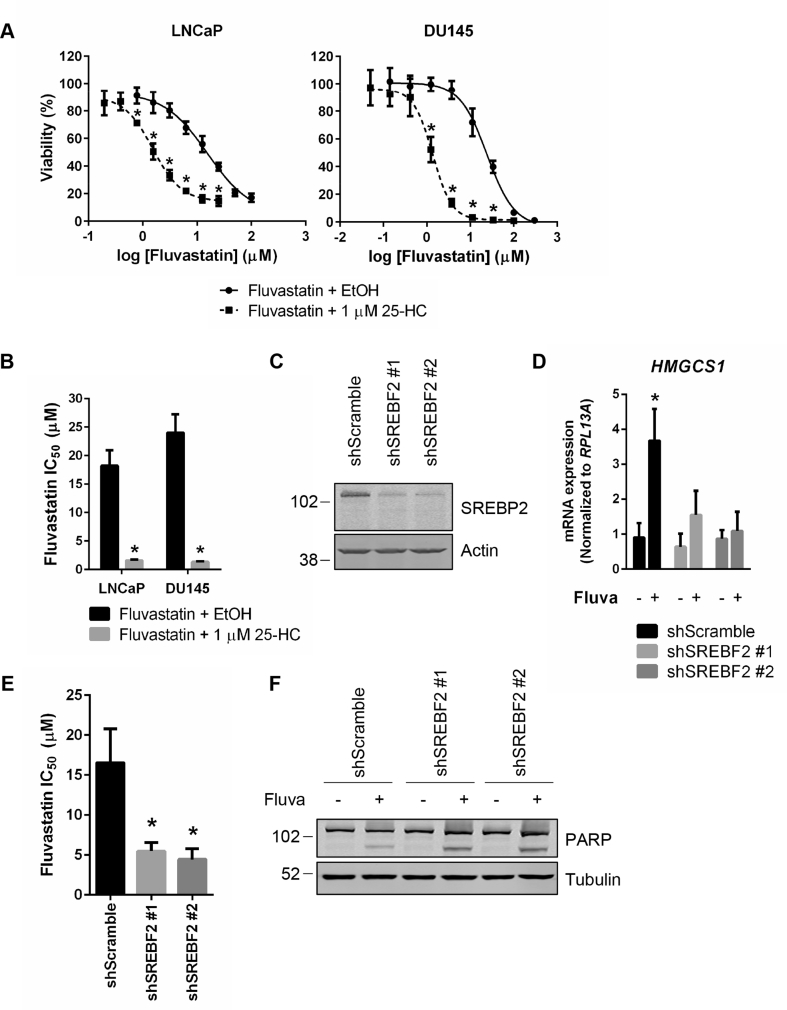
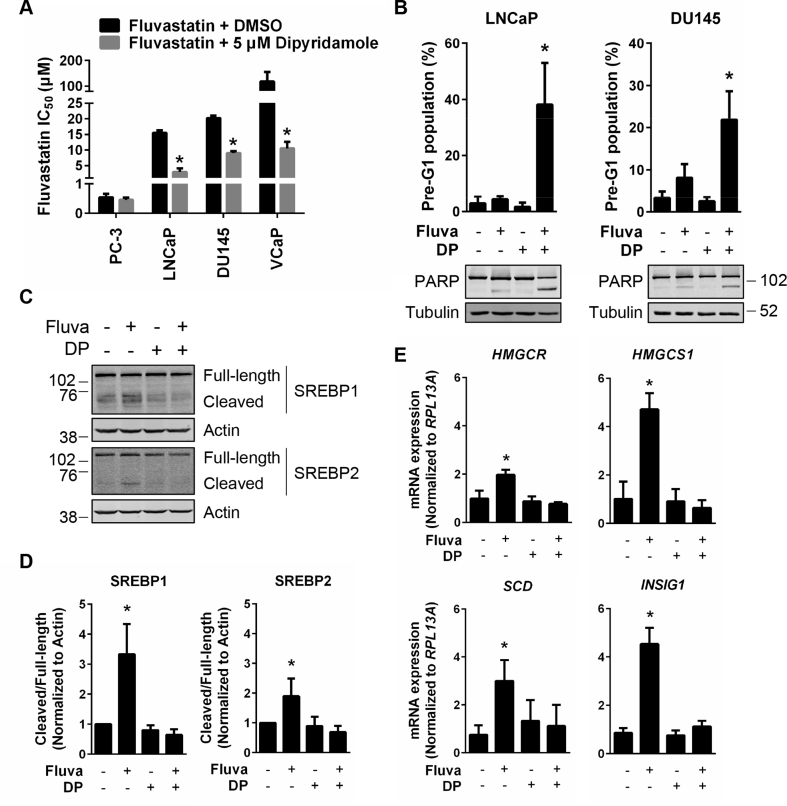
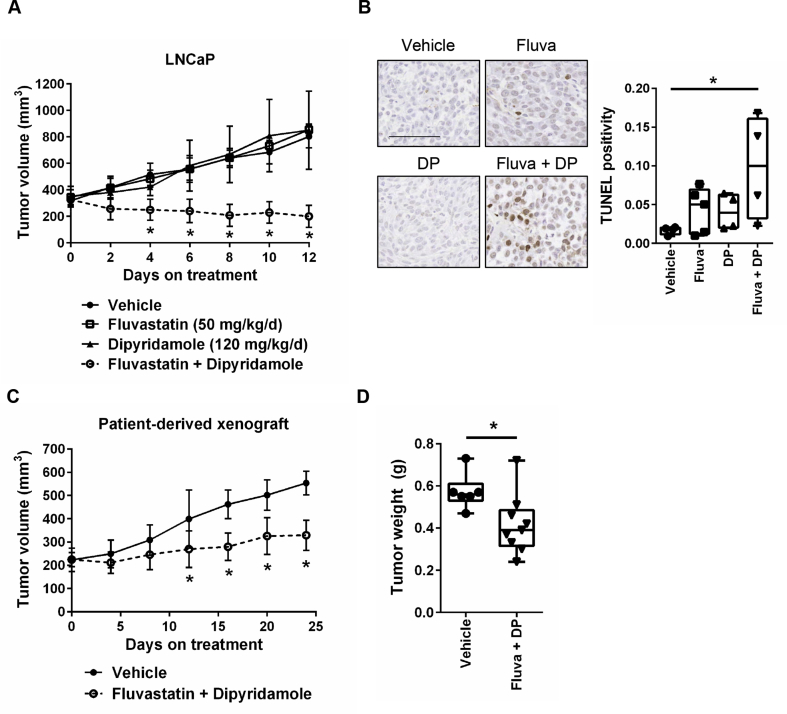
Results: High HMGCR expression in PCa was associated with poor prognosis; however, not all PCa cell lines underwent apoptosis in response to treatment with physiologically-achievable concentrations of fluvastatin. Rather, most cell lines initiated a feedback response mediated by sterol regulatory element-binding protein 2 (SREBP2), which led to the further upregulation of HMGCR and other lipid metabolism genes. Overcoming this feedback mechanism by knocking down or inhibiting SREBP2 potentiated fluvastatin-induced PCa cell death. Notably, we demonstrated that this feedback loop is pharmacologically-actionable, as the drug dipyridamole can be used to block fluvastatin-induced SREBP activation and augment apoptosis in statin-insensitive PCa cells.

Conclusion: Our study implicates statin-induced SREBP2 activation as a PCa vulnerability that can be exploited for therapeutic purposes using clinically-approved agents.

Keywords: Dipyridamole; Drug repurposing; Mevalonate pathway; Prostate cancer; Statins; Tumor metabolism.


Figures

Figure 1
Figure 1
Expression of the metabolic enzyme HMGCR is elevated in primary PCa tissues and is associated with poor prognosis. (A) Schematic representation of the MVA pathway. Statins inhibit the rate-limiting enzyme of the pathway, HMGCR. GGPP = geranylgeranyl pyrophosphate. (B) Representative images of a patient-matched normal and malignant prostate tissue pair stained for HMGCR expression. Scale bars = 300 μm (top row) and 100 μm (bottom row). (C) Prostate tumor tissues stained more intensely for HMGCR expression compared to adjacent normal prostate tissue controls. N = 149 matched normal and tumor tissues. p < 0.0001 (McNemar's test). (D) HMGCR expression in prostate tumors was associated with early biochemical relapse (BCR) in patients who were statin non-users. Hazard Ratio (95% confidence interval) = 0.43 (0.24–0.97); p = 0.04 (Log-rank test). (E) HMGCR expression among statin non-users by clinical and pathological features. IQR = interquartile range.
Figure 2
Figure 2
Fluvastatin can be measured in the mouse prostate. Male NOD/SCID mice were treated with PBS or 50 mg/kg/day fluvastatin by oral gavage for 4 consecutive days. 2 h after the last treatment, serum samples were collected, the mice were euthanized and prostate and liver tissues were harvested. Fluvastatin concentrations were quantified by HPLC-MS/MS. Error bars represent the mean ± SD, n = 5 mice per group.
Figure 3
Figure 3
Sensitivity to HMGCR inhibition is inversely associated with fluvastatin-induced SREBP2 activation in PCa cell lines. (A) PCa cell lines were treated with a range of fluvastatin doses for 72 h, and cell viability was determined using an MTT assay. Error bars represent the mean ± SD, n = 3–5. (B) PC-3 cells were treated with fluvastatin ±200 μM MVA for 72 h, fixed in ethanol and assayed for DNA fragmentation (% pre-G1 population) as a marker of cell death by propidium iodide staining. Error bars represent the mean + SD, n = 3, *p < 0.05 (one-way ANOVA with Tukey's multiple comparisons test). Protein was also isolated from PC-3 cells after 72 h of treatment and immunoblotting was performed to assay for PARP cleavage. (C) Schematic representation of the MVA pathway and its sterol-regulated feedback loop. Depletion of cholesterol following statin-mediated inhibition of HMGCR results in the cleavage and activation of SREBP2 and upregulation of the MVA pathway enzymes HMGCR and HMGCS1. (D) PCa cell lines were treated with 10 μM fluvastatin for 8 h. Protein was then isolated and lysates were analyzed for statin-induced SREBP2 activation by immunoblotting. Both the full-length (inactive) and cleaved forms of SREBP2 were detected. (E) PC-3 cells were treated with 1 or 5 μM fluvastatin for 16 h, and RNA was isolated to assay for HMGCR and HMGCS1 expression by qRT-PCR. mRNA expression data are normalized to RPL13A expression. Error bars represent the mean + SD, n = 3. (F) LNCaP cells were treated with 5 μM fluvastatin ±1 μM 25-hydroxycholesterol (25-HC) for 16 h, and RNA was isolated to assay for HMGCR and HMGCS1 expression by qRT-PCR. mRNA expression data are normalized to RPL13A expression. Error bars represent the mean + SD, n = 3, *p < 0.05 (one-way ANOVA with Bonferroni's multiple comparisons test, where each group was compared to the solvent control group).
Figure 4
Figure 4
Inhibition of the sterol-regulated feedback loop of the MVA pathway potentiates fluvastatin-induced cell death in PCa cell lines. (A) LNCaP and DU145 cells were treated with a range of fluvastatin doses ± a sub-toxic dose (1 μM) of 25-hydroxycholesterol (25-HC) for 72 h, and cell viability was determined using an MTT assay. Error bars represent the mean ± SD, n = 3, *p < 0.05 (Student t test, unpaired, two-tailed). (B) Fluvastatin IC50 values for LNCaP and DU145 cells treated with fluvastatin alone or in combination with 1 μM 25-HC. Error bars represent the mean + SD, n = 3, *p < 0.05 (Student t test, unpaired, two-tailed). (C) LNCaP cells expressing inducible shRNAs against SREBF2 were induced for 72 h with 1 μg/mL doxycycline and protein was isolated to assay for SREBP2 expression by immunoblotting. (D) LNCaP shScramble and shSREBF2 cells were treated with 1 μg/mL doxycycline for 56 h and then EtOH or 10 μM fluvastatin for an additional 16 h in the presence of 1 μg/mL doxycycline. RNA was isolated to assay for HMGCS1 expression by qRT-PCR. mRNA expression data are normalized to RPL13A expression. Error bars represent the mean + SD, n = 3, *p < 0.05 (Student t test, unpaired, two-tailed). (E) LNCaP shScramble and shSREBF2 cells were treated with a range of fluvastatin doses in the presence of 1 μg/mL doxycycline for 72 h, and cell viability was determined using an MTT assay. The IC50 values are plotted. Error bars represent the mean + SD, n = 3, *p < 0.05 (one-way ANOVA with Bonferroni's multiple comparisons test, where each group was compared to the shScramble control). (F) LNCaP shScramble and shSREBF2 cells were treated with EtOH or 10 μM fluvastatin for 72 h in the presence of 1 μg/mL doxycycline. Protein was then isolated to assay for PARP cleavage by immunoblotting.
Figure 5
Figure 5
Dipyridamole inhibits fluvastatin-induced SREBP activation and potentiates fluvastatin-induced apoptosis in PCa cell lines. (A) PCa cell lines were treated with a range of fluvastatin doses ± a sub-lethal dose (5 μM) of dipyridamole for 72 h, and cell viability was determined using an MTT assay. The IC50 values are plotted. Error bars represent the mean + SD, n = 3–5, *p < 0.05 (Student t test, unpaired, two-tailed). (B) LNCaP and DU145 cells were treated with solvent controls, 10 μM fluvastatin, 5 μM dipyridamole (DP) or the combination for 72 h, fixed in ethanol and assayed for DNA fragmentation (% pre-G1 population) as a marker of cell death by propidium iodide staining. Error bars represent the mean + SD, n = 3, *p < 0.05 (one-way ANOVA with Tukey's multiple comparisons test). Protein was also isolated from cells after 72 h of treatment and immunoblotting was performed to assay for PARP cleavage. (C) LNCaP cells were treated with 10 μM fluvastatin ±5 μM DP for 8 h, and protein was isolated to assay for SREBP1 and SREBP2 expression and cleavage (activation) by immunoblotting. (D) SREBP1 and SREBP2 cleavage (cleaved/full-length) was quantified by densitometry and normalized to Actin expression. Error bars represent the mean + SD, n = 3, *p < 0.05 (one-way ANOVA with Bonferroni's multiple comparisons test, where each group was compared to the solvent controls group). (E) LNCaP cells were treated with 10 μM fluvastatin ±5 μM DP for 16 h, and RNA was isolated to assay for HMGCR, HMGCS1, INSIG1 and SCD expression by qRT-PCR. mRNA expression data are normalized to RPL13A expression. Error bars represent the mean + SD, n = 3, *p < 0.05 (one-way ANOVA with Bonferroni's multiple comparisons test, where each group was compared to the solvent controls group).
Figure 6
Figure 6
The combination of fluvastatin and dipyridamole delays prostate tumor growth. (A) Male NOD/SCID mice were injected subcutaneously with 5 million LNCaP cells. Once tumors reached a volume of 200 mm3, the mice were randomized to receive 50 mg/kg/day fluvastatin (oral), 120 mg/kg/day dipyridamole (i.p. injection), the combination or vehicle controls. The drug combination resulted in significantly reduced tumor volumes. Error bars represent the mean ± SD, n = 4–5 mice per treatment group, *p < 0.05 (one-way ANOVA with Tukey's multiple comparisons test). (B) After 12 days of treatment, tumors were excised, fixed and assayed for TUNEL staining by IHC. TUNEL-positive cells were quantified and representative images are shown (scale bar = 100 μm). Box plot with whiskers representing minimum and maximum values, n = 4–5 mice per treatment group, *p < 0.05 (one-way ANOVA with Tukey's multiple comparisons test). (C) Male NOD-SCID mice were engrafted subcutaneously with LTL-484 patient-derived xenograft tissue. Once tumors reached a volume of 200 mm3, the mice were randomized to receive fluvastatin and dipyridamole (as above) or vehicle controls. The drug combination resulted in significantly reduced tumor volumes. Error bars represent the mean ± SD, n = 6–9 mice per treatment group, *p < 0.05 (Student t test, unpaired, two-tailed). (D) After 24 days of treatment, the mice were euthanized, and the tumors were excised and weighed. Tumors from the mice treated with the drug combination weighed significantly less than those from the mice treated with the vehicle controls. Box plot with whiskers representing minimum and maximum values, n = 6–9 mice per treatment group, *p < 0.05 (Student t test, unpaired, two-tailed).

References

    1. Torre L.A., Bray F., Siegel R.L., Ferlay J., Lortet-Tieulent J., Jemal A. Global cancer statistics, 2012. CA. A Cancer Journal for Clinicians. 2015;65(2):87–108. - PubMed
    1. Sanda M.G., Dunn R.L., Michalski J., Sandler H.M., Northouse L., Hembroff L. Quality of life and satisfaction with outcome among prostate-cancer survivors. The New England Journal of Medicine. 2008;358(12):1250–1261. - PubMed
    1. Paller C.J., Antonarakis E.S. Management of biochemically recurrent prostate cancer after local therapy: evolving standards of care and new directions. Clinical Advances in Hematology and Oncology. 2013;11(1):14–23. - PMC - PubMed
    1. Wong W.W.L., Dimitroulakos J., Minden M.D., Penn L.Z. HMG-CoA reductase inhibitors and the malignant cell: the statin family of drugs as triggers of tumor-specific apoptosis. Leukemia. 2002;16(4):508–519. - PubMed
    1. Clendening J.W., Penn L.Z. Targeting tumor cell metabolism with statins. Oncogene. 2012;31(48):4967–4978. - PubMed

Publication types

MeSH terms

Grants and funding