. 2019 Apr 25;8(4):bio038521.
doi: 10.1242/bio.038521.

TXNIP mediates high glucose-induced mitophagic flux and lysosome enlargement in human retinal pigment epithelial cells

Affiliations

TXNIP mediates high glucose-induced mitophagic flux and lysosome enlargement in human retinal pigment epithelial cells

Takhellambam S Devi et al. Biol Open. .

Erratum in

Abstract

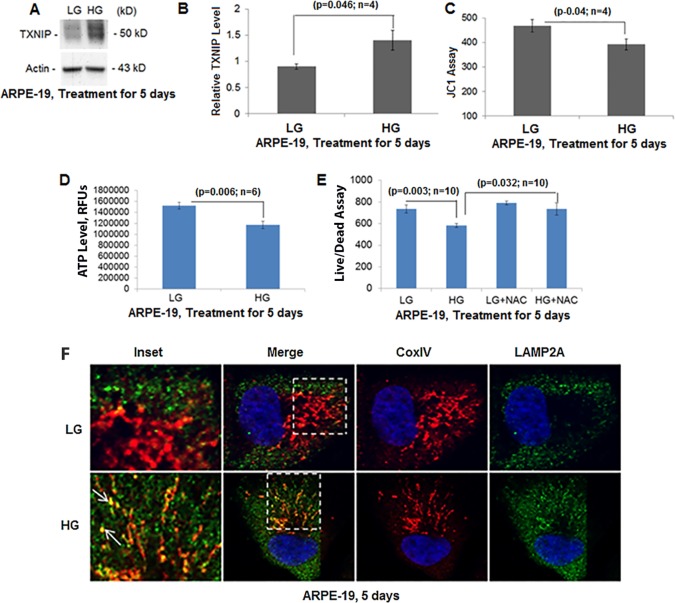
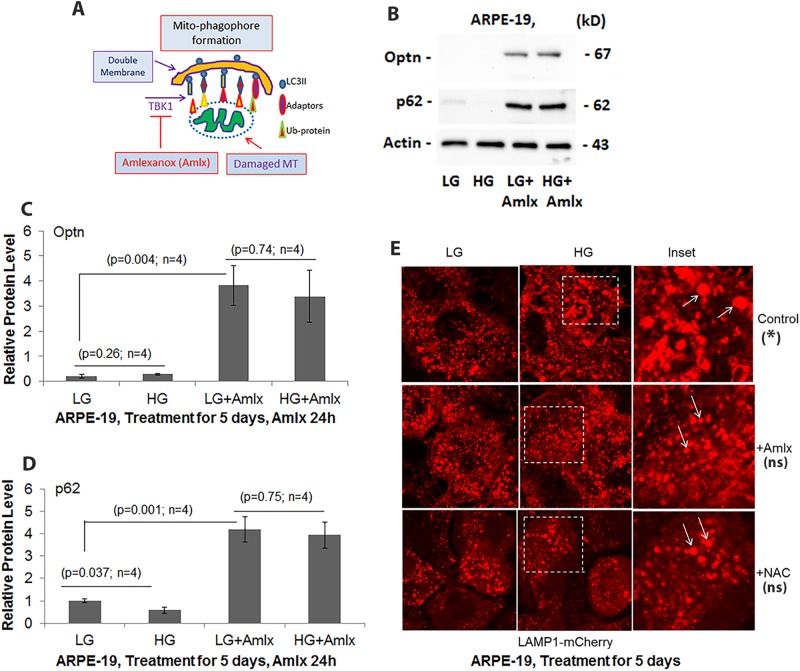
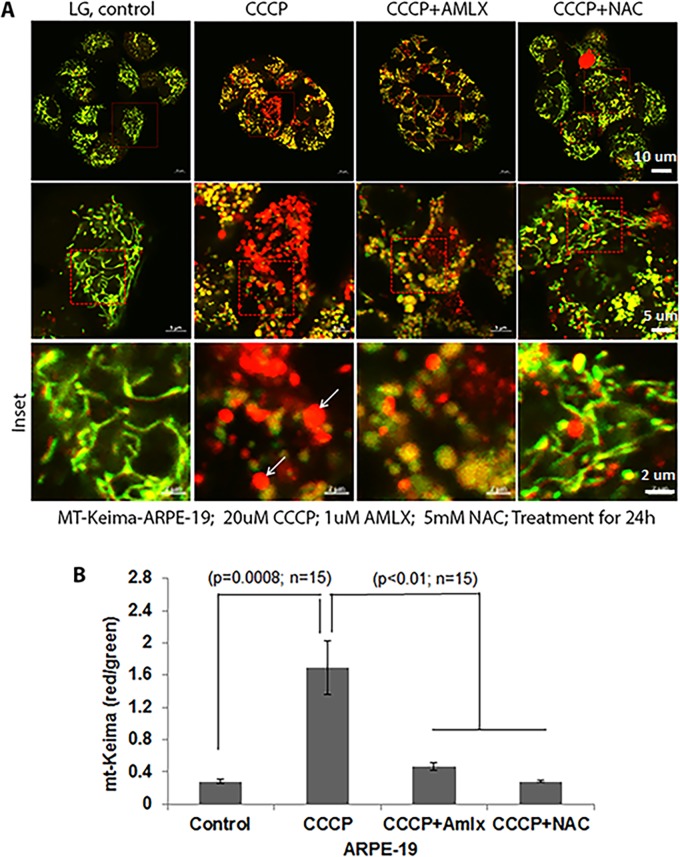
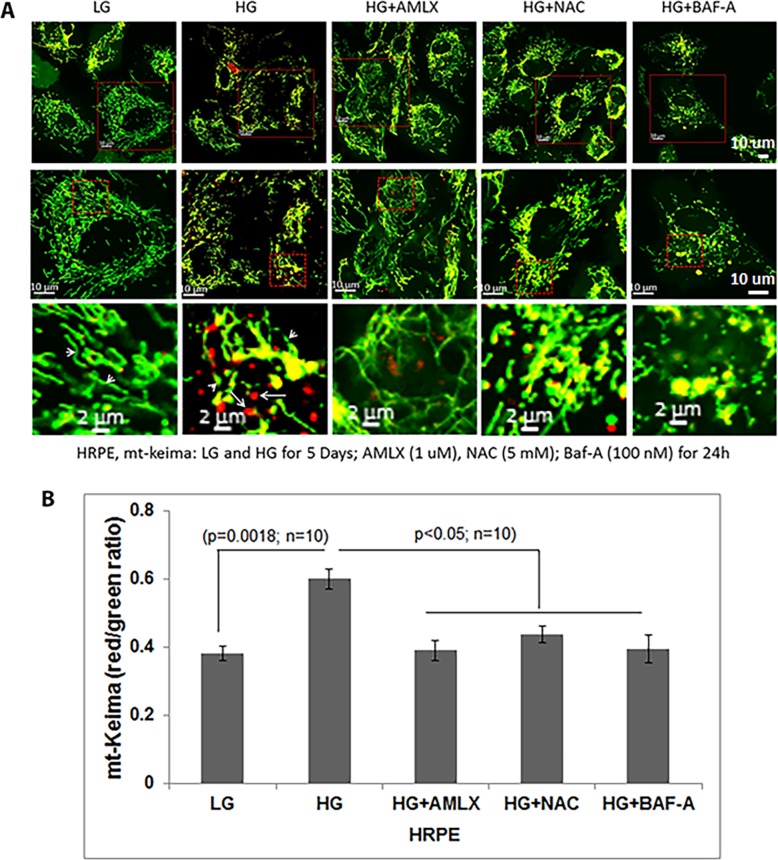
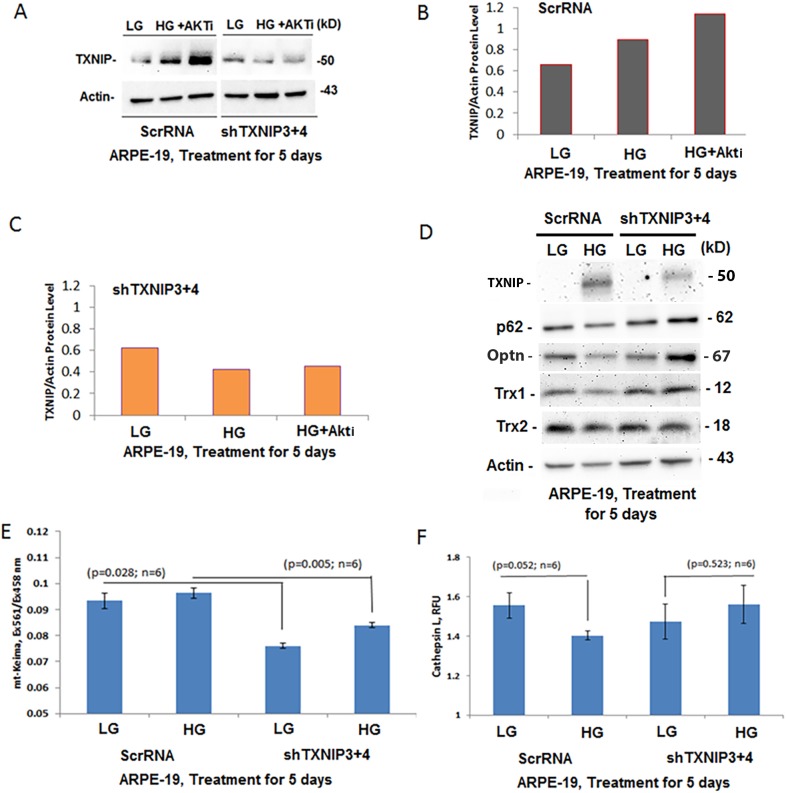
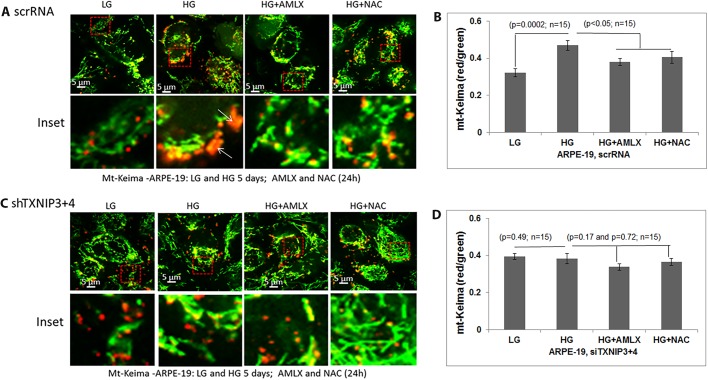
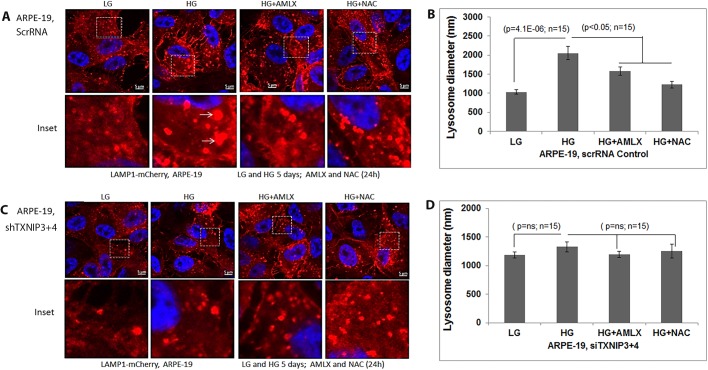
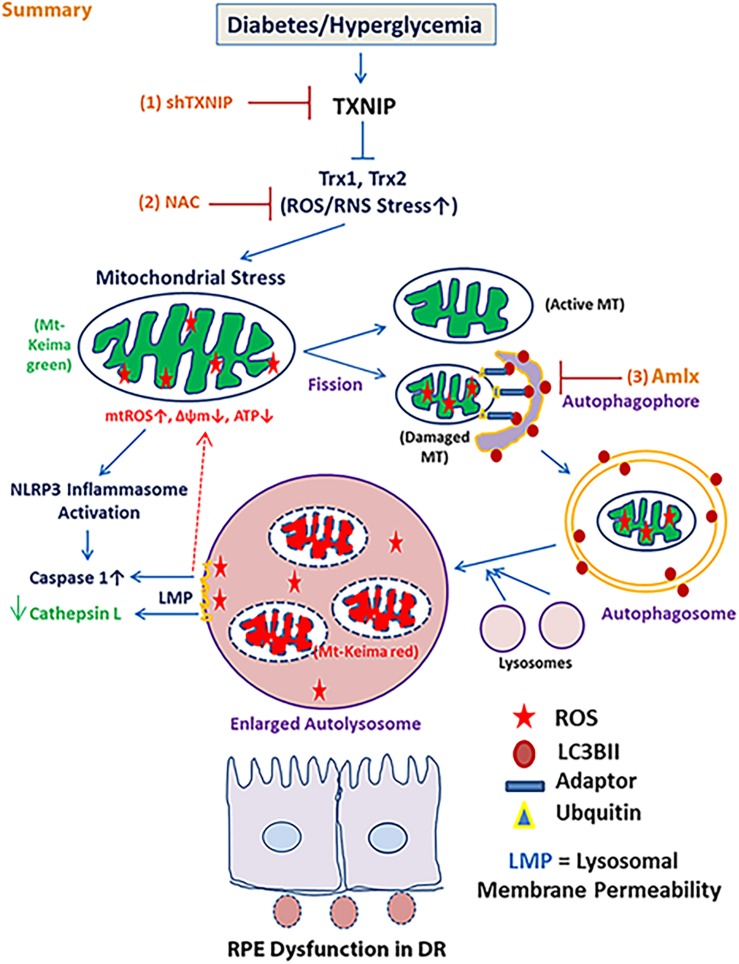
Thioredoxin-interacting protein (TXNIP) plays a critical role in oxidative stress, inflammation, apoptosis and the pathogenesis of diabetic retinopathy (DR). However, the role of TXNIP in high glucose-induced retinal pigment epithelium (RPE) dysfunction is still unknown. Here, we show that high glucose (HG; 25 mM,) significantly increases TXNIP expression at both the mRNA and protein levels when compared to low glucose (LG; 5.5 mM) in a human RPE cell line (ARPE-19) and primary human RPE (HRPE) cells. TXNIP upregulation is associated with mitochondrial membrane depolarization, fragmentation and mitophagic flux to lysosomes. We used confocal live-cell imaging of RPE cells expressing mt-Keima, a coral protein that emits green light in mitochondria (alkaline or neutral pH) and red light in the acidic lysosome, to measure mitophagic flux. We observed an elongated mitochondrial network of green mt-Keima under LG, which is fragmented in HG. Red mt-Keima accumulates in lysosomes as small punctate aggregations under LG in both ARPE-19 and HRPE cells, whereas they are significantly enlarged (two- to threefold) under HG. Lysosomal enlargement under HG is further illustrated by lysosomal membrane protein LAMP1-mCherry expression in both ARPE-19 and HRPE cells. Furthermore, HG causes lysosomal cathepsin L inactivation and pro-inflammatory caspase-1 activation in ARPE-19 cells. TXNIP knockdown by shRNA prevents mitochondrial fragmentation, mitophagic flux and lysosome enlargement under HG. In addition, antioxidant N-acetylcysteine (NAC) and Amlexanox (Amlx), an inhibitor of protein kinase TBK1 and of the mitophagic adaptors Optineurin (Optn) and Sequestosome 1 (p62/SQSTM1), prevent mitophagic flux and lysosome enlargement. These results suggest that TXNIP mediates several deleterious effects of high glucose on RPE, which may be implicated in the development of DR.

Keywords: Hyperglycemia; Lysosome destabilization; Mitophagy; Retinal pigment epithelium; TXNIP.


Conflict of interest statement

Competing interestsThe authors declare no competing or financial interests.

Figures

Fig. 1.
Fig. 1.
High glucose induces TXNIP expression and mitochondrial dysfunction in ARPE-19 cells. (A) Total cell extracts were prepared in RIPA buffer and TXNIP levels were detected on western blots. (B) On densitometric analysis, HG for 5 days significantly (P<0.05; n=4) increases TXNIP levels in ARPE-19 cells compared to LG. (C) HG also causes a reduction in mitochondrial membrane potential as detected by JC1 assay. (D) Correspondingly, ATP levels are reduced significantly (P=0.0006; n=6) by HG. (E) Cell viability is reduced under HG compared to LG, which is prevented by the antioxidant NAC (5 mM). (F) In agreement, mitochondrial ETC complex IV protein CoxIV co-localizes the lysosomal membrane protein LAMP2A (inset, arrows) indicating mitophagic flux to lysosomes. Fixed cell images were captured in a Zeiss confocal microscope at ×630 magnification. A representative image of n=3 is shown.
Fig. 2.
Fig. 2.
TBK1 inhibitor Amlx prevents mitophagic flux and lysosome enlargement in ARPE-19 cells. (A) TBK1 is known to phosphorylate mitophagy adaptors such as Optn and p62/SQSTRM1 and increases their mitophagic activities. (B) Inhibition of TBK1 by Amlx (1 µM) reduces HG-induced mitophagic flux as indicated by increased levels of Optn and p62/SQSTRM1 (p62) in ARPE-19 cells. HG treatment was for 5 days while Amlx and was present for the final 24 h before harvesting the cells. A blot image of n=4 is shown here. (C) Denitometric data analysis of Optn and (D) p62/SQSTM1. (E) Ad-CMV-LAMP1-mCherry was transduced transiently in ARPE-19 cells for 3 days. Lysosomes containing the LAMP1-mCherry, are seen enlarged under HG (upper panels, arrows) compared to LG. Amlx (1 µM) and NAC (5 mM), when present for 24 h, also reduce lysosomal size under HG in ARPE-19 (middle and lower panels, respectively, arrows). Fixed cell images were captured in a Zeiss confocal microscope at ×630 magnification. A representative image of n=3 is shown. * indicates significant lysosomal size enlargement by HG when compared with LG (P<0.05; n=15) while ns represents no significant change in lysosome sizes between HG and LG.
Fig. 3.
Fig. 3.
Mt-Keima as a mitophagy probe. ARPE-19 cells were transduced with Ad-CMV-mt-Keima for 3 days under LG conditions. CCCP, (20 µM) a mitochondrial inner membrane ionophore, was added for 24 h. When present, Amlx (1 µM) and NAC (5 mM) were together with CCCP for 24 h. (A) In ARPE-19 cells, CCCP induces mitophagic flux (enlarged red mt-Keima) compared to in LG. Most mt-Keima in LG remain green filaments, indicating a mitochondrial network (inset). Arrows show red mt-Keima in lysosomes. Both Amlx and NAC reduce red mt-Keima indicating a blockade of mitophagic flux. Live images were captured in a Zeiss confocal microscope at ×630 magnification. A representative image of n=3 is shown. (B) Quantitation of mt-Keima red/green shows significant increases in mitophagic flux by CCCP significantly, which is prevented in the presence of Amlx and NAC.
Fig. 4.
Fig. 4.
High glucose induces mitophagy in human primary HRPE cells. (A) HRPE cells were treated with LG or HG for 5 days in six-well plates containing microscopic slide coverslips. Ad-CMV-mt-Keima was transfected for 3 days. Under LG, mt-Keima is seen as green filaments in mitochondria (lower panel, arrowheads) while under HG, mt-Keima is seen as red in lysosomes and mitochondria are fragmented (lower panel, arrows). Several drugs such as Amlx, NAC and Baf-A prevent the mitophagic flux to lysosomes in HRPE cells as there is predominantly green mt-Keima and less red puncta in the presence of these chemicals. Images were captured in a Zeiss confocal microscope at ×630 magnification. A representative image of n=3 is shown. (B) Quantitation of the mt-Keima red/green in HRPE cells after different treatments seen in A is shown.
Fig. 5.
Fig. 5.
TXNIP knockdown by shRNA in ARPE-19 cells. Various shRNAs targeted to TXNIP (shTXNIP 1, 2, 3 and 4 in pcDNA3.1 plasmid) and their combinations were tested for TXNIP knockdown in ARPE-19 cells after stable cell selection. A combination of shTXNIP3+4 was found most effective and we use it to knock down TXNIP while a scramble shRNA (ScrRNA) was used as a control. Stable cell lines were selected using G417. (A,B) HG increases TXNIP level in ScrRNA control ARPE-19 cells which further increased in the presence of an AKT inhibitor (0.5 µM AKT inhibitor VI, AKTi). Akt is known to phosphorylate and degrade TXNIP protein. (A,C) Conversely, in shTXNIP3+4 ARPE-19 cells, HG or HG+AKTi failed to enhanced TXNIP levels, suggesting a knockdown of TXNIP (n=2). (D) HG also decreases p62/SQSTM1 (p62) and redox proteins Trx1 and Trx2 in scrRNA control ARPE-19 cells. These changes in protein levels are reversed in shTXNIP3+4 ARPE-19 cells, suggesting a role for TXNIP in redox imbalance and mitophagic flux. A representative of n=3 is shown. Densitometric analysis is shown in Fig. S4. (E) In fact, mt-Keima (red/green) ratio, an indicator of mitophagic flux, is also reduced in shTXNIP3+4 cells when compared to scrRNA ARPE-19 cells as measured by a fluorescent microplate reader using Ex561 nm (red) and Ex458 nm (green) while keeping emission at 620 nm for both excitations. (F) HG also reduces lysosomal enzyme cathepsin L activity in ScrRNA ARPE-19 cells while it is prevented in shTXNIP3+4 cells.
Fig. 6.
Fig. 6.
TXNIP knockdown prevents mitophagic flux in ARPE-19 cells. (A) In ScrRNA control ARPE-19 cells, HG (5 days) induces mitophagic flux (enlarged red mt-Keima) as opposed to in LG. Amlx (1 µM) and NAC (5 mM), which were added 24 h before taking the images, prevents red mt-Keima formation, indicating an inhibition of mitophagic flux. Ad-CMV-mt-Keima was transduced transiently for 3 days. Arrows show red mt-Keima in lysosomes. (B) Quantitation of the red/green mt-Keima shows significant increase in mitophagic flux, which is reduced by Amlx and NAC. (C) Effect of HG on mitophagic flux is absent in shTXNIP3+4 cells, indicating a role for TXNIP in HG-induced mitophagic flux in ARPE-19 cells. Furthermore, Amlx and NAC effects on red mt-Keima are absent in shTXNIP3+4 ARPE-19 under HG. Live cell images were captured in a Zeiss confocal microscope at ×630 magnification. A representative image of n=3 is shown. (D) mt-Keima red/green quantitation is shown. No significant change in mt-Keima red/green ratio is seen in shTXNIP3+4.
Fig. 7.
Fig. 7.
TXNIP knockdown prevents lysosome enlargement in ARPE-19 cells. (A) In ScrRNA control ARPE-19 cells, HG (5 days) induces lysosome enlargement (LAMP1-mCherry) compared to LG, which is reduced by Amlx (1 µM) and NAC (5 mM). Ad-CMV-LAMP1-mCherry was transduced for 3 days while Amlx and NAC were added 24 h before taking the images. Arrows show enlarged lysosomes under HG. (B) Quantitation of lysosome sizes in scrRNA ARPE-19 cells with HG in the absence or presence of Amlx and NAC. Significant lysosome size increase is seen with HG but not in the presence of Amlx or NAC. (C,D) The effect of HG on lysosome enlargement is absent in shTXNIP3+4 ARPE-19 cells, indicating a role for TXNIP in HG-induced lysosome enlargement in ARPE-19 cells. A representative image of n=3 is shown.
Fig. 8.
Fig. 8.
A potential role for TXNIP in HG-mediated RPE dysfunction. Diabetes and hyperglycemia upregulates TXNIP and causes cellular ROS/RNS stress, mitochondrial dysfunction, mitophagic flux, lysosome enlargement/destabilization, inflammation and RPE dysfunction. Released lysosomal enzymes may degrade mitochondrial membrane proteins and a vicious cycle of mitochondria–lysosome pathway dysfunction may be established. TXNIP knockdown or mitochondrial targeted antioxidants may prevent several deleterious effects of high glucose and TXNIP on RPE in DR.

References

    1. Abcouwer S. F. and Gardner T. W. (2014). Diabetic retinopathy: loss of neuroretinal adaptation to the diabetic metabolic environment. Ann. N. Y. Acad. Sci. 1311, 174-190. 10.1111/nyas.12412 - DOI - PMC - PubMed
    1. Ahmad F., Nidadavolu P., Durgadoss L. and Ravindranath V. (2014). Critical cysteines in Akt1 regulate its activity and proteasomal degradation: implications for neurodegenerative diseases. Free Radic. Biol. Med. 74, 118-128. 10.1016/j.freeradbiomed.2014.06.004 - DOI - PubMed
    1. Aveleira C. A., Lin C. M., Abcouwer S. F., Ambrósio A. F. and Antonetti D. A. (2010). TNF-α signals through PKCζ/NF-κB to alter the tight junction complex and increase retinal endothelial cell permeability. Diabetes 59, 2872-2882. 10.2337/db09-1606 - DOI - PMC - PubMed
    1. Bodur C., Kazyken D., Huang K., Ekim Ustunel B., Siroky K. A., Tooley A. S., Gonzalez I. E., Foley D. H., Acosta-Jaquez H. A., Barnes T. M. et al. (2018). The IKK-related kinase TBK1 activates mTORC1 directly in response to growth factors and innate immune agonists. EMBO J. 37, 19-38. 10.15252/embj.201696164 - DOI - PMC - PubMed
    1. Burman J. L., Pickles S., Wang C., Sekine S., Vargas J. N. S., Zhang Z., Youle A. M., Nezich C. L., Wu X., Hammer J. A. et al. (2017). Mitochondrial fission facilitates the selective mitophagy of protein aggregates. J. Cell Biol. 216, 3231-3247. 10.1083/jcb.201612106 - DOI - PMC - PubMed