. 2019 Jun 3;218(6):1839-1852.
doi: 10.1083/jcb.201812093. Epub 2019 Apr 25.

Structural basis for the nuclear import and export functions of the biportin Pdr6/Kap122

Affiliations

Structural basis for the nuclear import and export functions of the biportin Pdr6/Kap122

Metin Aksu et al. J Cell Biol. .

Abstract

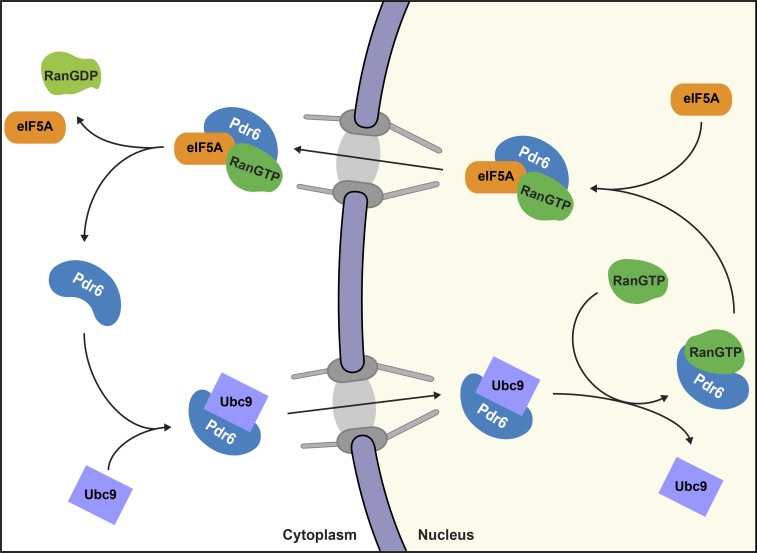
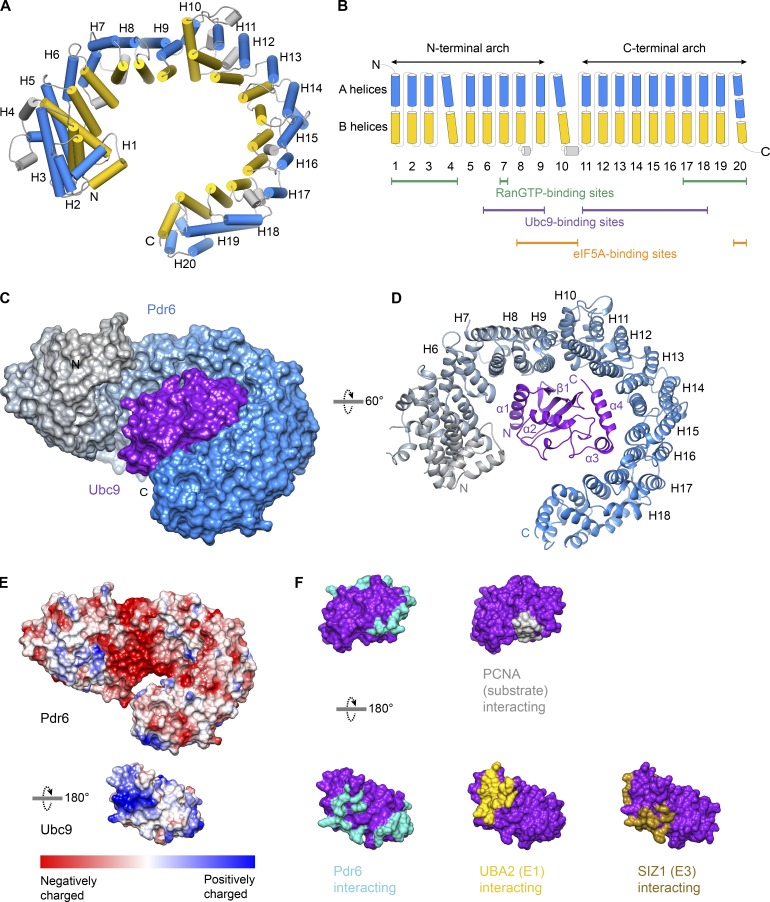
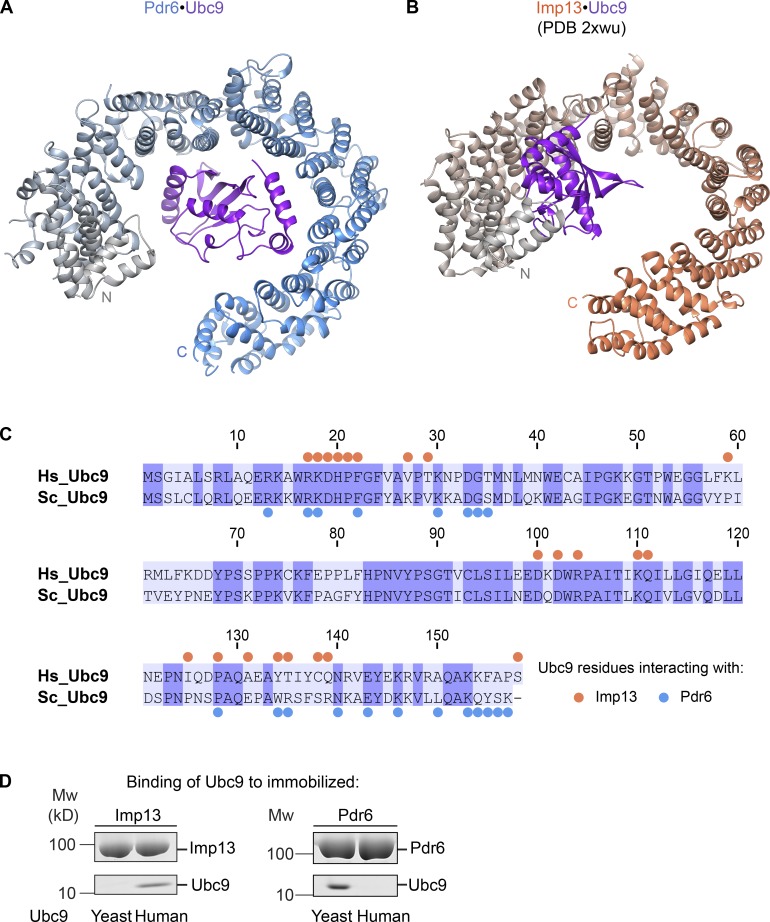
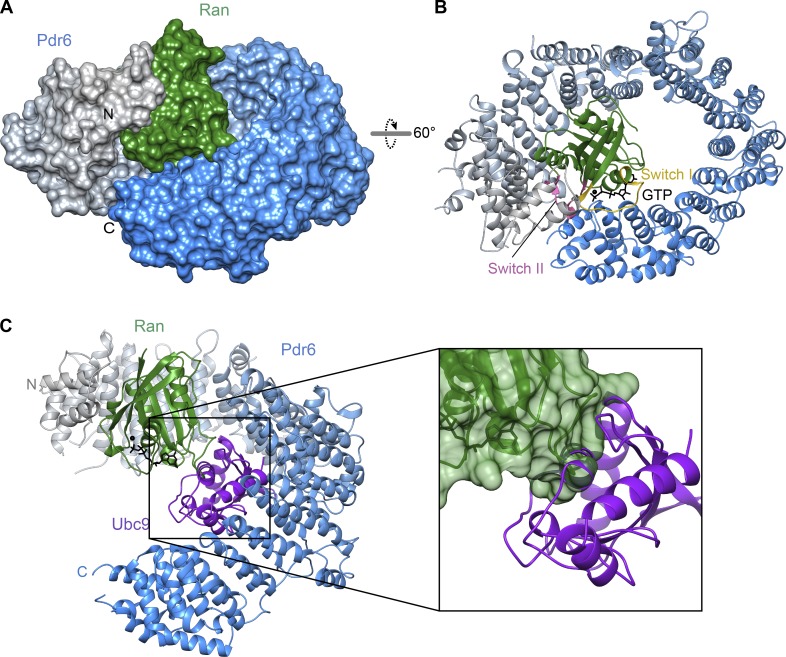
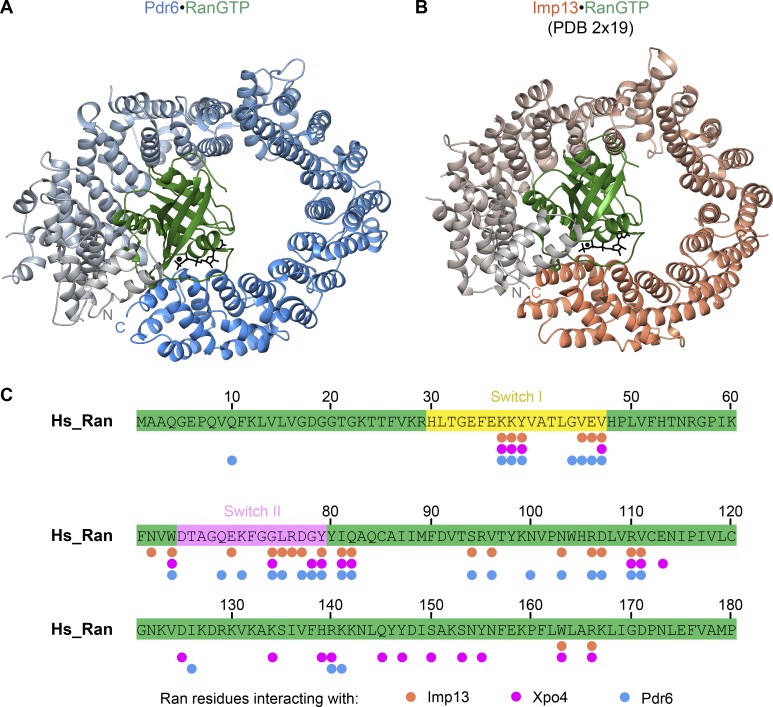
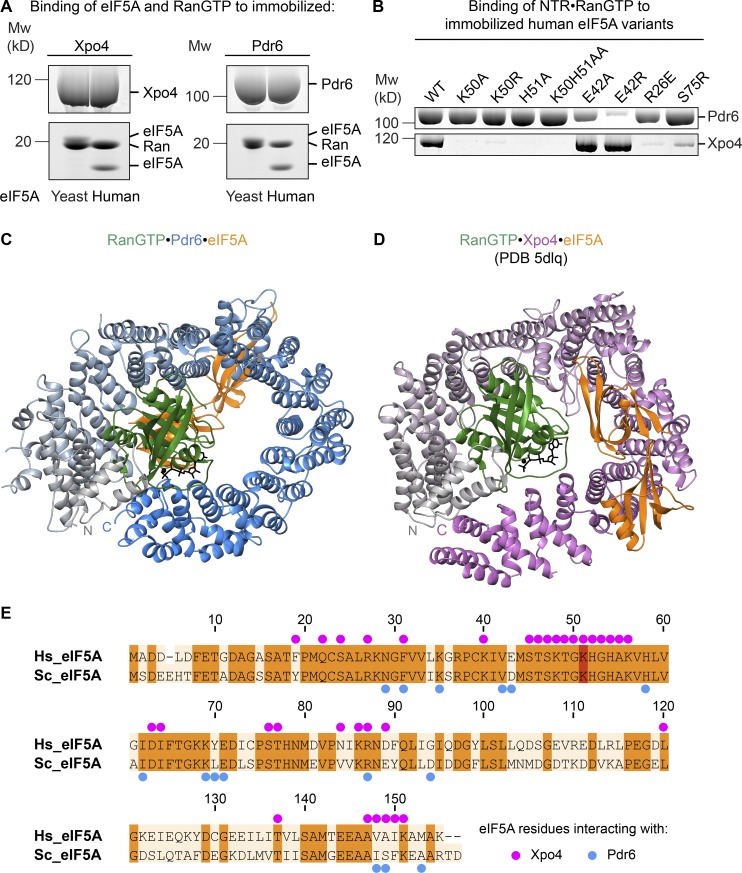
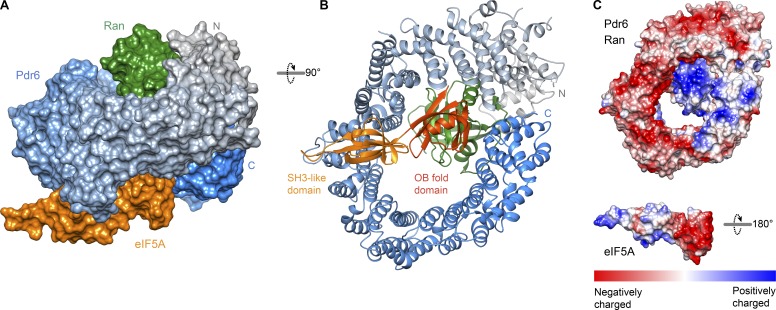
Importins ferry proteins into nuclei while exportins carry cargoes to the cytoplasm. In the accompanying paper in this issue (Vera Rodriguez et al. 2019. J. Cell Biol. https://doi.org/10.1083/jcb.201812091), we discovered that Pdr6 is a biportin that imports, e.g., the SUMO E2 ligase Ubc9 while depleting the translation factor eIF5A from the nuclear compartment. In this paper, we report the structures of key transport intermediates, namely, of the Ubc9•Pdr6 import complex, of the RanGTP•Pdr6 heterodimer, and of the trimeric RanGTP•Pdr6•eIF5A export complex. These revealed nonlinear transport signals, chaperone-like interactions, and how the RanGTPase system drives Pdr6 to transport Ubc9 and eIF5A in opposite directions. The structures also provide unexpected insights into the evolution of transport selectivity. Specifically, they show that recognition of Ubc9 by Pdr6 differs fundamentally from that of the human Ubc9-importer Importin 13. Likewise, Pdr6 recognizes eIF5A in a nonhomologous manner compared with the mammalian eIF5A-exporter Exportin 4. This suggests that the import of Ubc9 and active nuclear exclusion of eIF5A evolved in different eukaryotic lineages more than once and independently from each other.


Figures

Figure 1.
Figure 1.
Schematic illustration of Pdr6’s nucleocytoplasmic transport cycle. Pdr6 is a biportin. It has several alternative import and export cargoes; however, only Ubc9 and eIF5A are shown.
Figure 2.
Figure 2.
Structure of the Pdr6•Ubc9 import complex and overview of Pdr6 secondary structure. (A) Pdr6 in the import complex is shown. A and B helices of the HEAT repeats are represented as cylinders and shown in blue and yellow, respectively. (B) Schematic representation of the Pdr6 secondary structure. Coloring is the same as in A. Tilted cylinders represent interruptions in the right-handed arrangement of successive HEAT repeats. Green, purple, and orange lines below the cylinders indicate repeats that interact with RanGTP, Ubc9, and eIF5A, respectively. (C and D) View of the complex in two different orientations. (C) The import complex is shown as the surface representation. Pdr6 is depicted with a color gradient from gray (N-terminus) to blue (C-terminus) while Ubc9 is shown in purple. (D) The complex is rendered as a ribbon representation. The secondary structure of interacting Pdr6 and Ubc9 regions are labeled. (E) Pdr6 and Ubc9 surfaces are shaded according to electrostatic potential with a color gradient from red (negatively charged, −10 kcal/mol) to blue (positively charged, +10 kcal/mol). Pdr6 is shown in the same orientation as in C while Ubc9 is rotated 180°. (F) Ubc9 is rendered as a surface representation, shaded in purple and shown in two orientations. Interaction interfaces of Ubc9 are marked in cyan (Pdr6 contacts), yellow (UBA2 contacts, PDB 3ONG), brown (SIZ1 contacts, PDB 5JNW), or gray (PCNA contacts, PDB 5JNE).
Figure 3.
Figure 3.
Comparison of import cargo recognition by Pdr6 and Imp13. (A and B) Ribbon representations of Pdr6•Ubc9 (A) and Imp13•Ubc9 complexes (B) are shown. Corresponding Pdr6 and Imp13 structures are aligned with respect to the first three HEAT repeats of the NTRs and shown in the same orientation as in Fig. 2 D. Pdr6 is depicted with a color gradient from gray (N-terminus) to blue (C-terminus) while Imp13 is from gray to salmon. Ubc9 is shown in purple. (C) Sequence alignment of human and yeast Ubc9 is shown with identical residues shaded in purple. Blue and salmon dots represent Ubc9 residues that contact Pdr6 and Imp13, respectively. (D) H14-ZZ-bdSUMO–tagged Pdr6 and Imp13 (1 µM) were incubated with human or yeast Ubc9 (2 µM). Formed import complexes were retrieved via tagged NTRs, eluted by (the tag-cleaving) bdSENP1 protease, and analyzed by SDS-PAGE and Coomassie blue staining.
Figure 4.
Figure 4.
Structure of RanGTP•Pdr6 complex. (A and B) The complex is shown in the same orientation as in Fig. 2 (C and D) after alignment of Pdr6 with respect to the first three HEAT repeats. (A) The complex is shown as a surface representation. Pdr6 is depicted as in Fig. 2 while Ran is shown in green. (B) The complex is rendered as a ribbon representation. Switch I and II regions of Ran are shown as yellow and pink, respectively. GTP (black) is shown as sticks. (C) Pdr6•RanGTP and Pdr6•Ubc9 complexes were superposed via the N-terminal arch of Pdr6, and RanGTP was placed into the import complex. The resulting RanGTP•Pdr6•Ubc9 model is shown as a ribbon representation in the same orientation as in A. In the magnified image, Pdr6 was omitted for clarity, and a transparent surface is shown for RanGTP. Note the clash between Ubc9 and Ran, explaining why the two are antagonistic ligands.
Figure 5.
Figure 5.
Comparison of RanGTP recognition by Pdr6 and Imp13. (A and B) Ribbon representation of Pdr6•RanGTP (A) and Imp13•RanGTP complexes (B) are shown. Corresponding Pdr6 and Imp13 structures are aligned with respect to the first three HEAT repeats of the NTRs and shown in the same orientation as in Fig. 3. Pdr6 and Imp13 are shaded the same as in Fig. 3, while Ran and GTP are in green and black, respectively. (C) RanGTP sequence is shown in green, where Switch I and II regions are highlighted in yellow and pink, respectively. Salmon, magenta, and blue circles represent the Ran residues contacting Imp13, Xpo4, and Pdr6, respectively. Note that the Imp13•RanGTP structure contained yeast Ran (Gsp1p). For simplicity, corresponding human Ran residues are marked in this panel. Xpo4-contacting residues are determined from the RanGTP•Xpo4•eIF5A structure.
Figure 6.
Figure 6.
Comparison of eIF5A recognition by Pdr6 and Xpo4. (A) H14-ZZ-bdSUMO–tagged Pdr6 and Xpo4 (1 µM) were incubated with either human or yeast eIF5A (2 µM) in the presence of RanGTP (2 µM). Formed complexes were retrieved via tagged NTRs, eluted by (the tag-cleaving) bdSENP1 protease, and analyzed by SDS-PAGE and Coomassie blue staining. The identity of each protein band is as indicated in the figure. Note that yeast eIF5A and Ran bands partially overlap in both panels. (B) 1 µM NTR and RanGTP was incubated with 0.75 µM ZZ-bdSUMO–tagged eIF5A wild type or mutants in a 50 mM NaCl buffer. Formed complexes were retrieved via tagged eIF5A, eluted by bdSENP1 protease, and analyzed by SDS-PAGE and Coomassie blue staining. (C and D) Ribbon representation of RanGTP•Pdr6•eIF5A (C) and RanGTP•Xpo4•eIF5A complexes (D) are shown. Structures are aligned with respect to the first three HEAT repeats of Pdr6 and Xpo4 and shown in the same orientation as in Fig. 2 D. Pdr6 is depicted with a color gradient from gray (N-terminus) to blue (C-terminus) while Xpo4 is from gray to magenta. Ran and eIF5A are shown in green and orange, respectively. (E) Sequence alignment of human and yeast eIF5A. Identical residues are shaded in orange and the hypusine-modified lysine in red. Blue and magenta dots represent eIF5A residues that contact Pdr6 and Xpo4, respectively.
Figure 7.
Figure 7.
Structure of the yeast eIF5A export complex. (A and B) View of the trimeric export complex in two different orientations. (A) The complex is shown as a surface representation. Pdr6 is depicted with a color gradient from gray (N-terminus) to blue (C-terminus) while Ran is shown in green, and eIF5A is in orange. (B) The complex is rendered as a ribbon representation. Domains of eIF5A are labeled and shaded accordingly. (C) Pdr6•RanGTP and eIF5A are shaded according to electrostatic potential with a color gradient from red (negatively charged, −10 kcal/mol) to blue (positively charged, +10 kcal/mol). Pdr6•RanGTP is shown in the same orientation as in B while eIF5A is rotated 180°.

References

    1. Adams P.D., Grosse-Kunstleve R.W., Hung L.W., Ioerger T.R., McCoy A.J., Moriarty N.W., Read R.J., Sacchettini J.C., Sauter N.K., and Terwilliger T.C.. 2002. PHENIX: building new software for automated crystallographic structure determination. Acta Crystallogr. D Biol. Crystallogr. 58:1948–1954. 10.1107/S0907444902016657 - DOI - PubMed
    1. Afonine P.V., Grosse-Kunstleve R.W., Echols N., Headd J.J., Moriarty N.W., Mustyakimov M., Terwilliger T.C., Urzhumtsev A., Zwart P.H., and Adams P.D.. 2012. Towards automated crystallographic structure refinement with phenix.refine. Acta Crystallogr. D Biol. Crystallogr. 68:352–367. 10.1107/S0907444912001308 - DOI - PMC - PubMed
    1. Aksu M., Trakhanov S., and Görlich D.. 2016. Structure of the exportin Xpo4 in complex with RanGTP and the hypusine-containing translation factor eIF5A. Nat. Commun. 7:11952 10.1038/ncomms11952 - DOI - PMC - PubMed
    1. Aksu M., Pleiner T., Karaca S., Kappert C., Dehne H.J., Seibel K., Urlaub H., Bohnsack M.T., and Görlich D.. 2018. Xpo7 is a broad-spectrum exportin and a nuclear import receptor. J. Cell Biol. 217:2329–2340. 10.1083/jcb.201712013 - DOI - PMC - PubMed
    1. Baade I., Spillner C., Schmitt K., Valerius O., and Kehlenbach R.H.. 2018. Extensive Identification and In-depth Validation of Importin 13 Cargoes. Mol. Cell. Proteomics. 17:1337–1353. 10.1074/mcp.RA118.000623 - DOI - PMC - PubMed

Publication types

MeSH terms

LinkOut - more resources