. 2019 Apr 25;2(2):e201900364.
doi: 10.26508/lsa.201900364. Print 2019 Apr.

The impact of poly-A microsatellite heterologies in meiotic recombination

Affiliations

The impact of poly-A microsatellite heterologies in meiotic recombination

Angelika Heissl et al. Life Sci Alliance. .

Abstract

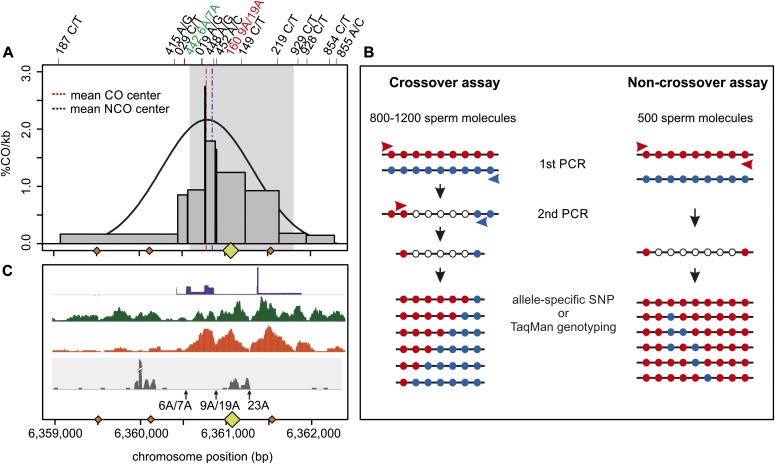
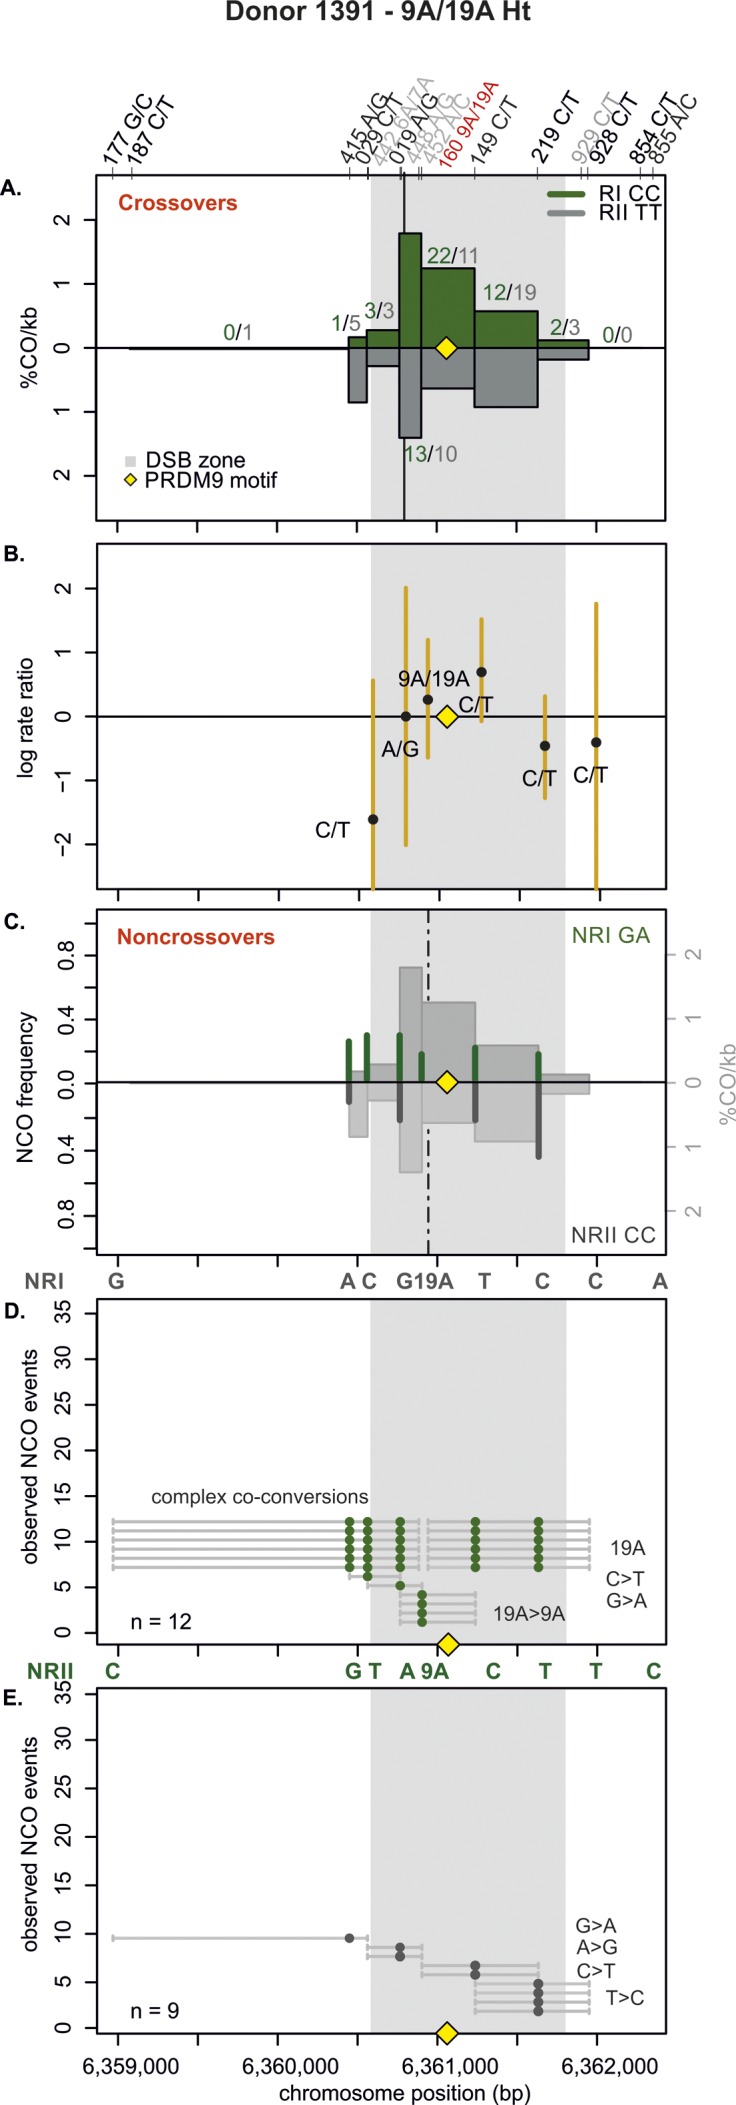
Meiotic recombination has strong, but poorly understood effects on short tandem repeat (STR) instability. Here, we screened thousands of single recombinant products with sperm typing to characterize the role of polymorphic poly-A repeats at a human recombination hotspot in terms of hotspot activity and STR evolution. We show that the length asymmetry between heterozygous poly-A's strongly influences the recombination outcome: a heterology of 10 A's (9A/19A) reduces the number of crossovers and elevates the frequency of non-crossovers, complex recombination products, and long conversion tracts. Moreover, the length of the heterology also influences the STR transmission during meiotic repair with a strong and significant insertion bias for the short heterology (6A/7A) and a deletion bias for the long heterology (9A/19A). In spite of this opposing insertion-/deletion-biased gene conversion, we find that poly-A's are enriched at human recombination hotspots that could have important consequences in hotspot activation.


Conflict of interest statement

The authors declare that they have no conflict of interest.

Figures

Figure 1.
Figure 1.. Features and analysis of HSII.
(A) Distribution of CO breakpoints (grey bars) measured with pooled-sperm typing in eight different donors. The mean CO and NCO centers (dashed lines) were estimated at chr16: 6,360,770±9 bp and 6,360,860±15 bp (GRCh37/hg19), respectively (Figs S1–S6 and Table S2). Orange rhomboids on the x-axis represent the PRDM9A-binding motif with up to one mismatch (CCnCCnTnnCCnC, where n reflects any base A, C, T, G with the same likelihood) (Myers et al, 2008). The larger yellow rhomboid at position chr16: 6,361,057–6,361,088 is likely the most active motif (verified to bind PRDM9 in transfected cells with a significant FIMO score; personal communication and (Altemose et al, 2017). The grey-shaded area represents the DSB region measured in spermatocytes (Pratto et al, 2014). (B) Graphical representation of the pooled-sperm typing assay to collect COs and NCOs. Approximately 800–1,200 or 500 sperm molecules were aliquoted per reaction for collecting COs or NCOs, respectively. COs were amplified with allele-specific primers with a perfect match at the 3′ end to the allele of the recombinant phase (red and blue arrows). The two nested PCRs produced mainly crossover amplicons. The NCO assay used allele-specific primers to amplify only one of the parental homologues. The phase switch of internal alleles representing the NCO was assessed by allele-specific PCRs targeting one SNP at a time. (C) Additional features of HSII as described in Altemose et al (2017). The first lane represents the historical recombination map inferred with LDhat (International Hapmap et al, 2007) in dark blue, the second lane is the measured H3K4me3 in human spermatocytes of PRDM9A carriers (Pratto et al, 2014) in green, and the third lane represents the H3K4me3 sites measured in HEK293T cells transfected with PRDM9B in bright red (Altemose et al, 2017). The grey panel plots the transcripts per million from permanganate/S1 footprinting for single-strand DNA (ssDNA) and non-B DNA sequencing (Kouzine et al, 2017) representing structures flanking non-B DNA. The black arrows denote the location of the three poly-A sites within HSII.
Figure S1.
Figure S1.. Mean CO centers.
Cumulative CO frequencies were plotted against the chromosome position (Ht donors in red and Ho donors in blue) and fitted by a normal distribution (Materials and Methods [Data analysis] section of the Supplementary Information). The most likely targeted PRDM9-binding motif (Altemose et al, 2017 yellow square) is located in the middle of the ChIP-Seq–based DSB hotspot (Pratto et al, 2014 grey shaded zone). The mean CO centers overlap the DSB hotspot and are separated by 45 bp when comparing 9A/19A Ht (6,360,770±9 bp) and 19A/19A Ho (6,360,815±19 bp) donors. The mean CO center is located at position 6,360,780±9 bp.
Figure S2.
Figure S2.. CO centers of individual 9A/19A Ht donors.
Cumulative CO frequencies of each reciprocal RI (red) and RII (blue) of 9A/19A donors were plotted against the chromosome position (bp) and fitted with a normal distribution (Materials and Methods [Data analysis] section of the Supplementary Information). All CO centers overlap with the ChIP-Seq–based DSB hotspot data (Pratto et al, 2014 grey shaded zone). The mostly targeted PRDM9 motif (Altemose et al, 2017 yellow rhomboid) is located in the middle of the DSB zone. (A) Mean CO center of donor 1027. (B) Mean CO center of donor 1034. (C) Mean CO center of donor 1081 (data extracted from Arbeithuber et al (2015)). (D) Mean CO center of donor 1391.
Figure S3.
Figure S3.. CO centers of individual 19A/19A Ho donors. Cumulative CO frequencies of each reciprocal RI (red) and RII (blue) of 19A/19A donors were plotted against the chromosome position [bp] and fitted with a normal distribution (Materials and Methods [Data analysis] section of the Supplementary Information).
All COs overlap with the ChIP-Seq–based DSB hotspot data (Pratto et al, 2014 grey shaded zone). The mostly targeted PRDM9 motif (Altemose et al, 2017 yellow rhomboid) is located in the middle of the DSB zone. (A) Mean CO center of donor 1100. (B) Mean CO center of donor 1227. (C) Mean CO center of donor 1251. (D) Mean CO center of donor 1288.
Figure S4.
Figure S4.. Mean NCO centers.
The mean NCO center for 9A/19A Ht donors and 19A/19A Ho donors was calculated by plotting the cumulative NCO frequencies against the chromosome position (bp) and fitted via SLogistic1 function (Materials and Methods [Data analysis] section of the Supplementary Information). NCO center overlaps the ChIP-Seq–based DSB hotspot (Pratto et al, 2014 grey shaded zone) and the most likely targeted PRDM9-binding motif (Altemose et al, 2017 yellow square).
Figure S5.
Figure S5.. NCO centers of individual 9A/19A Ht donors.
Cumulative NCO frequencies of NRI (red) and NRII (blue) of 9A/19A donors were plotted against the chromosome position (bp) and fitted with a Sogistic1 function (Materials and Methods [Data analysis] section of the Supplementary Information). All NCO centers overlap with the ChIP-Seq–based DSB hotspot data (Pratto et al, 2014 grey shaded zone). The mostly targeted PRDM9 motif (Altemose et al, 2017 yellow rhomboid) is located in the middle of the DSB zone. (A) Mean CO center of donor 1027. (B) Mean CO center of donor 1034. (C) Mean CO center of donor 1081. (D) Mean CO center of donor 1391.
Figure S6.
Figure S6.. NCO centers of individual 19A/19A Ho donors.
Cumulative NCO frequencies of NRI (red) and NRII (blue) of 9A/19A donors were plotted against the chromosome position (bp) and fitted with a Sogistic1 function (Materials and Methods [Data analysis] section of the Supplementary Information). All NCO centers overlap with the ChIP-Seq–based DSB hotspot data (Pratto et al, 2014 grey shaded zone). The mostly targeted PRDM9 motif (Altemose et al, 2017 yellow rhomboid) is located in the middle of the DSB zone. (A) Mean CO center of donor 1100. (B) Mean CO center of donor 1227. (C) Mean CO center of donor 1251. (D) Mean CO center of donor 1288.
Figure 2.
Figure 2.. Recombination frequencies of CO and NCO measured in HSII.
(A) CO and NCO frequencies compared by individual donors and donor groups. CO frequencies (red) of 9A/19A heterozygous (Ht) donors are lower than CO frequencies of homozygous (Ho) donors (dark blue). This trend is reversed for NCOs, in which NCOs are more frequent in Ht (light red) than in Ho (light blue) donors. Error bars denote confidence intervals calculated by an exact two-sided Poisson test. (B) Average CO and NCO frequency in Ht and Ho donor groups.
Figure 3.
Figure 3.. CO and NCO transmission of 9A/19A Ht donor (left) and 19A/19A Ho donor (right).
(A) CO transmission between reciprocals. CO breakpoint distributions of both reciprocal products based on n = 1,313 and 344 collected CO products for donor 1034 and donor 1227, respectively (also see Table S2). Note that numbers on top of the breakpoint sites are normalized to represent equal numbers of collected reciprocals. The average CO centers estimated either for the Ht or the Ho group is denoted by the black vertical lines, the grey area denotes the DSB zone (Pratto et al, 2014), and the yellow rhomboid represents the PRDM9-binding site. Note the absence of breakpoints at the central 9A/19A STR for donor 1034. (B) Biased CO transmission. Transmission differences between the alleles of reciprocal COs estimated by the log rate ratio of the different recombinant haplotypes, calculated as log[(nRI/totalRI)/(nRII/totalRII)], where the denominator is the total number of normalized CO surveyed per reciprocal. The horizontal line at logRR = 0 denotes the expected equal transmission of alleles between the reciprocal recombinant haplotypes. Asterisks denote a significant over-transmission (logRR > 0) or under-transmission (logRR < 0) based on the standardized Pearson residual. Three asterisks denote the strongest biased transmission (P < 0.001), and two and one asterisk represent a P-value of <0.01 and P < 0.05, respectively. (C) NCOs overlap with CO frequencies. Shown are NCO frequencies (Poisson corrected and normalized between reciprocals) as red and blue lines compared with CO frequencies as grey shaded areas from panel A, and the estimated NCO center averaged over Ho or Ht group as a black dashed line. (D, E) Observed NCOs for both reciprocals. Individual NCOs showing the converted alleles. The possible conversion tract length is denoted as a fine horizontal grey line between informative SNPs (shown on top of the panel). The mean conversion tract length is 625 bp and 1,354 bp for donor 1034 of donor 1227, respectively. Most NCOs are single conversions involving only one SNP; however, co-conversions (tracts with more than one converted allele) and complex conversions (conversion tracts with a mixture of converted and original parental alleles) also are observed.
Figure S7.
Figure S7.. CO and NCO transmission of 9A/19A Ht donor (1027).
(A) CO transmission between reciprocals. CO breakpoint distributions of both reciprocal products based on n = 815 collected CO products. Note that numbers on top of the breakpoint sites are normalized between reciprocals and do not represent the actual collected events. The average CO centers estimated for the Ht donors is denoted by the black vertical lines, the grey area denotes the DSB zone (Pratto et al, 2014), and the yellow rhomboid represents the PRDM9-binding site. Note the absence or decrease in breakpoints at the central 9A/19A STR (indicated with a black arrow). (B) Biased CO transmission. Transmission differences between the alleles of reciprocal COs estimated by the log rate ratio of the different recombinant haplotypes, calculated as log[(nRI/totalRI)/(nRII/totalRII)], where the denominator is the total number of normalized CO surveyed per reciprocal. The horizontal line at logRR = 0 denotes the expected equal transmission of alleles between the reciprocal recombinant haplotypes. Asterisks denote a significant over-transmission (logRR > 0) or under-transmission (logRR < 0) based on the standardized Pearson residual. Three asterisks denote the strongest biased transmission (P < 0.001), and two and one asterisk represent a P-value of <0.01 and P < 0.05, respectively. (C) NCOs overlap with CO frequencies. Shown are NCO frequencies (Poisson corrected and normalized between reciprocals) as green and grey lines compared with CO frequencies as grey shaded areas from panel A, and the estimated NCO center averaged over Ht donors as a black dashed line. (D, E) Observed NCOs for both reciprocals. Individual NCOs showing the converted alleles. The possible conversion tract length is denoted as a fine horizontal grey line between informative SNPs (shown on top of the panel). The mean conversion tract length is 908 ± 323 bp. Most NCOs are single conversions involving only one SNP; however, co-conversions (tracts with more than one converted allele) and complex conversions (conversion tracts with a mixture of converted and original parental alleles) also are observed.
Figure S8.
Figure S8.. CO and NCO transmission of 9A/19A Ht donor (1081).
(A) CO transmission between reciprocals. CO breakpoint distributions of both reciprocal products based on n = 582 CO products. Note that numbers on top of the breakpoint sites are normalized between reciprocals and do not represent the actual collected events. The average CO centers estimated for the Ht donors is denoted by the black vertical lines, the grey area denotes the DSB zone (Pratto et al, 2014), and the yellow rhomboid represents the PRDM9-binding site. Note the reduced breakpoints at the central 9A/19A STR (indicated with a black arrow). CO data for donor 1081 were published in Arbeithuber et al (2015). (B) Biased CO transmission. Transmission differences between the alleles of reciprocal COs estimated by the log rate ratio of the different recombinant haplotypes, calculated as log[(nRI/totalRI)/(nRII/totalRII)], where the denominator is the total number of normalized CO surveyed per reciprocal. The horizontal line at logRR = 0 denotes the expected equal transmission of alleles between the reciprocal recombinant haplotypes. Asterisks denote a significant over-transmission (logRR > 0) or under-transmission (logRR < 0) based on the standardized Pearson residual. Three asterisks denote the strongest biased transmission (P < 0.001), and two and one asterisk represent a P-value of <0.01 and P < 0.05, respectively. (C) NCOs overlap with CO frequencies. Shown are NCO frequencies (Poisson corrected and normalized between reciprocals) as green and grey lines compared with CO frequencies as grey shaded areas from panel A and the estimated NCO center averaged over Ht donors as a black dashed line. (D, E) Observed NCOs for both reciprocals. Individual NCOs showing the converted alleles. The possible conversion tract length is denoted as a fine horizontal grey line between informative SNPs (shown on top of the panel). The mean conversion tract length is 1,281 ± 608 bp. Most NCOs are single conversions involving only one SNP; however, co-conversions (tracts with more than one converted allele) also are observed.
Figure S9.
Figure S9.. CO and NCO transmission of 9A/19A Ht donor (1391).
(A) CO transmission between reciprocals. CO breakpoint distributions of both reciprocal products based on n = 135 collected CO products. Note that numbers on top of the breakpoint sites are normalized between reciprocals and do not represent the actual collected events. The average CO centers estimated for the Ht donors is denoted by the black vertical lines, the grey area denotes the DSB zone (Pratto et al, 2014), and the yellow rhomboid represents the PRDM9-binding site. There is no absence of CO breakpoints at the 9A/19A STR detectable because we are missing the resolution here. (B) Biased CO transmission. Transmission differences between the alleles of reciprocal COs estimated by the log rate ratio of the different recombinant haplotypes, calculated as log[(nRI/totalRI)/(nRII/totalRII)], where the denominator is the total number of normalized CO surveyed per reciprocal. The horizontal line at logRR = 0 denotes the expected equal transmission of alleles between the reciprocal recombinant haplotypes. Asterisks denote a significant over-transmission (logRR > 0) or under-transmission (logRR < 0) based on the standardized Pearson residual. Three asterisks denote the strongest biased transmission (P < 0.001), and two and one asterisk represent a P-value of <0.01 and P < 0.05, respectively. (C) NCOs overlap with CO frequencies. Shown are NCO frequencies (Poisson corrected and normalized between reciprocals) as green and grey lines compared with CO frequencies as grey shaded areas from panel A, and the estimated NCO center averaged over Ht donors as a black dashed line. (D, E) Observed NCOs for both reciprocals. Individual NCOs showing the converted alleles. The possible conversion tract length is denoted as a fine horizontal grey line between informative SNPs (shown on top of the panel). The mean conversion tract length is 1,328 ± 1,115 bp. In addition to NCOs involving only a single SNP, co-conversions (tracts with more than one converted allele) and complex conversions (conversion tracts with a mixture of converted and original parental alleles) are observed.
Figure S10.
Figure S10.. CO and NCO transmission of 19A/19A Ho donor (1100).
(A) CO transmission between reciprocals. CO breakpoint distributions of both reciprocal products based on n = 593 collected CO products. Note that numbers on top of the breakpoint sites are normalized between reciprocals and do not represent the actual collected events. The average CO centers estimated for the Ho donors is denoted by the black vertical lines, the grey area denotes the DSB zone (Pratto et al, 2014), and the yellow rhomboid represents the PRDM9-binding site. (B) Biased CO transmission. Transmission differences between the alleles of reciprocal COs estimated by the log rate ratio of the different recombinant haplotypes, calculated as log[(nRI/totalRI)/(nRII/totalRII)], where the denominator is the total number of normalized CO surveyed per reciprocal. The horizontal line at logRR = 0 denotes the expected equal transmission of alleles between the reciprocal recombinant haplotypes. This donor transmitted uniformly between reciprocals. (C) NCOs overlap with CO frequencies. Shown are NCO frequencies (Poisson corrected and normalized between reciprocals) as green and grey lines compared with CO frequencies as grey shaded areas from panel A, and the estimated NCO center averaged over Ho donors as a black dashed line. (D, E) Observed NCOs for both reciprocals. Individual NCOs showing the converted alleles. The possible conversion tract length is denoted as a fine horizontal grey line between informative SNPs (shown on top of the panel). The mean conversion tract length is 887 ± 335 bp. Most NCOs are single conversions involving only one SNP; however, co-conversions (tracts with more than one converted allele) and complex conversions (conversion tracts with a mixture of converted and original parental alleles) also are observed.
Figure S11.
Figure S11.. CO and NCO transmission of 19A/19A Ho donor (1251).
(A) CO transmission between reciprocals. CO breakpoint distributions of both reciprocal products based on n = 271 collected CO products. Note that numbers on top of the breakpoint sites are normalized between reciprocals and do not represent the actual collected events. The average CO centers estimated for the Ho donors is denoted by the black vertical lines, the grey area denotes the DSB zone (Pratto et al, 2014), and the yellow rhomboid represents the PRDM9-binding site. (B) Biased CO transmission. Transmission differences between the alleles of reciprocal COs estimated by the log rate ratio of the different recombinant haplotypes, calculated as log[(nRI/totalRI)/(nRII/totalRII)], where the denominator is the total number of normalized CO surveyed per reciprocal. The horizontal line at logRR = 0 denotes the expected equal transmission of alleles between the reciprocal recombinant haplotypes. Asterisks denote a significant over-transmission (logRR > 0) or under-transmission (logRR < 0) based on the standardized Pearson residual. Three asterisks denote the strongest biased transmission (P < 0.001), and two and one asterisk represent a P-value of <0.01 and P < 0.05, respectively. (C) NCOs overlap with CO frequencies. Shown are NCO frequencies (Poisson corrected and normalized between reciprocals) as green and grey lines compared with CO frequencies as grey shaded areas from panel A, and the estimated NCO center averaged over Ho donors as a black dashed line. (D, E) Observed NCOs for both reciprocals. Individual NCOs showing the converted alleles. The possible conversion tract length is denoted as a fine horizontal grey line between informative SNPs (shown on top of the panel). The mean conversion tract length is 829 ± 370 bp. Most NCOs are single conversions involving only one SNP; however, co-conversions (tracts with more than one converted allele) and complex conversions (conversion tracts with a mixture of converted and original parental alleles) also are observed.
Figure S12.
Figure S12.. CO and NCO transmission of 19A/19A Ho donor (1288).
(A) CO transmission between reciprocals. CO breakpoint distributions of both reciprocal products based on n = 389 collected CO products. Note that numbers on top of the breakpoint sites are normalized between reciprocals and do not represent the actual collected events. The average CO centers estimated for the Ho donors is denoted by the black vertical lines, the grey area denotes the DSB zone (Pratto et al, 2014), and the yellow rhomboid represents the PRDM9-binding site. (B) Biased CO transmission. Transmission differences between the alleles of reciprocal COs estimated by the log rate ratio of the different recombinant haplotypes, calculated as log[(nRI/totalRI)/(nRII/totalRII)], where the denominator is the total number of normalized CO surveyed per reciprocal. The horizontal line at logRR = 0 denotes the expected equal transmission of alleles between the reciprocal recombinant haplotypes. Asterisks denote a significant over-transmission (logRR > 0) or under-transmission (logRR < 0) based on the standardized Pearson residual. Three asterisks denote the strongest biased transmission (P < 0.001), and two and one asterisk represent a P-value of <0.01 and P < 0.05, respectively. (C) NCOs overlap with CO frequencies. Shown are NCO frequencies (Poisson corrected and normalized between reciprocals) as green and grey lines compared with CO frequencies as grey shaded areas from panel A, and the estimated NCO center averaged over Ho donors as a black dashed line. (D, E) Observed NCOs for both reciprocals. Individual NCOs showing the converted alleles. The possible conversion tract length is denoted as a fine horizontal grey line between informative SNPs (shown on top of the panel). The mean conversion tract length is 1,104 ± 440 bp. Most NCOs are single conversions involving only one SNP; however, co-conversions (tracts with more than one converted allele) and complex conversions (conversion tracts with a mixture of converted and original parental alleles) also are observed.
Figure S13.
Figure S13.. Comparison of CCO frequencies and complex conversion frequencies (cNCO) in between donor groups.
CCO frequencies are very similar between donor groups, whereas complex conversion frequencies are significantly increased in Ht compared with Ho donors. Complex conversions (cNCO) mostly occur at the 9A/19A STR (with an over-transmission of the 9A over the 19A) or at SNPs flanking this STR.
Figure 4.
Figure 4.. Poly-A enrichment at recombination hotspots.
(A) The poly-A density is the number of poly-A’s divided by the zone length. For each poly-A tract length (6 to ≥ 26 A’s), the densities were re-normalized [0,1] by the sum of all densities. We extracted poly-A’s (total number of considered poly-A’s, n = 284,302), from the reference genome (GRCh37/hg19) that fall either within hotspots (HS; red), within flanking regions (five sliding windows left and right of the hotspot, each 1 kb in length; 1–5). Hotspots were defined as ±500 bp from the DSB coordinates of PRDM9A carriers identified by (Pratto et al, 2014), leading to an average hotspot length of ∼2 kb. The subsequent zones were chosen as 1-kb segments upstream and downstream from the boundaries of the hotspot (2 kb in total per zone). Note that repeats with at least 26 A’s are pooled into one class. (B) Top panel: the poly-A density is the number of poly-A’s in a zone divided by the length of this zone in base pairs. Bottom panel: the densities of A’s per zone are calculated by dividing the number of A’s (length of the poly-A times its frequency) by the length of the zone in base pairs. The enrichment of poly-A’s within the hotspot compared with the flanking regions is approximately twofold for the poly-A densities and for the densities of A’s (in terms of mean and median). A Kruskal–Wallis test comparing all poly-A’s in hotspots versus all flanking regions leads to highly significant results (P < 1 × 10⁻³ and P < 1 × 10⁻⁵ for poly-A density or density of A’s, respectively). (C) The poly-A densities per base pair are shown stratified with respect to the length of the poly-A tract. (D) The densities in the flanking regions are displayed as fractions relative to the densities within hotspots to better distinguish the enrichment for longer poly-T tracts.
Figure S14.
Figure S14.. Poly-T enrichment at recombination hotspots.
(A) The poly-T zone density is the number of poly-T’s divided by the zone length re-normalized [0,1] by the sum of the all densities. We extracted poly-T’s (total number n = 287,408) from the reference genome (GRCh37/hg19) that fall either within hotspots (HS; red), within flanking regions (five sliding windows left and right of the hotspot, each 1 kb in length; 1–5). Hotspots were defined as ±500 bp from the DSB coordinates of PRDM9A carriers identified by (Pratto et al, 2014) leading to an average hotspot length of ∼2 kb. The subsequent zones were chosen as 1-kb segments upstream and downstream from the boundaries of the hotspot (2 kb in total per zone). Note that repeats with at least 26 T’s were pooled into one class and that we display the outside region (OS) only in panel A. (B) Top panel: the poly-T density is the number of poly-T’s in a zone divided by the length of this zone in base pairs. We calculate the poly-T densities for each zone. Bottom panel: the densities of T’s per zone are calculated by dividing the number of T’s (length of the poly-T times its frequency) by the length of the zone in base pairs. The enrichment of poly-T’s within the hotspot compared with the flanking regions is approximately twofold for the poly-T densities (in terms of mean and median). The same holds for the densities of T’s. A Kruskal–Wallis test comparing all poly-T’s in hotspots versus all flanking regions leads to significant results (P = 0.025 and P = 0.003, respectively). (C) The poly-T densities per base pair shown stratified with respect to the length of the poly-T tract. (D) The densities in the flanking regions are displayed as fractions of the densities within hotspots to better distinguish the enrichment also for longer poly-T tracts.
Figure S15.
Figure S15.. Analysis of poly-A diversity in the SGDP.
Analysis of poly-A’s in the SGDP data within hotspots (red) and flanking regions (five sliding windows left and right of the hotspot, each 1 kb in length). (A) Heterozygosity. (B) Difference in length between the longest and shortest allele (allelic asymmetry). (C) Length differences of alleles (steps between alleles). (D) Total number of different alleles. No significant differences can be observed between hotspots and flanking regions. Note that 57.9% of lobSTR reference sites were variable in West Eurasians of SGDP data. (E) Length difference between the two most common variants (normalized by the number of variants) for each of the five regions. (F) Length difference for most common alleles per region.
Figure S16.
Figure S16.. Poly-A enrichment at recombination hotspots considering variable STRs reported in the SGDP.
(A) The poly-A zone density is the number of poly-A’s divided by the zone length re-normalized [0,1] by the sum of the all densities. We extracted 14,603 poly-A’s larger than 11 from the reference genome (GRCh37/hg19) that fall either within hotspots (HS; red), within flanking regions (five sliding windows left and right of the hotspot, each 1 kb in length; 1–5). Hotspots were defined as ±500 bp from the DSB coordinates of PRDM9A carriers identified by (Pratto et al, 2014), leading to an average hotspot length of ∼2 kb. The subsequent zones were chosen as 1-kb segments upstream and downstream from the boundaries of the hotspot (2 kb in total per zone). Note that repeats with at least 26 A’s were pooled into one class and that we display the outside region (OS) only in subfigure (A). (B) Top panel: the poly-A density is the number of poly-A’s in a zone divided by the length of this zone in base pairs. We calculate the poly-A densities for each. Bottom panel: the densities of A’s per zone are calculated by dividing the number of A’s (length of the poly-A times its frequency) by the length of the zone in base pairs. The enrichment of poly-A’s within the hotspot compared with the flanking regions is ∼1.5- to 2-fold for the poly-A densities. The same holds for the densities of A’s. A Kruskal–Wallis test comparing all poly-A’s in hotspots versus all flanking regions leads to P = 0.01 and 0.06, respectively). (C) The poly-A densities per base pair are shown stratified with respect to the length of the poly-A tract. (D) The densities in the flanking regions are displayed as fractions of the densities within hotspots to better distinguish the enrichment also for longer poly-A tracts.
Figure S17.
Figure S17.. Poly-A enrichment at recombination hotspots considering STRs in the reference genome (length 11–26 A’s).
(A) The poly-A zone density is the number of poly-A’s divided by the zone length. For each poly-A tract length (11 to ≥ 26 A’s) the densities were re-normalized [0,1] by the sum of the all densities. We extracted 34,695 poly-A’s from the reference genome (GRCh37/hg19) that fall either within hotspots (HS; red), within flanking regions (five sliding windows left and right of the hotspot, each 1 kb in length; 1–5). Hotspots were defined as ±500 bp from the DSB coordinates of PRDM9A carriers identified by (Pratto et al, 2014), leading to an average hotspot length of ∼2 kb. The subsequent zones were chosen as 1-kb segments upstream and downstream from the boundaries of the hotspot (2 kb in total per zone). Note that repeats with at least 26 A’s were pooled into one class and that we display the outside region (OS) only in subfigure (A). (B) Top panel: the poly-A density is the number of poly-A’s in a zone divided by the length of this zone in base pairs. We calculate the poly-A densities for each zone. Bottom panel: the densities of A’s per zone are calculated by dividing the number of A’s (length of the poly-A times its frequency) by the length of the zone in base pairs. The enrichment of poly-A’s within the hotspot compared with the flanking regions is approximately twofold for the poly-A densities. The same holds for the densities of A’s. A Kruskal–Wallis test comparing all poly-A’s in hotspots versus all flanking regions leads to highly significant results P = 3.802 × 10⁻⁵ and P = 0.001496, respectively. (C) The poly-A densities per base pair are shown stratified with respect to the length of the poly-A tract. (D) The densities in the flanking regions are displayed as fractions of the densities within hotspots to better distinguish the enrichment also for longer poly-T tracts. Note that all of SGDP sites (plotted in Fig S15) are contained in our data (only perfect repeats were considered), and 46.3% of the reference sites are variable in West Eurasians of SGDP data.
Figure 5.
Figure 5.. DSB repair of central 9A/19A repeat.
(A) The 9A/19A asymmetry can destabilize strand invasion leading to subsequent heteroduplex rejection, resulting in more NCOs via the synthesis dependent strand annealing pathway. (B) The formation of a 10-bp heteroduplex activates the mismatch repair (MMR)/ large loop repair (LLR) system which likely removes the heterology by nuclease cleavage creating a large double-strand gap. Double-strand break repair (DSBR) forms COs or NCOs with large conversion tracts (1). Note that DSBR can also result in NCOs depending on the double Holliday cleavage sites (not indicated in the figure). Orange dashed lines represent the newly synthesized DNA. In case of sister-strand invasion (blue dashed lines), complex conversion tracts are formed (2). If strand displacement happens after the MMR endonucleolytic digestion past the asymmetry, NCOs with large conversion tracts (co-conversions) are formed (3), or alternatively complex conversions retaining the 9A allele via inter-sister repair or possibly by LLR (not indicated) (4).

References

    1. Allers T, Lichten M (2001) Differential timing and control of noncrossover and crossover recombination during meiosis. Cell 106: 47–57. 10.1016/s0092-8674(01)00416-0 - DOI - PubMed
    1. Altemose N, Noor N, Bitoun E, Tumian A, Imbeault M, Chapman JR, Aricescu AR, Myers SR (2017) A map of human PRDM9 binding provides evidence for novel behaviors of PRDM9 and other zinc-finger proteins in meiosis. Elife 6: e28383 10.7554/elife.28383 - DOI - PMC - PubMed
    1. Amos W, Kosanovic D, Eriksson A (2015) Inter-allelic interactions play a major role in microsatellite evolution. Proc Biol Sci 282: 20152125 10.1098/rspb.2015.2125 - DOI - PMC - PubMed
    1. Arbeithuber B, Betancourt AJ, Ebner T, Tiemann-Boege I (2015) Crossovers are associated with mutation and biased gene conversion at recombination hotspots. Proc Natl Acad Sci U S A 112: 2109–2114. 10.1073/pnas.1416622112 - DOI - PMC - PubMed
    1. Arbeithuber B, Heissl A, Tiemann-Boege I (2017) Haplotyping of heterozygous SNPs in genomic DNA using long-range PCR. Methods Mol Biol 1551: 3–22. 10.1007/978-1-4939-6750-6_1 - DOI - PubMed

Publication types

LinkOut - more resources