. 2019 Apr 25;9(1):6573.
doi: 10.1038/s41598-019-43083-z.

Sulfenamide and Sulfonamide Derivatives of Metformin - A New Option to Improve Endothelial Function and Plasma Haemostasis

Affiliations

Sulfenamide and Sulfonamide Derivatives of Metformin - A New Option to Improve Endothelial Function and Plasma Haemostasis

Magdalena Markowicz-Piasecka et al. Sci Rep. .

Abstract

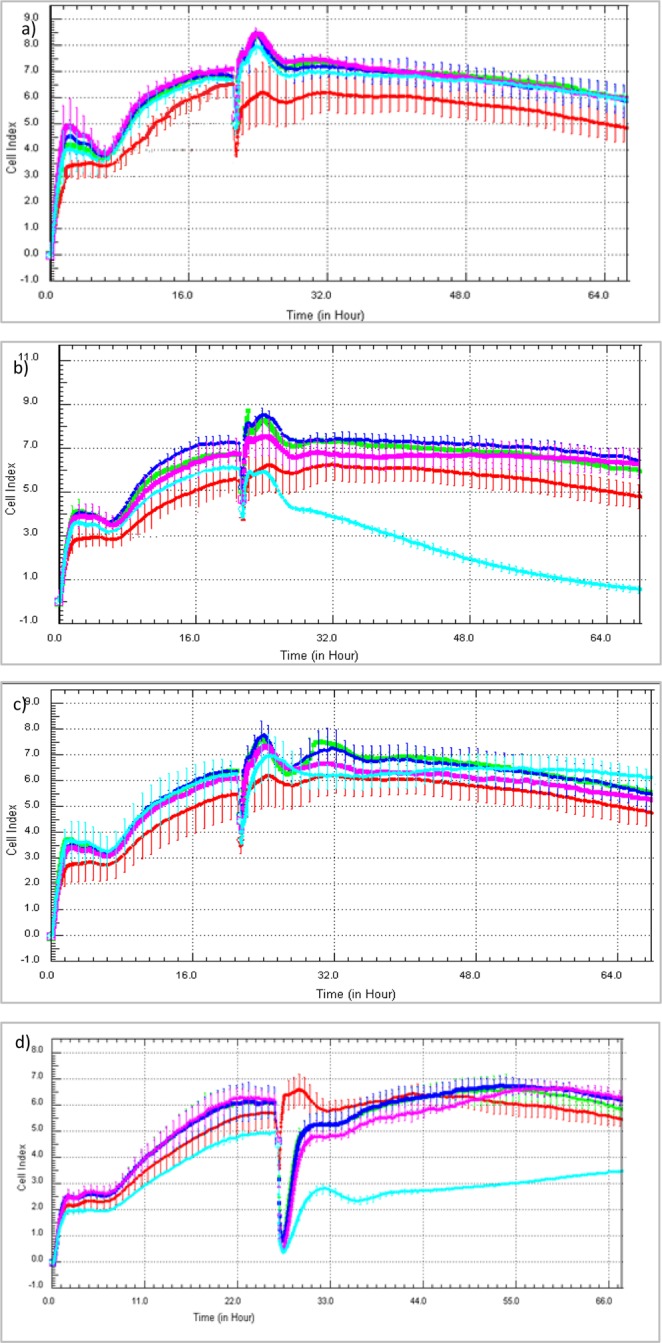
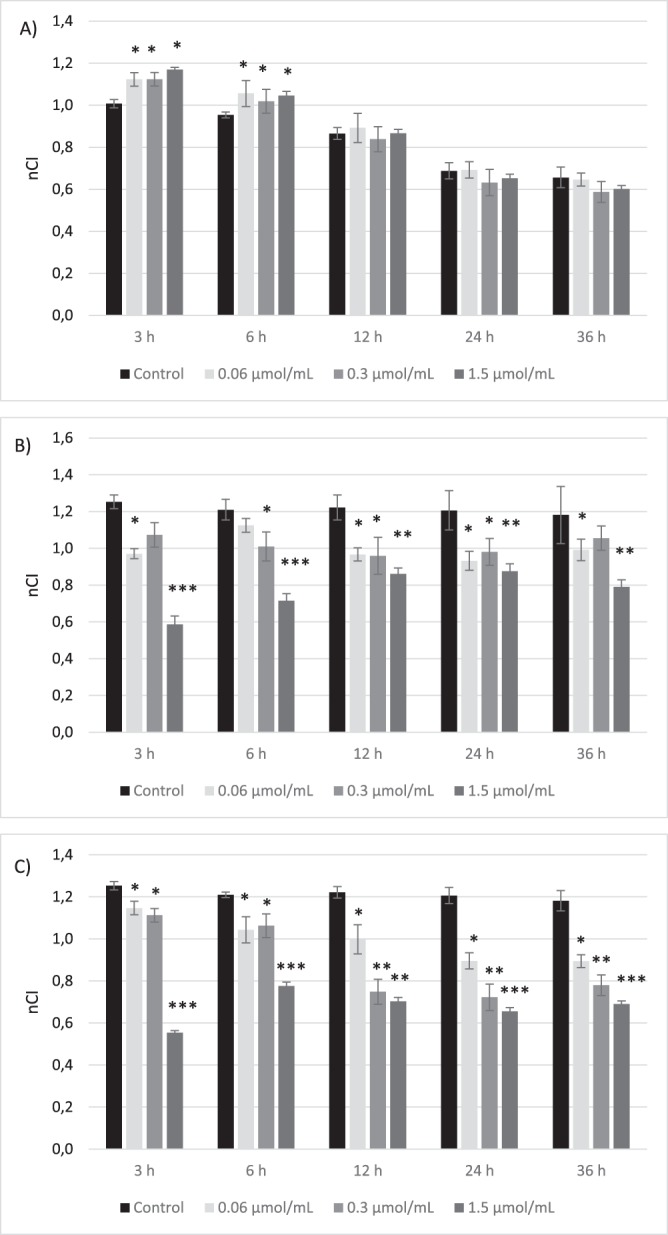
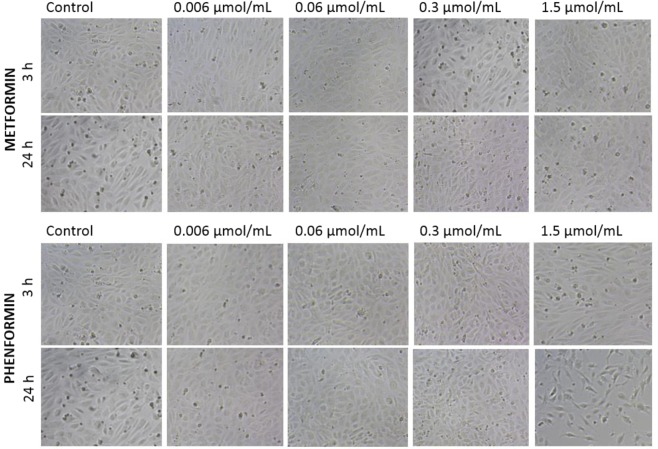
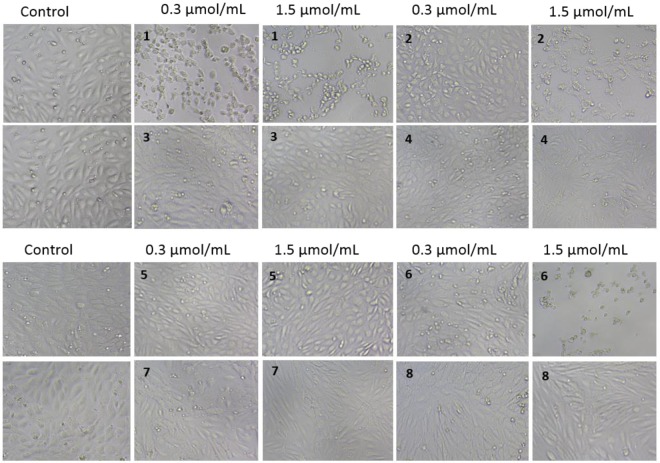
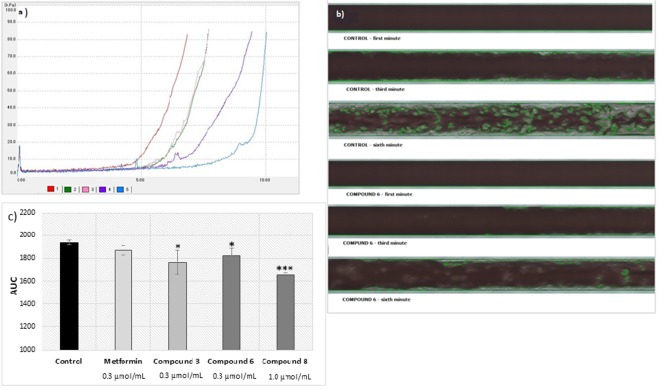
Type 2 diabetes mellitus (T2DM) is a multi-factorial disease which can cause multiple organ dysfunction, including that of the vascular endothelium. The aim of the present study was to evaluate the effects of metformin, and its sulfenamide and sulfonamide derivatives (compounds 1-8) on the selected markers of endothelial function and blood coagulation. The integrity of endothelial cells(ECs) was examined using the real-time cell electric impedance system. Tissue Factor(TF) production, the release of von Willebrand Factor (vWF) and tissue plasminogen activator(t-PA) from ECs were determined using immunoenzymatic assays, while the process of platelet thrombus formation using the Total Thrombus-Formation Analysis System. Sulfenamide with n-butyl alkyl chain(3) does not interfere with ECs integrity, and viability (nCI(24h) = 1.03 ± 0.03 vs. 1.06 ± 0.11 for control), but possesses anticoagulation properties manifested by prolonged platelet-dependent thrombus formation (Occlusion Time 370.3 ± 77.0 s vs. 286.7 ± 65.5 s for control) in semi-physiological conditions. Both p- and o-nitro-benzenesulfonamides (compounds7,8) exhibit anti-coagulant properties demonstrated by decreased vWF release and prolonged parameters of platelet thrombus formation and total blood thrombogenicity. In conclusion, chemical modification of metformin scaffold into sulfenamides or sulfonamides might be regarded as a good starting point for the design and synthesis of novel biguanide-based compounds with anticoagulant properties and valuable features regarding endothelial function.


Conflict of interest statement

The authors declare no competing interests.

Figures

Figure 1
Figure 1
Chemical structure of tested biguanide derivatives – metformin, phenformin and compounds 1–8.
Figure 2
Figure 2
The effect of the exposure of biguanides (a – metformin, b – phenformin, c – comp. 3, d – comp. 7) on human vascular endothelial cells (HUVECs) measured by RTCA-DP system. The pictures present representative plots of one experiment conducted in duplicates (the results are presented as a mean (solid line) ± standard deviation). For the statistical analysis there were conducted three independent experiments. Red line – control (unstimulated cells); green line – compounds at the concentration of 0.006 µmol/mL; navy blue line − 0.06 µmol/mL; pink line − 0.3 µmol/mL; light blue line − 1.5 µmol/mL. CI – Cell index.
Figure 3
Figure 3
The effect of the stimulation of endothelial cells with biguanides (a – metformin, b – phenformin, c – sulfenamides (1–5), d – sulfonamides (6–8)) measured by RTCA-DP at different time-points. The figures present the calculated normalized Cell Index values (nCI).
Figure 4
Figure 4
The effect of the stimulation of human aortal smooth muscle cells (AoSMC) with biguanides (A – metformin, B – sulfenamide 3, C – sulfonamide 8) measured by RTCA-DP at different time-points. The figures present the calculated normalized Cell Index values (nCI). The results are presented as mean ± SD, n = 4–5; *p < 0.05, **p < 0.01, ***p < 0.001.
Figure 5
Figure 5
Time- and dose-dependent effect of metformin and phenformin on endothelial cell (HUVECs) viability and integrity. HUVECs were cultured in the presence of metformin or phenformin at concentrations of 0.006–1.5 μmol/mL; cultures in medium alone were also used as controls. Representative phase-contrast cell images are shown after three and 24 hours of incubation (100-fold magnification).
Figure 6
Figure 6
Dose-dependent effect of biguanides (compounds 1–8) on endothelial cell (HUVECs) viability and integrity after 24-hour incubation. HUVECs were cultured without (control) and in the presence of compounds 1–8 at concentration of 0.006–1.5 μmol/mL. Representative cell images are shown for concentration 0.3 and 1.5 μmol/mL (100-fold magnification).
Figure 7
Figure 7
Dose-dependent effect of selected biguanides on aortal smooth muscle cells (AoSMC) viability and integrity after 3- and 24-hour incubation. AoSMCs were cultured without (control) and in the presence of biguanides at concentration of 0.006–1.5 μmol/mL. Representative cell images are shown for concentration 0.3 and 1.5 μmol/mL (100-fold magnification).
Figure 8
Figure 8
The effect of selected biguanides on HUVECs death. (a) Representative histograms of unstimulated HUVECs (control, CTR), metformin (0.3 μmol/mL) and (phenformin 0.3 μmol/mL) displaying the percentage of cells gathered within established gates. (b) Representative histograms of unstimulated HUVECs (control, CTR), and compound 3 at the concentration of 0.06 μmol/mL (comp. 3 – a) and 0.3 μmol/mL (comp. 3 – b) displaying the percentage of cells gathered within established gates. FSC-A vs SSC-A plots were used for gating cells and to identify any changes in the scatter properties of the cells. Annexin V FITC-A (x-axis) vs Propidium Iodide (y-axis) plots from the gated cells show the populations corresponding to living cells (Annexin V(−) and PI (−)) (D–); early apoptotic cells (Annexin V (+) and PI (−)) (D+−), late-apoptotic cells (Annexin V(+) and PI (+)), and necrotic cells (Annexin V (−) and PI (+)) (D−+).
Figure 9
Figure 9
The effects of metformin and biguanide derivatives on selected markers of endothelial function. (a) The effects of metformin and n-butyl sulfenamide (comp. 3) on the total cellular production of TF in undisturbed HUVEC cells. The results are presented as mean ± SD; n = 4; *p < 0.05; **p < 0.01; ***p < 0.001. The quantification of TF in cell lysates was conducted using immunohistochemichal ELISA test. Metformin over the entire concentration range contributed to the increase in the intracellular TF level, however, the significant results were reported for 0.006 and 1.5 μmol/mL. Compound 3 also elevated the concentration of intracellular TF. (b,c) The effects of metformin, phenformin (a) and n-octyl sulfenamide (comp. 2) and sulfonamide 8 (comp. 8) (b) on the release of von Willebrand Factor from HUVEC cells. The results are presented as mean ± SD; n = 4–6, * denotes p < 0.05. The quantification of vWF in cell culture supernatants was carried out using immunohistochemichal ELISA test. Metformin and phenformin over the entire concentration range contributed to the decrease in the amount of released vWF, however, the changes were not statistically significant (p > 0.05). Compound 2 was shown to exert complex effects on vWF release, while compound 8 decreased the concentration of vWF in cells supernatants over the entire concentration tested. (d,e). The effects of metformin (d), and sulfonamide 7 (e) on the release of t-PA from undisturbed HUVEC cells. The results are presented as mean ± SD; n = 4, ** denotes p < 0.01; ***p < 0.001. The quantification of t-PA in cell culture supernatants was carried out using immunohistochemical ELISA test. Metformin over the entire concentration range contributed to the significant increase in the amount of released t-PA (p < 0.05). Compound 7 was shown to decrease t-PA release at the concentration of 0.3 and 1.0 µmol/mL.
Figure 10
Figure 10
The effect of biguanide derivatives on ICAM-1 expression on HUVECs. (A) Representative histograms of unstimulated HUVECs (control – CD54, and isotype control - izoCD), and cells treated with metformin (0.06 and 0.3 μmol/mL) displaying the percentage of cells in gate B (left pictures) and percentage of cells expressing ICAM (right image). (B) The effects of compounds 2–6 at the highest concentrations on the percentage change of the surface ICAM-1 expression (representative histograms). (C) The summary of effects of metformin, phenformin, compounds 7 and 8 on the ICAM-1 expression (n = 3–6), mean ± SD; ***p < 0.05.
Figure 11
Figure 11
Evaluations of effects of selected biguanides on the platelets-dependent thrombus formation. A collagen coated microchip (Platelet Chip; PL-Chip) was used for analysis of platelet-dependent thrombus formation at 2000 s−1. (A) The effects of sulfenamides 2, 3, 4 and sulfonamide 7 on the occlusion time (OT). The results are presented as mean ± SD; n = 3, ** denotes p < 0.01. (B) Representative plots for T-TAS data obtained in healthy control sample (blue colour) and after stimulation with compound 2 (0.3 μmol/mL) (light pink) or compound 3 (0.3 μmol/mL) (green). X-axis – time (minutes); Y-axis – pressure (kPa). (C) Camera image of blood flow and platelet thrombus formation in control sample and sample treated with compound 2 (0.3 μmol/mL). (D) Concentration-dependent effects of compounds 7 and 8 on the area under the curve (AUC). The results are presented as mean ± SD; n = 3, ** denotes p < 0.01.
Figure 12
Figure 12
Evaluations of effects of selected biguanides on the white thrombus formation. A collagen and thromboplastin coated microchip (Atheroma Chip; AR-Chip) was used for analysis of fibrin rich platelets thrombus formation at 600 s−1. (a) Representative plots for T-TAS data obtained in healthy control sample (red colour) and after stimulation with metformin (0.3 μmol/mL) (green), compound 3 (0.3 μmol/mL) (pink), compound 6 (0.3 μmol/mL) (purple) or compound 8 (1.0 μmol/mL) (blue colour); X-axis – time (minutes); Y-axis – pressure (kPa). (b) Camera image of blood flow and white thrombus formation in control sample and sample treated with compound 6 (0.3 μmol/mL). The formation of white thrombus is marked with green lines. (c) Concentration-dependent effects of metformin and compounds 3, 6 and 8 on the area under the curve (AUC). The results are presented as mean ± SD; n = 3, * denotes p < 0.05; ***p < 0.001.

References

    1. Grzybowska M, Bober J, Olszewska M. Metformin - mechanisms of action and use for the treatment of type 2 diabetes mellitus. Postep. Hig Med Dosw. 2011;65:277–285. doi: 10.5604/17322693.941655. - DOI - PubMed
    1. Bailey CJ. Metformin: historical overview. Diabetologia. 2017;60:1566–1576. doi: 10.1007/s00125-017-4318-z. - DOI - PubMed
    1. Markowicz-Piasecka M, Huttunen KM, Mateusiak L, Mikiciuk-Olasik E, Sikora J. Is Metformin a Perfect Drug? Updates in Pharmacokinetics and Pharmacodynamics. Curr. Pharm. Des. 2017;23:2532–2550. doi: 10.2174/1381612822666161201152941. - DOI - PubMed
    1. Kooy, A., Zeeuw, D. D. E., Stehouwer, C. D. A. & Gansevoort, R. T. The effect of metformin on blood pressure, plasma cholesterol and triglycerides in type 2 diabetes mellitus: a systematic review. 1–14 (2004). - PubMed
    1. Markowicz-Piasecka M, et al. Metformin – a Future Therapy for Neurodegenerative Diseases: Theme: Drug Discovery, Development and Delivery in Alzheimer’s Disease Guest Editor: Davide Brambilla. Pharm. Res. 2017;34:2614–2627. doi: 10.1007/s11095-017-2199-y. - DOI - PMC - PubMed

Publication types

MeSH terms