. 2019 Apr 25;9(1):6528.
doi: 10.1038/s41598-019-42960-x.

Low-Dose Tacrolimus Prevents Dysregulated Peri-Conceptional Ovarian and Systemic Immune Cellular Homeostasis in Subjects with PCOS

Affiliations

Low-Dose Tacrolimus Prevents Dysregulated Peri-Conceptional Ovarian and Systemic Immune Cellular Homeostasis in Subjects with PCOS

Ahmad J H Albaghdadi et al. Sci Rep. .

Abstract

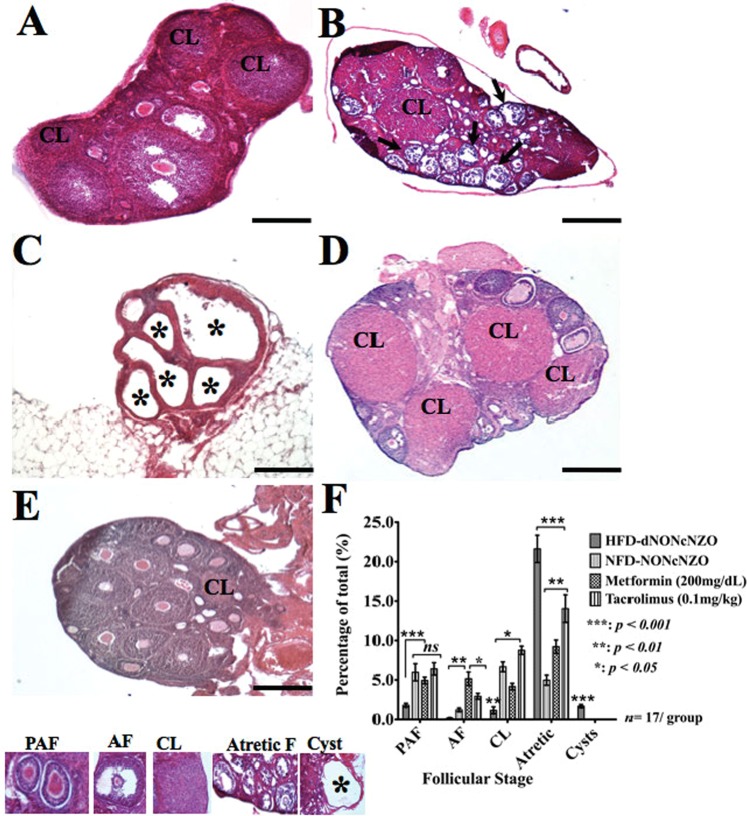
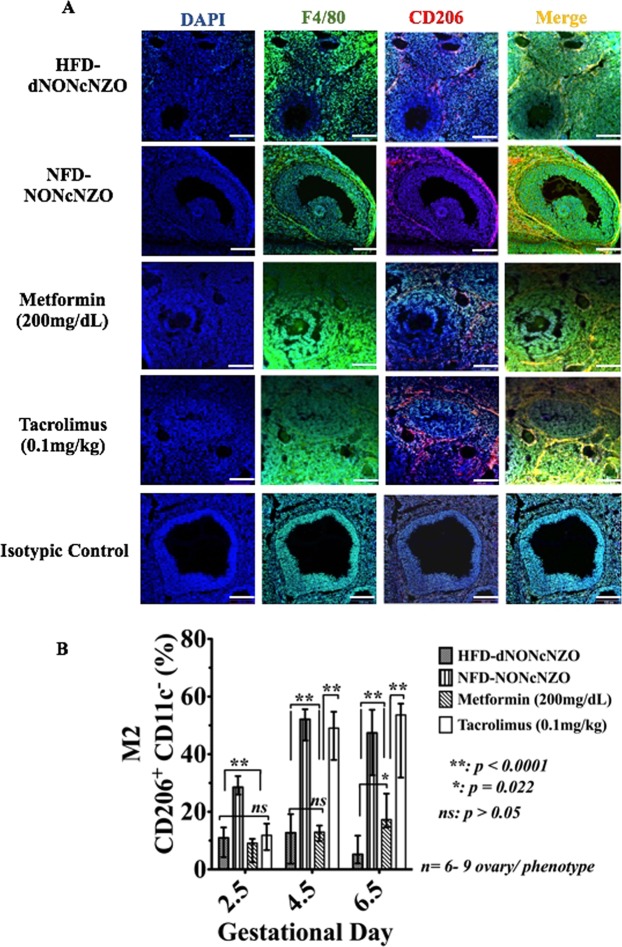
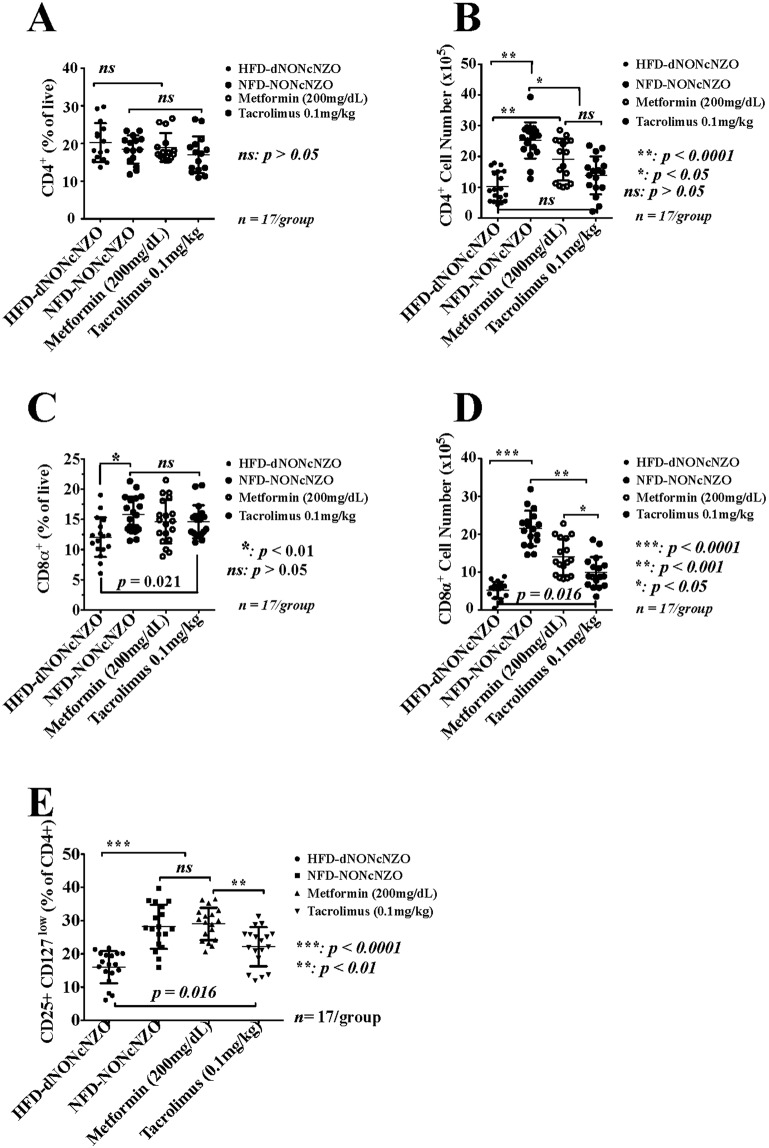
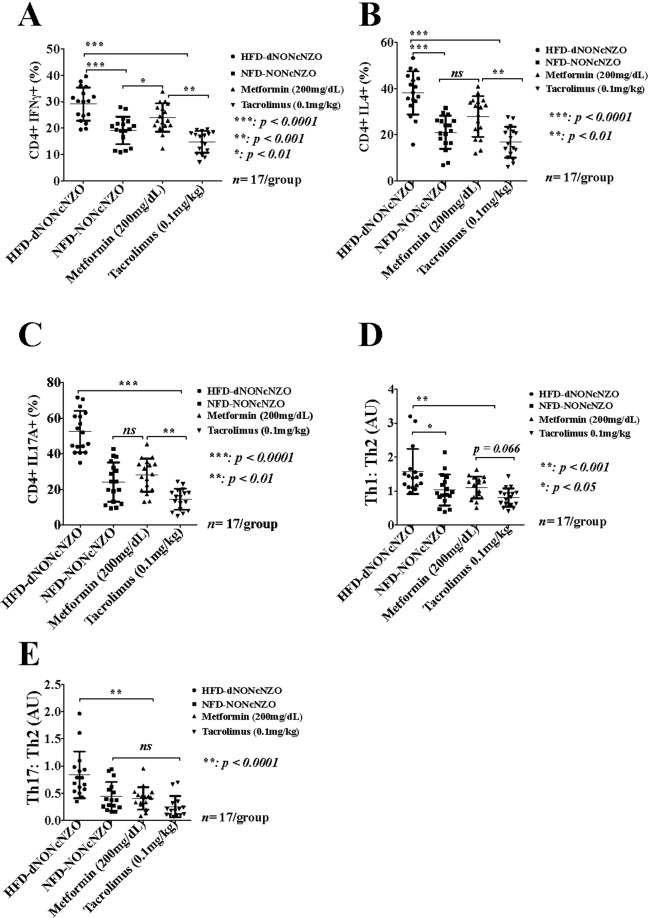
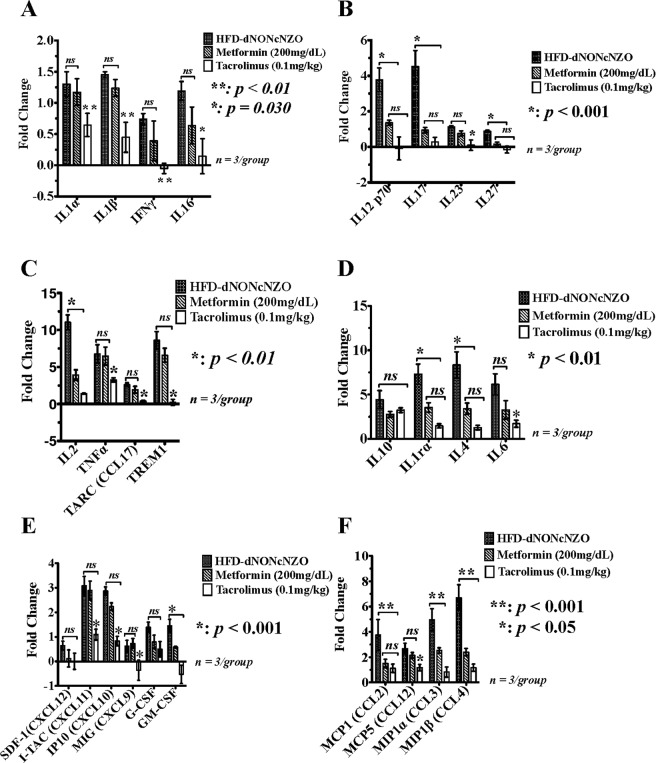
Polycystic ovary syndrome (PCOS) is characterized by failure of ovulation and is associated with obesity and chronic inflammation. Recent evidence suggests that anomalous activation of ovarian macrophages and numerical and functional deficits in the Th17 (CD4+IL17A+) and the CD4+CD25+CD127low Tregs plays crucial role in PCOS. We have shown that the pre-pregnancy use of tacrolimus prevents adverse reproductive outcomes in a mouse model of PCOS. Here we used the HFD-NONcNZO mice to test a hypothesized beneficial use of tacrolimus relative to metformin in favorably influencing the ovarian and systemic immune milieux conducive to gestational success in subjects with PCOS. Compared to normative controls, our data revealed an aberrant peri-conceptional suppression of the CD4+CD25+CD127low Tregs together with an overexpression of the Th17 T cells and lack of coordinated activation of ovarian macrophages in untreated HFD-dNONcNZO mice. Significant variances in treatment outcomes favoured the use of tacrolimus over metformin in treated mice. Consistent with the human fertility studies, this investigation reveals a beneficial systemic use of tacrolimus (0.1 mg/kg) in promoting early pregnancy in individuals with PCOS and suggests the need for further research into the selective inhibition of IL17A as a plausibly alternative immunotherapeutic approach in the clinical management of infertile individuals with PCOS.


Conflict of interest statement

The authors declare no competing interests.

Figures

Figure 1
Figure 1
Immunosuppression with tacrolimus supported functional ovarian phenotype in the HFD-dNONcNZO mice. Representative H&E stained ovarian sections from NFD-NONcNZO (A), HFD-dNONcNZO (B,C), tacrolimus- (D) and metformin- (E) treated mice. As opposed to normal ovarian morphology in the NFD-NONcNZO mice (A), follicular atresia (B: arrows) and large follicular cysts (C: *) characterized ovaries obtained from untreated diabetic HFD-dNONcNZO mice. Despite significant differences among treated mice (compare p values among treated mice at 95% confidence), treatment with tacrolimus (D) or metformin (E) inhibited ovarian cyst formation, suppressed follicular atresia and supported ovulatory phenotypes as judged by the development of antral follicles and persistence of post-ovulatory corpora lutea (CL) at gd4.5 in treated mice. (F) histogram comparing frequency of distribution of various ovarian structures presented in (AE). Although treatment with tacrolimus or metformin supported the growth of pre-antral follicles (PAF) in treated mice, the use of tacrolimus significantly inhibited premature luteolysis as judged by the significant presence of post-ovulatory corpora lutea in treated mice (mean difference between treatment groups = 2.51, p = 0.012, t = 3.361; 95% confidence interval = 0.391–4.619). An average of 45 serial sections (5 µm/section, 320 µm of tissue) was obtained per ovary. At least 4–5 animals with 12 ovarian sections per animal were used in each experiment. 8–12 ovarian structures including ovarian follicles, cysts and corpora lutea were analyzed per mouse per group. Scale bar = 200 μm in (AE). PAF: Pre-antral Follicle; AF: Antral Follicle, CL: Corpus Luteum, Atretic F: Atretic Follicle.
Figure 2
Figure 2
Mono-therapeutic interventions with tacrolimus suppressed aberrantly activated ovarian F4/80+ CD11c+ macrophages in treated mice. Detection of M1 activated F4/80+ CD11c+ macrophages in the tacrolimus- and metformin-treated mice and their untreated and control groups at postcoital/gd 4.5 by confocal microscope (A) and by flow-cytometry (B). Red fluorescence in the upper two horizontal panels in (A) indicates the presence of CD11c+ and the green fluorescence in the third horizontal panel is the surface staining for F4/80+ macrophages, respectively. The merged fluorescence images in the lower horizontal panel in (A) (orange) further identify the classically activated F4/80+ CD11c+ macrophages. As opposed to the NFD-NONcNZO and those receiving tacrolimus or metformin, infiltration of the vascular granulosa cells layer with CD11c+ macrophages was pathognomonic feature of uncoordinated follicular growth among untreated HFD-dNONcNZO mice. Figures in the second horizontal panel in A are high magnifications of the corresponding framed boxes shown in the first horizontal panel. Bars in A = 100 μm. The peri-conceptional differential expression profiles of the activated ovarian M1 (CD11c+ CD206+) macrophages during postcoital days 2.5, 4.5 and 6.5 in all experimental groups are represented in bar graphs in (B). Nuclei (blue fluorescence) were counterstained with DAPI.
Figure 3
Figure 3
The systemic use of tacrolimus (0.1 mg/kg) for four consecutive weeks influenced histological distribution and activation profile of ovarian F4/80+ CD206+ macrophages in treated mice. Shown is the detection of M2 activated F4/80+ CD206+ ovarian macrophages in histological sections (A) and by flow-cytometry (B) (CD206+ CD11c) in the tacrolimus- and metformin-treated mice and their untreated and control groups at postcoital/gd 4.5. Red fluorescence in (A) indicates the presence of CD206+ macrophages, and the green fluorescence is the surface staining for F4/80+ cells. The merged fluorescence images in (B) (yellow) further identify the alternatively activated F4/80+ CD206+ ovarian macrophages, respectively. Bar graphs in (B) represent the peri-conceptional differential expression profiles of the M2 (CD206+ CD11c) activated ovarian macrophages during postcoital days 2.5, 4.5 and 6.5 in all experimental groups. As opposed to the NFD-NONcNZO and those receiving tacrolimus, low-level infiltration of the vascular granulosa cells layer with F4/80+CD206+ macrophages was the hallmark of perturbed follicular growth among untreated HFD-dNONcNZO mice. Notably, therapeutic intervention with metformin (200 mg/dL) failed in promoting the peri-conceptional expansion of the CD206+CD11c− macrophages in treated mice (compare merged fluorescence in (A) and bar-graphs in (B) in the metformin-treated mice to those receiving tacrolimus in (A,B), respectively). Bars in A = 100 μm. Nuclei (blue fluorescence) were counterstained with DAPI.
Figure 4
Figure 4
Immunosuppression with tacrolimus inhibited an adversary pro-inflammatory ovarian milieu in the HFD-dNONcNZO mice. Using a membrane-based antibody array for the parallel determination of the relative levels of selected mouse ovarian cytokines and chemokines, bar graphs in AF are representations of mean ± SDM of three replicates measuring the expression of ovarian cytokines and chemokine receptors and their ligands at postcoital/gd 4.5 among mated untreated and treated HFD-dNONcNZO mice. A 1.5-fold change in the protein expression of the cytokine relative to that of the NFD-NONcNZO mice was considered significant (p < 0.01 at 95% confidence, n = 3/phenotype). Of the most upregulated peri-conceptional ovarian cytokines and chemokines in the HFD-dNONcNZO mice which were significantly inhibited using tacrolimus were the pro-inflammatory mediators IL1β and IFNγ (A), IL12p70, IL17, IL23 and IL27 (B), IL2, TNFα and its downstream targets TREM1 (Triggering Receptor Expressed On Myeloid Cells 1) and TARC (CCL17: Thymus and Activation Regulated Cytokine) (C), IL6 (D), GM-CSF and the CXC ligands 9, 10 and 11 (E) and the monocytes-macrophage regulatory chemokine MIP-1α (CCL3) (F). Except for suppressing IL6 (p < 0.01) and a significant trend in downregulating IL4 by use of tacrolimus (mean difference between treated and untreated = 0.91, p = 0.031, t = 2.798; 95% confidence interval = 0.027–1.786), there has been no significant downregulation of the anti-inflammatory cytokines IL10 and IL1r α (p > 0.05) (D). Constitutively, no significant pan-cytokine suppression was observed in the metformin-treated mice apart from a significant downregulation of IFNγ (A), IL12/IL17 family members (B), IL2 (C) and IL6 (D). Due to the gestational age examined and the low dose of tacrolimus (0.1 mg/kg), the monocytes and macrophage chemoattractant and regulatory chemokine ligands MCP1 (CCL2), MCP5 (CCL12) and MIP-1β (CCL4) (F) were the least affected chemokines in the tacrolimus- and the metformin-treated mice.
Figure 5
Figure 5
The peri-conceptional status of circulating CD4+, CD8α+ and CD25+CD127low lymphocytes in treated HFD-NONcNZO dams. Flow-cytometric analysis of proportions and numbers of peripheral CD4+ T cells (A,B) and CD8α+ T cells (C,D) as well as CD25+CD127low T cells (E) revealed reduced total leukocytes and impaired peri-conceptional expansion of peripheral CD4+ CD25+ CD127law and CD8α+ T cells in untreated HFD-dNONcNZO mice. A mean difference in the value of (-14961) (p < 0.0001, t = 7.569; 95% confidence interval = −20631–−9.290) in the numbers of circulating CD4+ cells between the untreated HFD-dNONcNZO (mean ± SDM = 1029 ± 481 vs control NFD-NONcNZO mice: 25252 ± 5862) and those receiving metformin (19045 ± 6760) (mean difference = −8754, p < 0.001, t = 4.365; 95% confidence interval = 14507–−3000) was calculated. Although no significant difference in the proportions and numbers of circulating CD4+ T cells was observed between the tacrolimus-treated vs untreated HFD-dNONcNZO mice (mean difference = −3611, p = 0.363, t = 1.8008; 95% confidence interval = −9365– 2142), a significant increase in the proportions and numbers of CD8α+ (C: p < 0.01 and D: p < 0.05) and CD25+ CD127low T cells (E: p = 0.016) was detected among treated mice. Proportions of CD25+ CD127low cells were quantified after gating on a CD4+ channel which allowed for the clear separation of the CD4+ CD25+CD127low Tregs niche (Supplemental Fig. S2D). Antibody specificity was confirmed using isotypic controls and histograms representing mean fluorescence intensities (MFI) of CD4+, CD8α+ and CD25+CD127low T cells were generated (Supplemental Fig. S2C,D).
Figure 6
Figure 6
Effect of HFD and immunosuppression with tacrolimus on the peri-conceptional phenotypic frequencies and proportions of circulating maternal CD4+IFNγ+, CD4+IL4+ and CD4+IL17A+ Tregs and alterations to the Th1:Th2 and Th17:Th2 cell ratios in the HFD-dNONcNZO mice. (AC) Graphic representations of mean ± SDM of percentages (%) of CD4+ T cells gated for their fluorescence activated intracellular staining for IFNγ (A), IL4 (B) and IL17A (C) in lymphocytes of HFD-dNONcNZO mice (n = 17), their normative control NFD-NONcNZO (n = 17) and those receiving metformin (n = 17) or tacrolimus (n = 17). (D,E) depict, respectively, ratios of circulating Th1 (CD4+IFNγ+): Th2 (CD4+IL4+) (D) and Th17 (CD4+IL17A+): Th2 (CD4+IL4+) (E) cells at gd 4.5 among experimental groups. Compared to control values, the Th1:Th2 cell ratio (D) was significantly elevated in the untreated HFD-dNONcNZO mice (mean difference = 0.698, p < 0.05, t = 7.721; 95% confidence interval = 0.438–0.959) vs the tacrolimus- (mean difference = 0.752, p < 0.001, t = 8.304; 95% confidence interval = 0.491–1.012) or the metformin-treated HFD-dNONcNZO mice (mean difference = 0.728, p < 0.001, t = 8.054; 95% confidence interval = 0.468–0.989). Constitutively, the use of both treatment modalities significantly inhibited an aberrant peri-conceptional Th17:Th2 cell ratio (E) in the HFD-dNONcNZO mice (mean difference = 1.147, p < 0.0001, t = 5.855; 95% confidence interval = 0.584–1.712 compared to the tacrolimus-treated mice vs a mean difference of 1.044, p = 0.0001, t = 5.324; 95% confidence interval = 0.479–1.607 in the metformin-treated mice).
Figure 7
Figure 7
Effect of HFD and tacrolimus on circulating levels of pro-inflammatory and anti-inflammatory cytokines at gd 4.5 in the HFD-dNONcNZO mice. As opposed to the metformin-treated mice, the systemic use of tacrolimus monotherapy resulted in a wide-range suppression of cytokines and chemokines in the blood of treated HFD-dNONcNZO mice. Depicted in (AF) are bar graph representations of mean ± SDM of the fold changes in cytokines suppression by use of tacrolimus or metformin. Effect of treatment was analyzed by one-way ANOVA followed by Scheffe’s ad-hoc test. A 1.5-fold change in the protein expression of the cytokine relative to that of the NFD-NONcNZO mice was considered significant (p < 0.01 at 95% confidence, n = 3/phenotype). Of the most significantly inhibited serum cytokines by the use of tacrolimus (0.1 mg/kg) were IL1α, IL1β and IFNγ (A), IL12p70, IL17, IL23 and IL27 (B), IL2, TNFα and its downstream chemokine ligands TARC and TREM1 (C), IL6, IL4 and IL1rα (D), GM-CSF and the CXC ligands 9,10 and 11 (E), as well as the monocyte-macrophage regulatory chemokines MIP-1α (CCL3), MIP-1ß (CCL4) and MCP5 (CCL12) (F), respectively.

References

    1. Wu R, der Hoek V, Ryan KH, Norman NK, Robker RJ. R. L. Macrophage contributions to ovarian function. Hum Reprod Update. 2004;10:119–133. doi: 10.1093/humupd/dmh011. - DOI - PubMed
    1. Franks S, Stark J, Hardy K. Follicle dynamics and anovulation in polycystic ovary syndrome. Human Reproduction Update. 2008;14:367–378. doi: 10.1093/humupd/dmn015. - DOI - PubMed
    1. Azziz R, et al. The prevalence and features of the polycystic ovary syndrome in an unselected population. The Journal of clinical endocrinology and metabolism. 2004;89:2745–2749. doi: 10.1210/jc.2003-032046. - DOI - PubMed
    1. Rotterdam EA-SP. c. w. g. Revised 2003 consensus on diagnostic criteria and long-term health risks related to polycystic ovary syndrome (PCOS) Hum Reprod. 2004;19:41–47. doi: 10.1093/humrep/deh098. - DOI - PubMed
    1. Bani Mohammad M, Majdi Seghinsara A. Polycystic Ovary Syndrome (PCOS), Diagnostic Criteria, and AMH. Asian Pac J Cancer Prev. 2017;18:17–21. doi: 10.22034/APJCP.2017.18.1.17. - DOI - PMC - PubMed

MeSH terms