. 2019 Apr 25;9(1):6555.
doi: 10.1038/s41598-019-43076-y.

Synapse loss and progress of Alzheimer's disease -A network model

Affiliations

Synapse loss and progress of Alzheimer's disease -A network model

G Kashyap et al. Sci Rep. .

Abstract

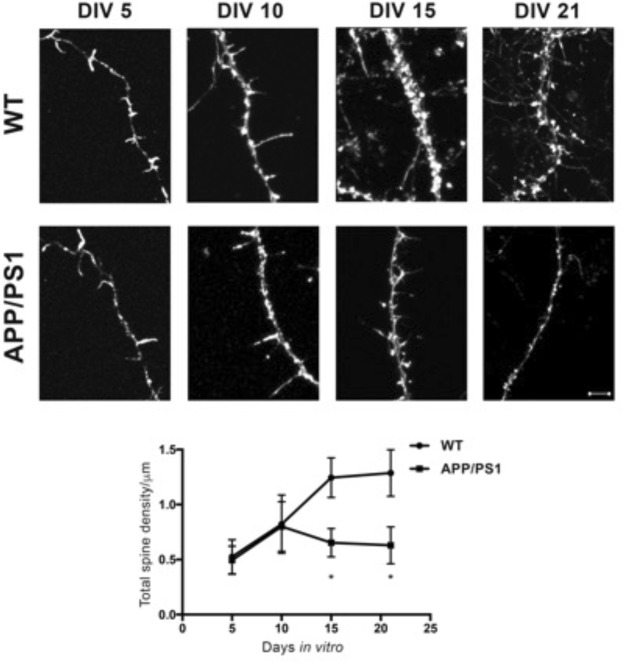
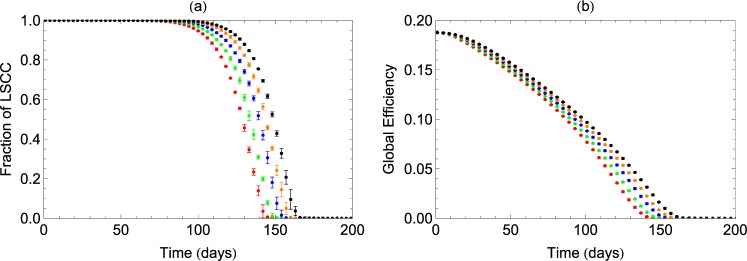
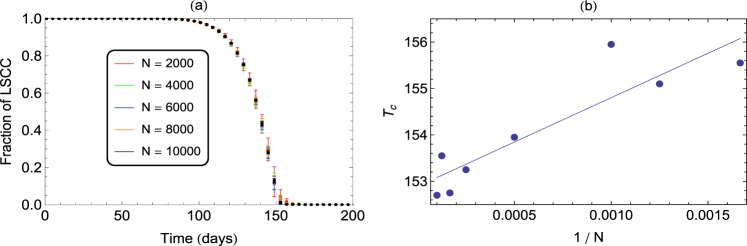
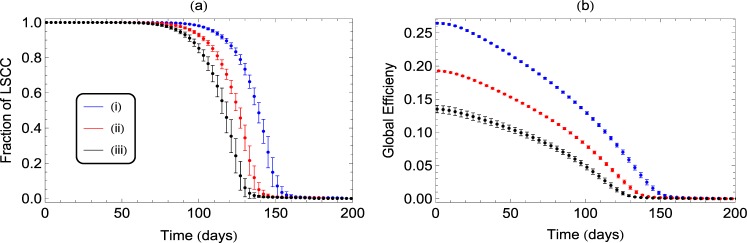
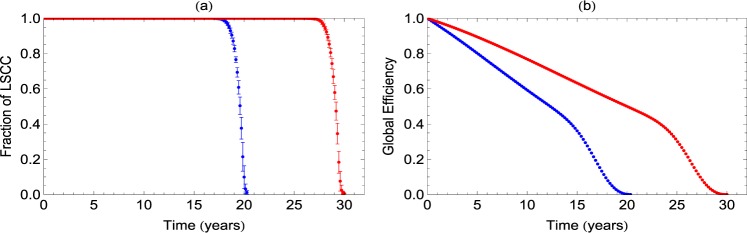
We present observational evidence from studies on primary cortical cultures from AD transgenic mice, APPSwe/PS1ΔE9 (APP/PS1) mice, for significant decrease in total spine density at DIV-15 and onward. This indicates reduction in potential healthy synapses and strength of connections among neurons. Based on this, a network model of neurons is developed, that explains the consequent loss of coordinated activity and transmission efficiency among neurons that manifests over time. The critical time when structural connectivity in the brain undergoes a phase-transition, from initial robustness to irreparable breakdown, is estimated from this model. We also show how the global efficiency of signal transmission in the network decreases over time. Moreover, the number of multiple paths of high efficiency decreases rapidly as the disease progresses, indicating loss of structural plasticity and inefficiency in choosing alternate paths or desired paths for any pattern of activity. Thus loss of spines caused by β-Amyloid (Aβ) peptide results in disintegration of the neuronal network over time with consequent cognitive dysfunctions in Alzheimer's Disease (AD).


Conflict of interest statement

The authors declare no competing interests.

Figures

Figure 1
Figure 1
Representative confocal images of dendritic spines of neurons from WT and APP/PS1 mice at DIV (days in-vitro)-5, DIV-10, DIV-15 and DIV-21. Scale bar is 5 μm. Top - Quantification for total spine density at DIV-5, 10, 15 and 21. Bottom - Total spine density of wild-type (WT) and APP/PS1 groups is similar at DIV-5 and 10. Significant spine loss is observed at DIV-15 and is sustained till DIV-21. Data is represented as Mean + SEM (n = 30 neurites per group) and statistical significance: *p < 0.0001 for WT versus APP/PS1 (Two-way RM ANOVA followed by Bonferroni post-hoc test).
Figure 2
Figure 2
Decrease in the fractional size of LSCC (a) and Global Efficiency (b) with the loss of synapses or strength of connections in the network. Decay of links is studied for values of τ = 20, 25, 30, 35, 40 (left to right). We observe that changes in τ, that can take care of variations in individual patient responses or various animal models, give qualitative similar behaviour of LSCC. However, higher values of τ indicating slower decay, result in higher value of critical time Tc.
Figure 3
Figure 3
(a) Decrease in fractional size of LSCC as a function of loss of spines is studied for different values of network size N. We observe that the critical time at which the networks breakdown appears to converge to a critical time Tc as N increases. (a) Scaling in the behaviour of LSCC with N near the transition obtained by plotting Tc values against (1/N). The intercept on the y-axis gives the value of Tc in the large size limit as ≈150 days and the slope gives the value of scaling index β as 1.0. The results shown for networks of size N = 104 and link density of 10 are averaged over 100 realizations.
Figure 4
Figure 4
(a) Number of paths of maximum-efficiency (or minimum-weight) at the initial stages of connections in the network. In the initial stage, the network has ≈107 directed paths with efficiency in the range 0.2–0.3. (b) Final stages of decay after 120 days. With the progressive loss of links, the total number of paths as well as the average efficiency of individual paths decreases.
Figure 5
Figure 5
Decrease in fractional size of LSCC (a) and Global Efficiency (b) for various types of initial distributions of synaptic coupling strengths. (i) identical coupling strengths (ii) normal distribution and (iii) log-normal distribution.
Figure 6
Figure 6
Decrease in the fractional size of the LSCC (a) and Global Efficiency (b) with synapse losses in the constructed human brain network. Decay of links is studied for values of τ = 40 (blue) and τ = 80 (Red). The values of GE are normalized by the initial value to emphasize the relative decrease due to synaptic decay.

References

    1. Ferri CP, et al. Global prevalence of dementia: a delphi consensus study. The lancet. 2005;366:2112–2117. doi: 10.1016/S0140-6736(05)67889-0. - DOI - PMC - PubMed
    1. Wimo A, Winblad B, Aguero-Torres H, von Strauss E. The magnitude of dementia occurrence in the world. Alzheimer Dis. & Assoc. Disord. 2003;17:63–67. doi: 10.1097/00002093-200304000-00002. - DOI - PubMed
    1. Qiu C, Kivipelto M, von Strauss E. Epidemiology of alzheimer’s disease: occurrence, determinants, and strategies toward intervention. Dialogues clinical neuroscience. 2009;11:111. - PMC - PubMed
    1. Rocca WA, et al. Trends in the incidence and prevalence of alzheimer’s disease, dementia, and cognitive impairment in the united states. Alzheimer’s & Dementia. 2011;7:80–93. doi: 10.1016/j.jalz.2010.11.002. - DOI - PMC - PubMed
    1. Chapman PF, et al. Impaired synaptic plasticity and learning in aged amyloid precursor protein transgenic mice. Nat. neuroscience. 1999;2:271. doi: 10.1038/6374. - DOI - PubMed

Publication types

Substances