. 2017 Oct;1(10):743-747.
doi: 10.1038/s41562-017-0208-0. Epub 2017 Sep 25.

Meaning-based guidance of attention in scenes as revealed by meaning maps

Affiliations

Meaning-based guidance of attention in scenes as revealed by meaning maps

John M Henderson et al. Nat Hum Behav. 2017 Oct.

Abstract

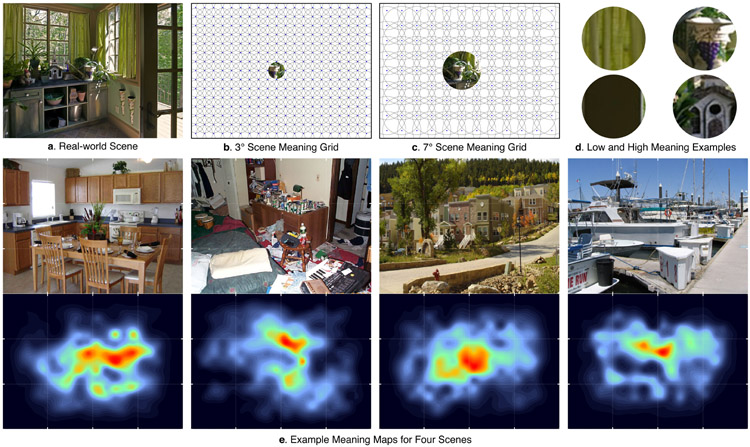
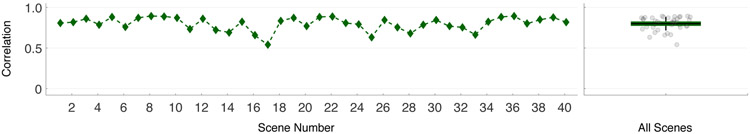
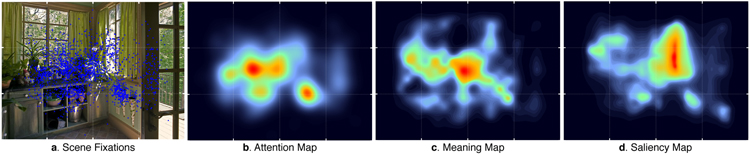
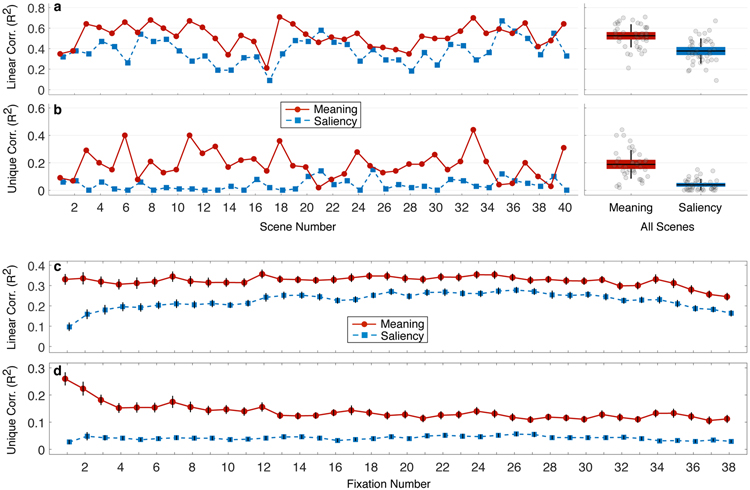
Real-world scenes comprise a blooming, buzzing confusion of information. To manage this complexity, visual attention is guided to important scene regions in real time 1-7 . What factors guide attention within scenes? A leading theoretical position suggests that visual salience based on semantically uninterpreted image features plays the critical causal role in attentional guidance, with knowledge and meaning playing a secondary or modulatory role 8-11 . Here we propose instead that meaning plays the dominant role in guiding human attention through scenes. To test this proposal, we developed 'meaning maps' that represent the semantic richness of scene regions in a format that can be directly compared to image salience. We then contrasted the degree to which the spatial distributions of meaning and salience predict viewers' overt attention within scenes. The results showed that both meaning and salience predicted the distribution of attention, but that when the relationship between meaning and salience was controlled, only meaning accounted for unique variance in attention. This pattern of results was apparent from the very earliest time-point in scene viewing. We conclude that meaning is the driving force guiding attention through real-world scenes.


Conflict of interest statement

Competing Interests

The authors declare no competing interests.

Figures

Figure 1.
Figure 1.. Generation of meaning maps.
Meaning maps were generated from subject ratings (N = 165) of context-free scene patches at two spatial scales. Each (a) real-world scene was decomposed into a series of overlapping circular patches at (b) 3° and (c) 7° spatial scales. Blue dots in (b) and (c) denote the center of each circular patch that was rated, with example patches of the content captured by the 3° and 7° scales shown in the center. Also shown are (d) examples of high and low meaning patches. Ratings were combined to produce (e) meaning maps as shown for four example scenes.
Figure 2.
Figure 2.. Correlation between saliency and meaning maps.
The line plot shows the correlation between the meaning and saliency maps for each scene. The scatter box plot on the right shows the corresponding grand correlation mean across N = 40 scenes (black horizontal line), 95% confidence intervals (colored box), and 1 standard deviation (black vertical line). The mean correlation differed significantly from zero, p < .0001.
Figure 3.
Figure 3.. Attention, meaning, and saliency maps for an example scene.
We obtained (a) eye movements from subjects (N = 65) who viewed each scene, and we generated (b) attention maps from those eye movement data. We compared the attention maps to the corresponding (c) meaning maps, and (d) saliency maps, from each scene.
Figure 4.
Figure 4.. Squared linear correlation and semi-partial correlation by scene and by fixation order.
Shown for each scene are the (a) linear correlation, and (b) semi-partial correlation, between fixation density and meaning (red) and fixation density and salience (blue). The scatter box plots on the right show the corresponding grand correlation means across N = 40 scenes (black horizontal line), 95% confidence intervals (colored box), and 1 standard deviation (black vertical line). Both linear and semi-partial correlations for meaning and salience differed significantly, p < .0001. Plots also show the (c) squared linear correlation and (d) corresponding semi-partial correlation, between fixation density and meaning (red) and fixation density and salience (blue), as a function of fixation order across all 40 scenes. Error bars represent standard error of the mean. Correlations differed significantly at all fixations, FDR p < .05.

References

    1. Land MF & Hayhoe MM In what ways do eye movements contribute to everyday activities? Vision Res. 41, 3559–3565 (2001). - PubMed
    1. Hayhoe MM & Ballard D Eye movements in natural behavior. Trends Cogn. Sci 9, 188–194 (2005). - PubMed
    1. Henderson JM Human gaze control during real-world scene perception. Trends Cogn. Sci 7, 498–504 (2003). - PubMed
    1. Henderson JM Gaze Control as Prediction. Trends Cogn. Sci 21, 15–23 (2017). - PubMed
    1. Buswell GT How People Look at Pictures. (University of Chicago Press Chicago, 1935). at <papers2://publication/uuid/EA9683B1–9AB3–46F7-B4C3–1EBE6E3D645D>