. 2019 Apr 9:10:321.
doi: 10.3389/fneur.2019.00321. eCollection 2019.

Vestibulo-Ocular Responses and Dynamic Visual Acuity During Horizontal Rotation and Translation

Affiliations

Vestibulo-Ocular Responses and Dynamic Visual Acuity During Horizontal Rotation and Translation

Cecilia Ramaioli et al. Front Neurol. .

Abstract

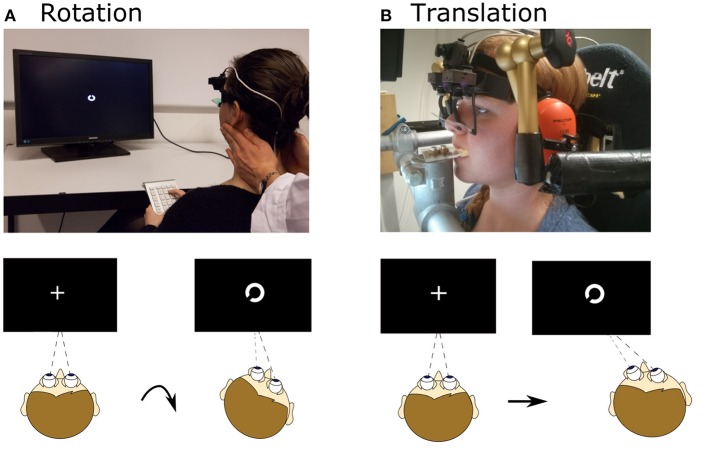
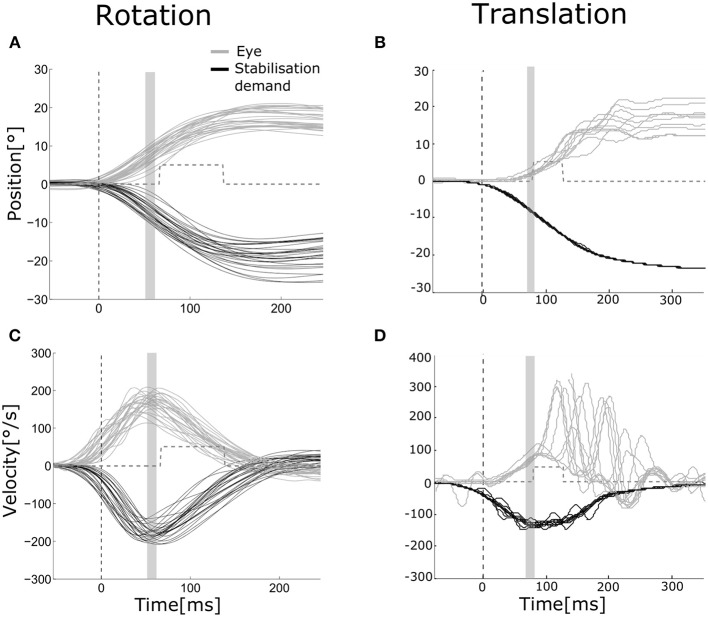
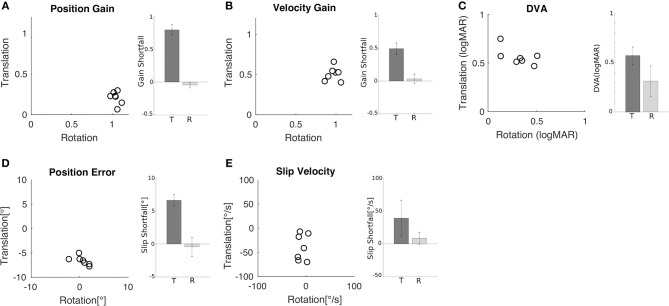
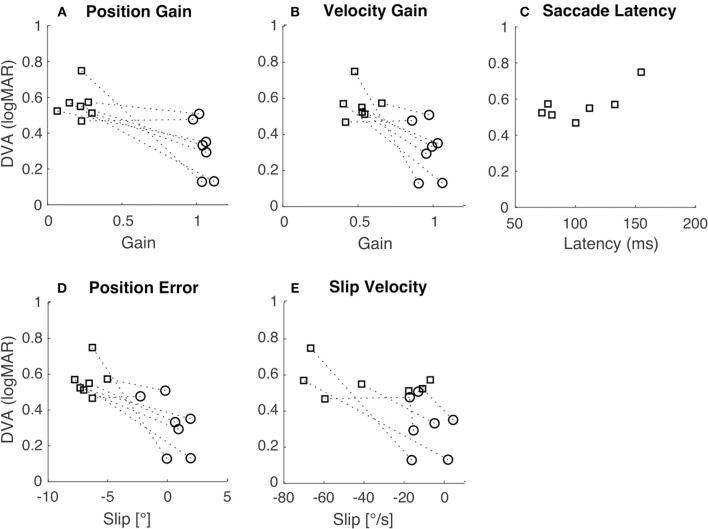
Dynamic visual acuity (DVA) provides an overall functional measure of visual stabilization performance that depends on the vestibulo-ocular reflex (VOR), but also on other processes, including catch-up saccades and likely visual motion processing. Capturing the efficiency of gaze stabilization against head movement as a whole, it is potentially valuable in the clinical context where assessment of overall patient performance provides an important indication of factors impacting patient participation and quality of life. DVA during head rotation (rDVA) has been assessed previously, but to our knowledge, DVA during horizontal translation (tDVA) has not been measured. tDVA can provide a valuable measure of how otolith, rather than canal, function impacts visual acuity. In addition, comparison of DVA during rotation and translation can shed light on whether common factors are limiting DVA performance in both cases. We therefore measured and compared DVA during both passive head rotations (head impulse test) and translations in the same set of healthy subjects (n = 7). In addition to DVA, we computed average VOR gain and retinal slip within and across subjects. We observed that during translation, VOR gain was reduced (VOR during rotation, mean ± SD: position gain = 1.05 ± 0.04, velocity gain = 0.97 ± 0.07; VOR during translation, mean ± SD: position gain = 0.21 ± 0.08, velocity gain = 0.51 ± 0.16), retinal slip was increased, and tDVA was worse than during rotation (average rDVA = 0.32 ± 0.15 logMAR; average tDVA = 0.56 ± 0.09 logMAR, p = 0.02). This suggests that reduced VOR gain leads to worse tDVA, as expected. We conclude with speculation about non-oculomotor factors that could vary across individuals and affect performance similarly during both rotation and translation.

Keywords: dynamic visual acuity (DVA); eye movements; oculomotor; otoliths; retinal slip; semicircular canal; vestibular ocular reflex; vestibular system.


Figures

Figure 1
Figure 1
Setup for rotational and translational VOR and DVA assessment. (A) Head rotation was induced by a trained experimenter manually rotating the head, as during a clinical head-impulse test. Subjects fixated a fixation point, which changed to a Landolt ring ~72 ms after movement onset and displayed for ~68 ms. After the movement subjects judged the orientation of the ring. (B) Translational movements were applied using a six-degree-of-freedom motion platform. The head was fixated with respect to the platform via bite bar and stabilizing braces over the ears. As for rotation, a Landolt ring appeared ~75 ms after movement onset and was displayed for ~49 ms; subjects judged its orientation. Written informed consent was obtained from the individual for the publication of the image represented in the figure.
Figure 2
Figure 2
Eye and head movements during rotation and translation Eye movement (gray) plotted vs. stabilization demand (black) for a representative subject during rotation [(A,C) head and eye movements to the left and to the right pooled, left eye] and translation [(B,D) movements to the right, right eye]. Position (A,B) and velocity (C,D) traces are aligned to stimulus presentation beginning. The dashed vertical line indicates the mean head movement start. The gray area indicates the time interval over which position and velocity gains of the VOR were computed (55–65 ms after movement onset). The gray dashed line shows the mean time interval when the visual stimulus was turned on to assess dynamic visual acuity.
Figure 3
Figure 3
Comparison of rotational and translational VOR gain, slip, and DVA. (A) Position error for translation vs. rotation for all subjects. Inset shows the mean (±SD) shortfall in gain relative to gain of one across subjects for translation (0.79 ± 0.08) and rotation (−0.05 ± 0.04). (B) Velocity gain for translation vs. rotation for all subjects. Inset shows the mean (±SD) shortfall across subjects for translation (0.49 ± 0.09) and rotation (0.07 ± 0.03). (C) DVA for translation vs. rotation for all subjects; larger values indicate worse acuity. Inset shows the mean (±SD) across subjects for translation (0.56 ± 0.09 logMAR) and rotation (0.32 ± 0.15 logMAR). (D) Retinal error during translation and rotation for all subjects. Negative values indicate under compensation. Inset shows the mean (±SD) shortfall relative to zero error across subjects for translation (6.61° ± 0.89°) and rotation (−0.44° ± 1.46°). (E) Retinal slip velocity during translation and rotation for all subjects. Inset shows the mean (±SD) shortfall across subjects for translation (39 ± 27.2°/s) and rotation (8.57 ± 9.05°/s).
Figure 4
Figure 4
Relation of DVA to gain, slip, and saccade latency. In all panels, squares indicate translation, circles indicate rotation, and the dashed lines connect the two data points from each subject. (A) DVA plotted vs. position gain (R = −0.75, p < 0.01). (B) DVA plotted vs. velocity gain (R = −0.73, p < 0.01). (C) DVA plotted vs. saccade latency during translation only (R = 0.72, p = 0.07). (D) DVA plotted vs. position error (R = −0.77, p < 0.01). (E) DVA plotted vs. slip velocity (R = −0.59, p = 0.03).

References

    1. Halmagyi GM, Curthoys IS. A clinical sign of canal paresis. Arch Neurol. (1988) 45:737–739. 10.1001/archneur.1988.00520310043015 - DOI - PubMed
    1. Bartl K, Lehnen N, Kohlbecher S, Schneider E. Head impulse testing using video-oculography. Ann N Y Acad Sci. (2009) 331–3. 10.1111/j.1749-6632.2009.03850.x - DOI - PubMed
    1. MacDougall HG, Weber KP, McGarvie LA, Halmagyi GM, Curthoys IS. The video head impulse test: diagnostic accuracy in peripheral vestibulopathy. Neurology. (2009) 73:1134–1141. 10.1212/WNL.0b013e3181bacf85 - DOI - PMC - PubMed
    1. Macdougall HG, McGarvie LA, Halmagyi GM, Curthoys IS, Weber KP. Application of the video head impulse test to detect vertical semicircular canal dysfunction. Otol Neurotol. (2013) 34:974–9. 10.1097/MAO.0b013e31828d676d - DOI - PubMed
    1. Halmagyi GM, Chen L, MacDougall HG, Weber KP, McGarvie LA, Curthoys IS. The video head impulse test. Front Neurol. (2017) 8:258 10.3389/fneur.2017.00258 - DOI - PMC - PubMed

LinkOut - more resources