. 2019 Apr 5:10:598.
doi: 10.3389/fimmu.2019.00598. eCollection 2019.

Spatiotemporal Modeling of the Key Migratory Events During the Initiation of Adaptive Immunity

Affiliations

Spatiotemporal Modeling of the Key Migratory Events During the Initiation of Adaptive Immunity

Alan J Hayes et al. Front Immunol. .

Abstract

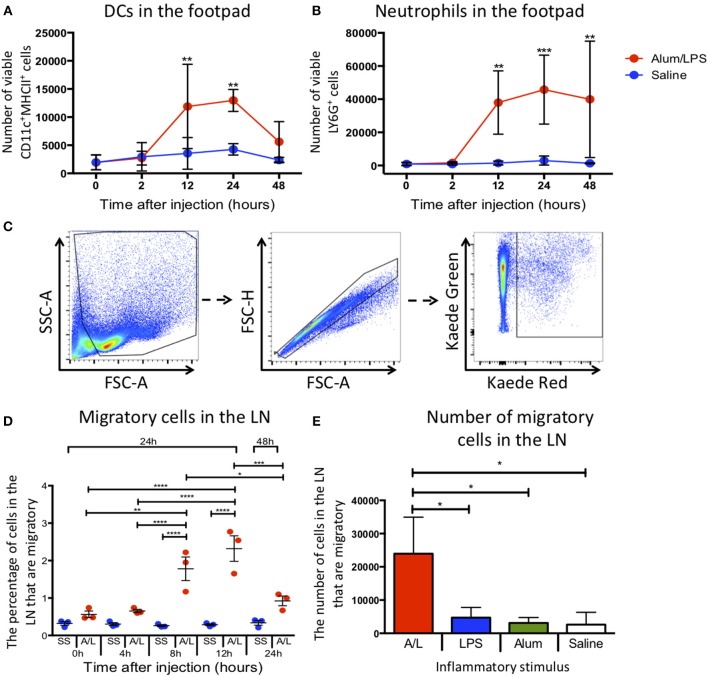
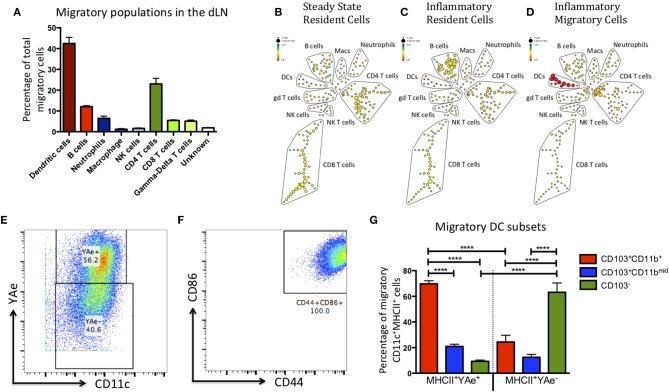
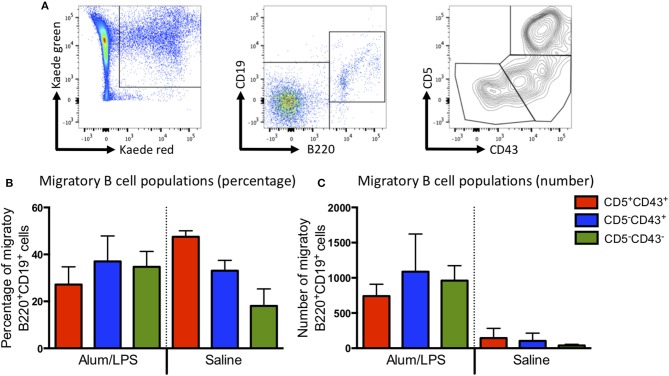
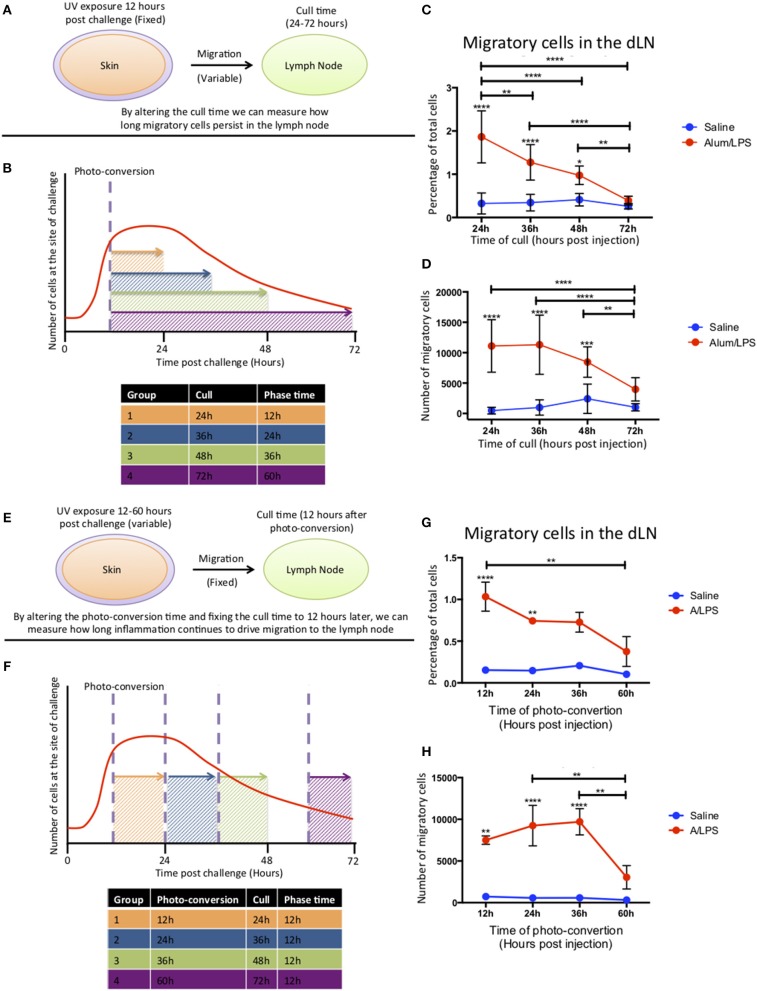
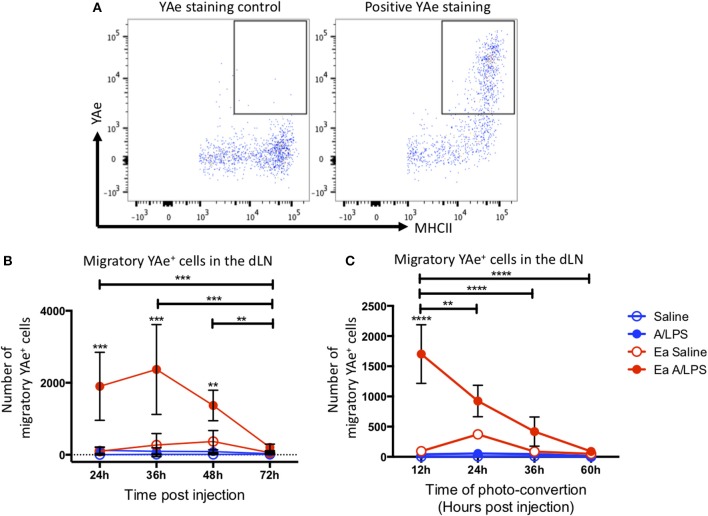
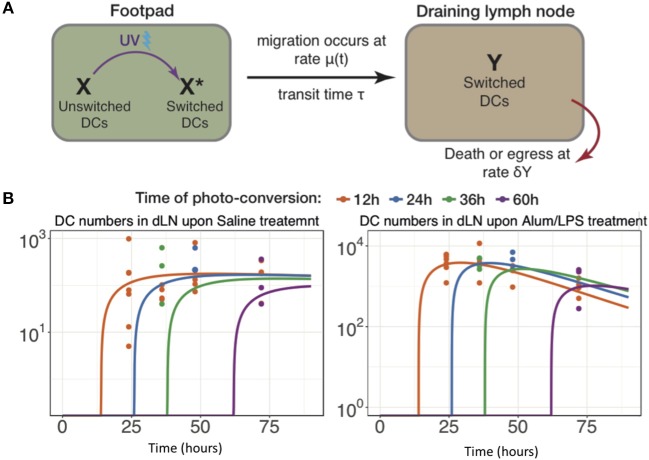
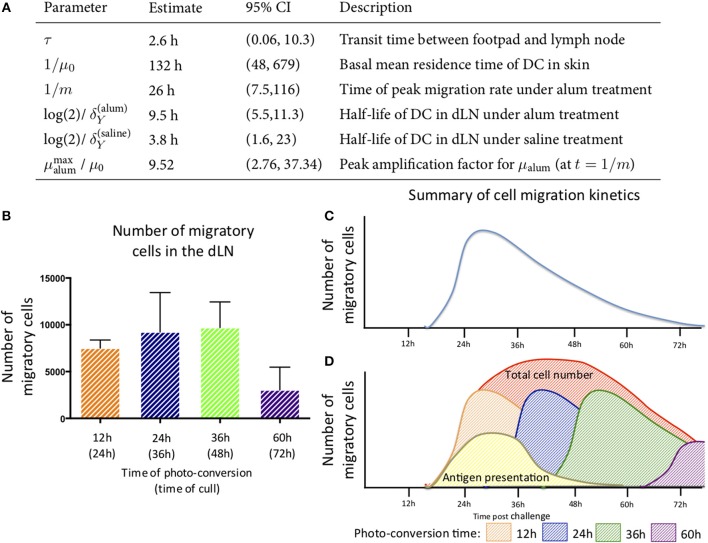
Initiation of adaptive immunity involves distinct migratory cell populations coming together in a highly dynamic and spatially organized process. However, we lack a detailed spatiotemporal map of these events due to our inability to track the fate of cells between anatomically distinct locations or functionally identify cell populations as migratory. We used photo-convertible transgenic mice (Kaede) to spatiotemporally track the fate and composition of the cell populations that leave the site of priming and enter the draining lymph node to initiate immunity. We show that following skin priming, the lymph node migratory population is principally composed of cells recruited to the site of priming, with a minor contribution from tissue resident cells. In combination with the YAe/Eα system, we also show that the majority of cells presenting antigen are CD103+CD11b+ dendritic cells that were recruited to the site of priming during the inflammatory response. This population has previously only been described in relation to mucosal tissues. Comprehensive phenotypic profiling of the cells migrating from the skin to the draining lymph node by mass cytometry revealed that in addition to dendritic cells, the migratory population also included CD4+ and CD8+ T cells, B cells, and neutrophils. Taking our complex spatiotemporal data set, we then generated a model of cell migration that quantifies and describes the dynamics of arrival, departure, and residence times of cells at the site of priming and in the draining lymph node throughout the time-course of the initiation of adaptive immunity. In addition, we have identified the mean migration time of migratory dendritic cells as they travel from the site of priming to the draining lymph node. These findings represent an unprecedented, detailed and quantitative map of cell dynamics and phenotypes during immunization, identifying where, when and which cells to target for immunomodulation in autoimmunity and vaccination strategies.

Keywords: adaptive immunity; cell migration; cell tracking; dendritic cells; innate immunity.


Figures

Figure 1
Figure 1
Inflammation at the site of injection drives migration to the draining lymph node. C57BL/6 mice were injected with alum/LPS in the left hind footpad and saline in the right hind footpad and subsequently culled 0, 2, 12, 24, or 48 h later and the skin from the footpads analyzed by flow cytometry. (A) The total number of live CD11c+MHCII+ cells isolated from the footpad and (B) the total number of live Ly6G+MHCII cells isolated from the footpad are shown. n = 4 ± 1 SD (**p < 0.01, ***p < 0.001). Kaede mice were injected with alum/LPS in the left hind footpad or saline in the right and the footpad was photo-converted at 0, 4, 8 or 12 h post injections. Mice were then culled 24 or 48 h after injection and the popliteal lymph node removed and analyzed by flow cytometry. (C) Migratory cells were identified by gating out debris using FSC and SSC, doublet exclusion using FSC-A and FSC-H followed by identifying migratory cells based on Kaede red expression. As we exposed the footpad to violet light only, any cells expressing Kaede red in the lymph node must have migrated there from the footpad. (D) The percentage of migratory cells entering the draining lymph node directly from the footpad is shown. n = 3 ±1 SD (*p < 0.05, **p < 0.01, ***p < 0.001, ****p < 0.0001). (E) the number of inflammatory cells identified in the draining lymph node of Kaede mice after challenge with alum alone, LPS alone or alum/LPS over a 24 h period is shown. n = 3 ± 1 SD (*p < 0.05).
Figure 2
Figure 2
The migratory population contains diverse cell types, but the antigen presenting cells within this population are predominantly CD103+ CD11b+ dendritic cells. Kaede mice were injected with Alum/LPS/Eα-OVA in the hind footpad, 12 h later the tissue was photo-converted and the animals were culled after a further 12 h. (A) Analysis of the sorted, migratory population is shown with cells expressing MHCII represented in red, innate cells in blue and T cells in green. (B–D) The spade diagrams show the levels of antigen presentation (YAe) detected on the lymph node resident population in untreated mice, mice treated with alum/LPS in the foot pad and the migratory population of mice treated with alum/LPS in the footpad. Red and yellow nodes represent high and low expression of Eα:MHCII complexes, respectively. (E) Dendritic cells were identified based on expression of CD11c and MHC class II. Representative dot plots identifying antigen presenting DCs and (F) expression of CD44 and CD86 are shown. (G) The phenotype of DCs that expressed Eα:MHCII complexes and those that did not were further investigated based on the expression of CD103 and CD11b. n = 3 ± 1 SD (****p < 0.0001).
Figure 3
Figure 3
B1a, B1b, and B2 cells can be identified in the migratory population. Kaede mice were injected with alum/LPS or saline in the hind footpad and photo-conversion was performed 12 h later. Mice were culled after a further 12 h and the popliteal lymph nodes analyzed by flow cytometry. (A) The gating strategy used to identify B cells from the migratory population is highlight. Migratory cells were first identified and B cells selected based on B220 and CD19 expression. B cells subsets were identified using CD5 and CD43. We show (B) The proportion and (C) numbers of each B cell subset. Data are representative of two independent experiments. n = 3 ±1 SD.
Figure 4
Figure 4
Cell migration from the site of challenge to the draining lymph node persists for 48 h post injection. (A,B) Footpads of mice were exposed to violet light 12 h after injection and were culled 24, 36, 48 or 72 h post injection. This strategy allowed us to quantify how long migratory cells took to travel to the dLN and how long they persisted there. (C) The percentage and (D) the total number of live migratory cells in the draining lymph node are shown. (E,F) Alternatively, to define how long migratory cells continue to leave the injection site, footpads were exposed to violet light at 12, 24, 36 of 60 h after injection and were culled 12 h after the photo-conversion time. (G) The percentage and (H) the total number of live migratory cells in the draining lymph node are shown. n = 4 ± 1 SD (****p < 0.0001, ***p < 0.001, ** p < 0.01 and *p < 0.05; data are representative of two independent experiments).
Figure 5
Figure 5
The peak of antigen presentation occurs at 24–36 h post challenge. Mice were treated with alum/LPS/Eα or saline/Eα, photoswitched 12 h later then flow cytometry analysis of isolated LN was performed between 24 and 72 h post challenge. (A) The identification of YAe+ cells was performed using a YAe staining control using the YAe antibody in samples without the Eα peptide. Positive staining in shown for comparison. (B) The number of live migratory MHCII+ cells that present antigen (YAe+). Data are representative of two independent experiments. n = 4 ± 1 SD (**p < 0.01, ***p < 0.001). Mice were treated with alum and LPS or saline with or without the Eα-OVA construct and culled between 24 and 72 h post challenge with photo-conversion performed 12 h before the cull. (C) The number of live migratory MHCII+ cells that are presenting antigen (YAe+) is shown. n = 4 ±1 SD (**p < 0.01, ****p < 0.0001).
Figure 6
Figure 6
Modeling the trafficking of DC between skin and draining lymph nodes. (A) Schematic of the mathematical model of dendritic cell migration. Dendritic cells in the foot pad (X) were photo-converted (X*) and migrate to the lymph node at the rate μ, taking a fixed transit time τ. “Y” is the number of photo-converted DCs that accumulate in the dLN over time and are lost, either by death or egress, with the rate δY. (B) Fits of the model to data, showing the observed and best-fit numbers of photo-converted DCs in draining lymph nodes for saline treatment (left-hand panel) and for alum/LPS treatment (right-hand panel).
Figure 7
Figure 7
Parameter estimates for the best fitting model in which μalum = μ0 + αte−mt and μsaline = μ0. (A) the parameter estimates calculated from the mathematical model are shown. (B) The number of migratory cells identified in the draining lymph node at various times with (C) a schematic of the migration pattern observed over a 72 h period. (D) By combining the data generated from the experimental and mathematic approaches, it is predicted that the cells entering the tissue will follow the same rate of decay and the estimated kinetics of cell migration from the skin to the lymph node and antigen presentation are summarized.

Comment in

References

    1. Wen T, Besse JA, Mingler MK, Fulkerson PC, Rothenberg ME. Eosinophil adoptive transfer system to directly evaluate pulmonary eosinophil trafficking in vivo. Proc Natl Acad Sci USA. (2013) 110:6067–72. 10.1073/pnas.1220572110 - DOI - PMC - PubMed
    1. Dolfi DV, Duttagupta PA, Boesteanu AC, Mueller YM, Oliai CH, Borowski AB, et al. . Dendritic cells and CD28 costimulation are required to sustain virus-specific CD8+ T cell responses during the effector phase in vivo. J Immunol. (2011) 186:4599–608. 10.4049/jimmunol.1001972 - DOI - PubMed
    1. Yang CW, Unanue ER. Neutrophils control the magnitude and spread of the immune response in a thromboxane A2-mediated process. J Exp Med. (2013) 210:375–87. 10.1084/jem.20122183 - DOI - PMC - PubMed
    1. Ando R, Hama H, Yamamoto-Hino M, Mizuno H, Miyawaki A. An optical marker based on the UV-induced green-to-red photoconversion of a fluorescent protein. Proc Natl Acad Sci USA. (2002) 99:12651–6. 10.1073/pnas.202320599 - DOI - PMC - PubMed
    1. Tomura M, Yoshida N, Tanaka J, Karasawa S, Miwa Y, Miyawaki A, et al. . Monitoring cellular movement in vivo with photoconvertible fluorescence protein ‘Kaede’ transgenic mice. Proc Natl Acad Sci USA. (2008) 105:10871–6. 10.1073/pnas.0802278105 - DOI - PMC - PubMed

Publication types