. 2019 Apr 10:10:436.
doi: 10.3389/fpls.2019.00436. eCollection 2019.

A Major Root Architecture QTL Responding to Water Limitation in Durum Wheat

Affiliations

A Major Root Architecture QTL Responding to Water Limitation in Durum Wheat

Samir Alahmad et al. Front Plant Sci. .

Abstract

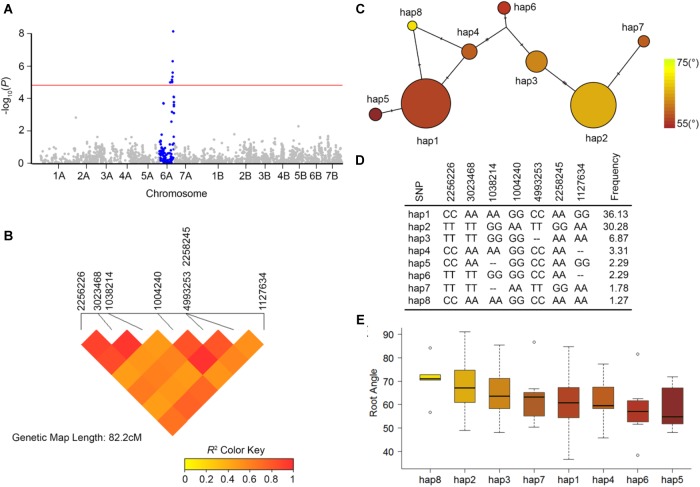
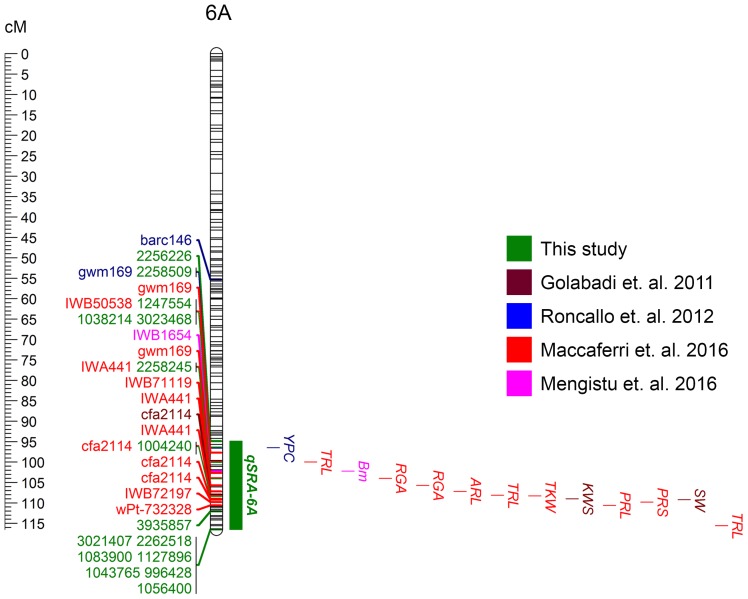
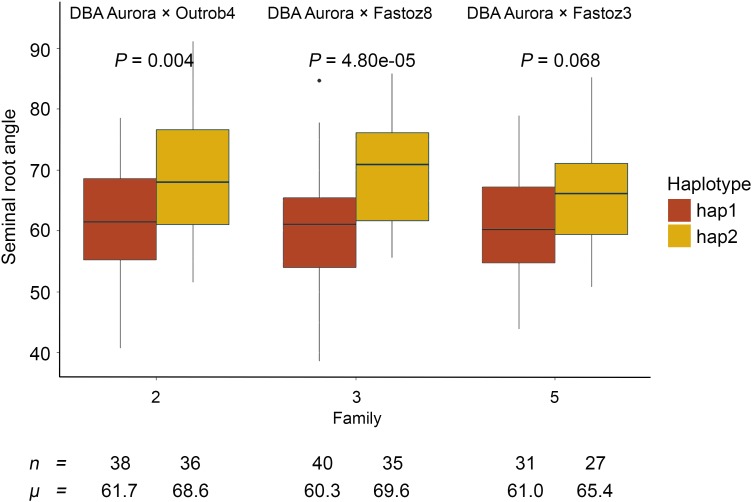
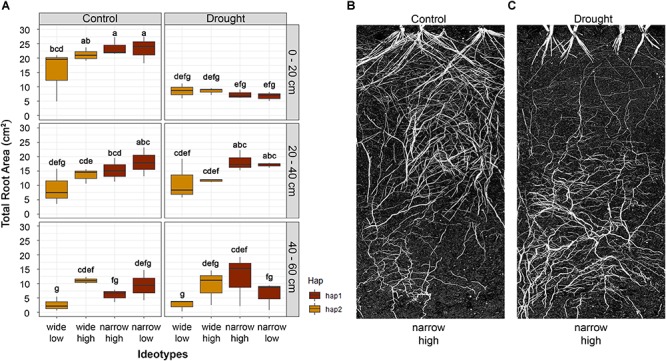
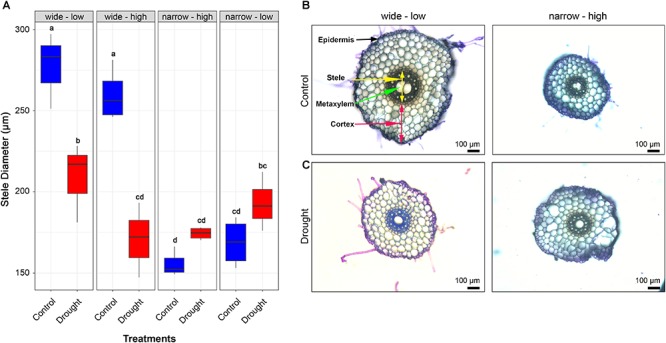
The optimal root system architecture (RSA) of a crop is context dependent and critical for efficient resource capture in the soil. Narrow root growth angle promoting deeper root growth is often associated with improved access to water and nutrients in deep soils during terminal drought. RSA, therefore is a drought-adaptive trait that could minimize yield losses in regions with limited rainfall. Here, GWAS for seminal root angle (SRA) identified seven marker-trait associations clustered on chromosome 6A, representing a major quantitative trait locus (qSRA-6A) which also displayed high levels of pairwise LD (r 2 = 0.67). Subsequent haplotype analysis revealed significant differences between major groups. Candidate gene analysis revealed loci related to gravitropism, polar growth and hormonal signaling. No differences were observed for root biomass between lines carrying hap1 and hap2 for qSRA-6A, highlighting the opportunity to perform marker-assisted selection for the qSRA-6A locus and directly select for wide or narrow RSA, without influencing root biomass. Our study revealed that the genetic predisposition for deep rooting was best expressed under water-limitation, yet the root system displayed plasticity producing root growth in response to water availability in upper soil layers. We discuss the potential to deploy root architectural traits in cultivars to enhance yield stability in environments that experience limited rainfall.

Keywords: GWAS; QTL; drought adaptation; haplotype; root angle; root architecture; seminal roots.


Figures

FIGURE 1
FIGURE 1
Population structure for the durum NAM lines evaluated for seminal root angle using the clear pot method. A principal component analysis based on pairwise modified Roger’s distances calculated from 2,541 polymorphic DArTseq markers was performed for the 393 NAM lines. The ten families NAM lines are derived from two Australian reference varieties (red) and ICARDA elite lines (green).
FIGURE 2
FIGURE 2
Root growth angle phenotypes measured in important durum wheat cultivars from Australia and ICARDA: (A) seminal root angle for Australian variety DBA Aurora (left, wide root angle) and an ICARDA elite founder line Outrob4 (right, narrow root angle) screened using the clear pot method, and (B) in the field using shovelomics method. (C) Nodal Root growth angle field measurements of 14 parental lines used for NAM population development. Correlation between seminal root angle in the glasshouse and mature roots in the field, r = 0.81, P = 0.00038 (D).
FIGURE 3
FIGURE 3
Seminal root growth angle measurements of the 10 NAM families. Families 1 to 5 (red) share DBA Aurora as the common parent, and families 6–10 (green) share Jandaroi as the common parent. Family 1 = DBA Aurora × Fastoz7; Family 2 = DBA Aurora × Outrob4; Family 3 = DBA Aurora × Fastoz8; Family 4 = DBA Aurora × Fadda98; Family 5 = DBA Aurora × Fastoz3, Family 6 = Jandaroi × Fastoz8; Family 7 = Jandaroi × Fastoz10; Family 8 = Jandaroi × Fastoz6; Family 9 = Jandaroi × Fastoz2; Family 10 = Jandaroi × Outrob4. Boxplots display the quartile range and median SRA (horizontal line) of individuals within each of the 10 sub-NAM populations. The broken red line displays the mean SRA value of DBA Aurora and the broken green line displays the mean SRA value of Jandaroi; × represents the mean SRA value of ICARDA founder lines; n represents the number of individuals in each family; μ represents the mean SRA value of each family.
FIGURE 4
FIGURE 4
Genome-wide association mapping for seminal root angle in 393 durum lines using 2,541 high quality DArTseq markers (minor allele frequency > 5%). (A) Manhattan plot showing chromosome 6A (blue) with significant marker-trait association at Bonferroni significant threshold 4.67 (red horizontal line). The x-axis displays the DArTseq markers on 14 chromosomes; y-axis is the –log10(P). (B) Heat map showing pairwise linkage disequilibrium (LD) between 7 significant markers representing major seminal root angle QTL on chromosome 6A (qSRA-6A). Color gradient represents LD as r2. (C) Haplotype network of 8 haplotype variants of the qSRA-6A that were found in the 393 NAM lines. Size of the circles represents the frequency of each haplotype in the population. Node color indicates mean seminal root angle for lines carrying the haplotype. (D) Allelic marker-combination of the 8 haplotypes for the 7 DArTseq markers and the frequency value of each haplotype. (E) Seminal root angle variation in each haplogroup.
FIGURE 5
FIGURE 5
Major QTL for seminal root angle (qSRA-6A) positioned on the Svevo durum physical map (Mbp), along with QTL reported in previous mapping studies including root system architecture traits (TRL, total root length; RGA, root growth angle; ARL, average root length; TRL, total root length; PRL, primary root length; PRS, primary root surface), yield component traits (Bm, biomass; TKW, thousand kernel weight; KWS, grain yield per spike; SW, spike dry matter) and a quality trait (YPC, yellow pigment concentration).
FIGURE 6
FIGURE 6
Seminal root angle measurements in three NAM families segregating for the most common haplotype of the QTL qSRA-6A. Families were derived from crosses between DBA Aurora to three ICARDA lines (Outrob4, Fastoz3, and Fastoz8). In each family, mean SRA value of individuals carrying hap1 and hap2 was compared. The colors represent the two haplotype groups, n represents the number of individuals carrying different haplotype groups, μ represents the mean SRA value of each haplotype group, and P represents significance from an Honestly Significant Difference (HSD) test for the difference between the two haplotype groups within each family.
FIGURE 7
FIGURE 7
Root area distribution of the four root ideotypes wide-low, wide-high, narrow-high and narrow-low at different depths of the growth chamber. (A) Boxplots display root distribution of the four ideotypes under control (well-watered) and drought conditions. The colors represent the two haplotype groups of the root angle qSRA-6A. Letters above boxplots indicate significance difference between the four root ideotypes using least significant difference (LSD) test at α = 0.05. Visualization of a narrow-high root ideotype under (B) controlled (well-watered) and (C) drought conditions is shown.
FIGURE 8
FIGURE 8
Anatomical features of roots sampled from durum wheat genotypes representative of distinct root system ideotypes. (A) Stele diameter of the four root ideotypes of samples collected 10 cm from root apex, under well-watered (control; boxplot colored in blue) and drought conditions (boxplot colored in red). Mean stele diameter with different letters above the boxplot are significantly different. Radial root cross sections on seminal root at 10 cm from root apex displaying anatomical variation in the root ideotype wide root angle with low biomass (B) and narrow root angle with high root biomass (C) under well-watered and drought conditions, scale bars in the cross sections = 100 μm.
FIGURE 9
FIGURE 9
Expression patterns of bread wheat homologs at different age, stage, and tissue specific RNAseq libraries. Heatmap (blue = low; red = high) displayed high expression in root tissues (green) during seedling (pink) and vegetative stage (light green). Genes primarily expressed in the root tissues at seedling and vegetative stages are listed in Table 2.

References

    1. Acuña T. B., Wade L. (2012). Genotype × environment interactions for root depth of wheat. Field Crops Res. 137 117–125. 10.1093/aob/mcs251 - DOI - PMC - PubMed
    1. Alahmad S., Dinglasan E., Leung K. M., Riaz A., Derbal N., Voss-Fels K. P., et al. (2018). Speed breeding for multiple quantitative traits in durum wheat. Plant Methods 14:36. 10.1186/s13007-018-0302-y - DOI - PMC - PubMed
    1. Appels R., Eversole K., Feuillet C., Keller B., Rogers J., Stein N., et al. (2018). Shifting the limits in wheat research and breeding using a fully annotated reference genome. Science 361:eaar7191. 10.1126/science.aar7191 - DOI - PubMed
    1. Araus J., Slafer G., Reynolds M., Royo C. (2002). Plant breeding and drought in C3 cereals: What should we breed for? Ann. Bot. 89 925–940. 10.1093/aob/mcf049 - DOI - PMC - PubMed
    1. Asif M., Kamran A. (2011). Plant breeding for water-limited environments. Crop Sci. 51 2911–2912. 10.2135/cropsci2011.12.0004br - DOI