Review
. 2019 Jun;31(24):e1900321.
doi: 10.1002/adma.201900321. Epub 2019 Apr 26.

Near-Infrared-II Molecular Dyes for Cancer Imaging and Surgery

Affiliations
Review

Near-Infrared-II Molecular Dyes for Cancer Imaging and Surgery

Shoujun Zhu et al. Adv Mater. 2019 Jun.

Abstract

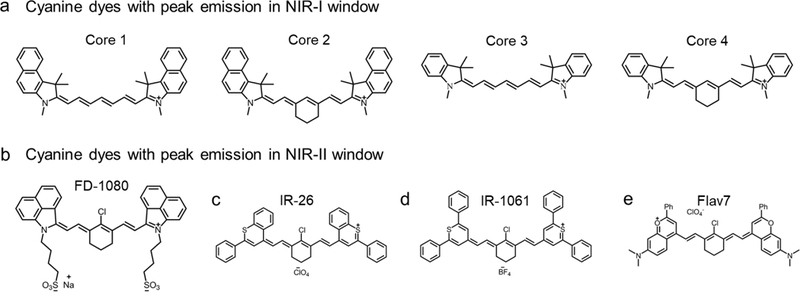
Fluorescence bioimaging affords a vital tool for both researchers and surgeons to molecularly target a variety of biological tissues and processes. This review focuses on summarizing organic dyes emitting at a biological transparency window termed the near-infrared-II (NIR-II) window, where minimal light interaction with the surrounding tissues allows photons to travel nearly unperturbed throughout the body. NIR-II fluorescence imaging overcomes the penetration/contrast bottleneck of imaging in the visible region, making it a remarkable modality for early diagnosis of cancer and highly sensitive tumor surgery. Due to their convenient bioconjugation with peptides/antibodies, NIR-II molecular dyes are desirable candidates for targeted cancer imaging, significantly overcoming the autofluorescence/scattering issues for deep tissue molecular imaging. To promote the clinical translation of NIR-II bioimaging, advancements in the high-performance small molecule-derived probes are critically important. Here, molecules with clinical potential for NIR-II imaging are discussed, summarizing the synthesis and chemical structures of NIR-II dyes, chemical and optical properties of NIR-II dyes, bioconjugation and biological behavior of NIR-II dyes, whole body imaging with NIR-II dyes for cancer detection and surgery, as well as NIR-II fluorescence microscopy imaging. A key perspective on the direction of NIR-II molecular dyes for cancer imaging and surgery is also discussed.

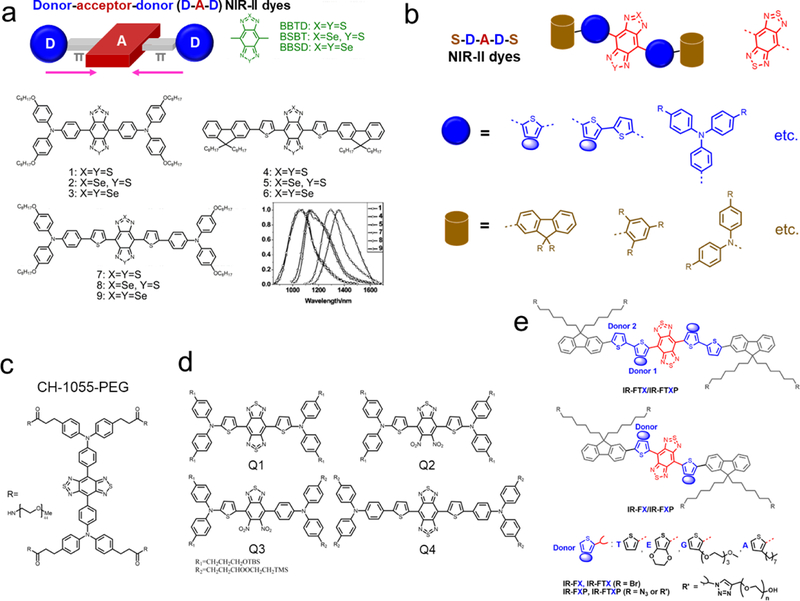
Keywords: cyanine dyes; donor-acceptor-donor dyes; near-infrared (NIR)-II fluorophores; near-infrared (NIR)-II imaging; tumor imaging.


Figures

Figure 1.
Figure 1.. Typical chemical structures of cyanine and other polymethine fluorophores in NIR-I/II windows.
a) The typical backbone structure of cyanine dyes. Representativeness of Core 1 is ICG, IR-125; Core 2: IR-820, IR-830, Cy7.5; Core 3: DiR, HITCI; Core 4: IRDye800cw, IR-783, IR12-N3, Cy7, IR-775, IR-780, etc. The cyclohexene can also be replaced by cyclopentene or other derivatives, e.g. IR-806, IR-797, IR-140, etc. NIR-II tail emission of part of NIR-I dyes was observed.[73] Reprinted with permission from Ref. [73]. b) Chemical structure of FD1080,[69] similar core structure also includes commercial IR-1048 and synthesized IR-1048-MZ.[71] c) Chemical structure of IR-26 dye. d) Chemical structure of IR-1061. e) Flav7 absorbs and emits light over 1000 nm, with much-enhanced QY and absorption coefficient. Reprinted with permission from Ref. [63].
Figure 2.
Figure 2.. Highly photoluminescent cyanine dyes (peak emission at 750–850 nm) have nonnegligible emission tails ending up to NIR-II region.
a) The NIR-II tail of ICG and IRDye800 was first reported by Antaris et al.[72] in their paper Figure S14: NIR-II spectra of NIR-I/II dyes past 1000 nm. Emission spectra at wavelengths longer than 900 nm after 808 nm laser excitation from NIR-II fluorophores including CH-4T, CH-4T/FBS, and HiPCO carbon nanotubes as well as NIR-I dyes such as IRDye800 and ICG/FBS. Reprinted with permission from Ref. [72]. b-c) NIR-II fluorescence emission of typical cyanine dye, ICG. b) Silicon detector (blue line) artificially suppressed the true emission shoulder due to the sharp drop in quantum efficiency starting at 900 nm. The InGaAs detector (red line) can recover the true emission tail of ICG. c) The NIR-II fluorescence of ICG was even detectable up to 1575 nm. Reprinted with permission from Ref. [74]. d-f) Absorption, NIR-I and NIR-II emission of commercial cyanine dye IR-12N3. The inset figure is 2D NIR-II imaging of IR-12N3 aqueous solution at 1100, 1200 and 1300 sub-window, respectively. d) Testing the emission of IR-12N3 under a silicon detector recorded a false emission spectrum, which disobeyed the mirror rule (absorption spectrum is symmetry with the emission spectrum). e) The InGaAs 1D detector with high sensitivity spanning from 850 to >2000 nm can monitor the accurate emission spectrum of IR-12N3 in this region. f) NIR-I QYs of IR-12N3 was quantified 2–3 fold higher than IRDye800CW or ICG in FBS buffers. Reprinted with permission from Ref. [73].
Figure 3.
Figure 3.. Chemical structures of current hydrophobic and water-soluble D-A-D fluorophores.
a) Peak regulation (from 1000 to 1400 nm) of hydrophobic D-A-D dyes with tuning both acceptors and donors. A typical guidance of chemical structure design is reported for D-A-D fluorophores with three acceptors, and the selective combination produced fluorophores 1–9 with tunable emission spectra in toluene. Reprinted with permission from Ref. [50][51]. b) The general structure of recently reported D-A-D/S-D-A-D-S dyes for NIR-II bioimaging. c) The first water-soluble NIR-II dye is CH1055-PEG. Reprinted with permission from Ref. [88]. d) Design of NIR-II dyes based on CH1055 scaffold and the chemical structures of Q1-Q4. Reprinted with permission from Ref. [92]. e) Schematic illustration of the design of bright molecular fluorophores with either single or double-donor optimization produced several key fluorophores.[18, 89, 93, 94] Reprinted with permission from Ref. [95]. To avoid repetition, please also check other structures in Figure 6,[72] 8[98, 101, 102], 10.[91] and Table 1.
Figure 4.
Figure 4.. Theoretical calculation revealed the NIR-II tail emission mechanism of cyanine dyes.
a) The calculated backbone structure of ICG and IR-12N3. b-c) The relationship between bond lengths and emission wavelength with respect to twisted angles. d) The simulated HOMOs and LUMOs shapes for two typical cyanine core structures. e) Quantitatively mapping of electrostatic potential (ESP) exterior for the backbone of cyanine dyes. f) The graphic interpretation of the emission tail mechanism and TICT was suggested for such tail emission behaviors. Reprinted with permission from Ref. [73].
Figure 5.
Figure 5.. Theoretical simulation of the interaction between H2O molecules and the BBTD core acceptor of the D-A-D dyes (IR-FTAP and IR-FTTP).
Grey part indicates the π-electron cloud; blue line represents a PEG chain; the yellow line shows an alkyl chain; the H2O molecules neighboring the BBTD internal in the adequate contact space (R = 6 ~ 7 Å) are shown as a definite water model. Reprinted with permission from Ref. [95].
Figure 6.
Figure 6.. QYs enhancement of NIR-II fluorophores.
a) CH1055 and its derivative CH-4T. b) NIR-II imaging of CH-PEG and CH-4T in DIUF, FBS and PBS, respectively (imaging details: 1100 nm long-pass filter (LP), 10 ms exposure time). c) NIR-II emission spectra of CH-PEG and CH-4T. d) Intensity normalized fluorescent spectra of CH-4T in a different medium, indicating a blue shift in FBS. e) DGU proved that CH-4T@FBS complex has a larger weight than free CH-4T molecules (imaging details: 1000 nm LP, 10 ms). Reprinted with permission from Ref. [72]. f-h) The bright NIR-II nanocomplex p-FE was developed by polymer wrapping method. f) Scheme of synthesis of the p-FE fluorophore. g-h) DLS analysis, absorption, and NIR-II emission spectra (808 nm laser excitation) of the p-FE fluorophore in PBS buffer. Reprinted with permission from Ref. [99].
Figure 7.
Figure 7.. Bioconjugations between NIR-II fluorophores and proteins.
a) The copper-free click chemistry was applied to conjugate the IR-FGP fluorophore with proteins of interest. b) Density gradient ultracentrifugation (DGU) was performed to purify the SA@IR-FGP and Erb@IR-FGP conjugates. The applied sucrose gradient encompasses from 1.06–1.23 g/ cm3 (15–50 wt.%) (imaging details: 850/1000 nm short-pass (SP) filters and 900/1100-nm LP emission filters). c) A new reverse phase protein lysate microarray method was exploited to test the quality of conjugates. In detail, 1. The BSA-biotin, “catching” a primary antibody or cell lysate, was printed on the gold chips. 2. The purified conjugates were incubated on top of the printed spots under the cavity of frames. 3. Check the PL intensity by 10X magnification NIR II set-up with desired long-pass emission filter combination. d) Targeted cell imaging by Erb@IR-FGP on positive and negative cell lines respectively (imaging details: 785 nm excitation and 1050 nm LP emission filter). Reprinted with permission from Ref. [93].
Figure 8.
Figure 8.. Renally excreted NIR-II dyes.
a-c) Chemical structure of renally excreted NIR-II dyes (CH1055PEG,[88] IR-E1,[98] and IR-BGP6[100, 101]) with D-A-D or S-D-A-D-S structures. d) Injection of CH1055-PEG and HiPCO SWCNTs fluorophores in mouse showed disparate liver and bladder signals, respectively, indicating the typical behavior of renally excreted molecules (imaging details: 1200 nm LP, 100 ms). Reprinted with permission from Ref. [88].
Figure 9.
Figure 9.. The first NIR-II molecular imaging-guided tumor surgery.
a) Reaction scheme of NIR-II conjugate CH1055@affibody. b) Targeted cell staining indicated the successful conjugation of CH1055 with EGFR affibody. c-d) NIR-II imaging with tail injection of CH1055@affibody conjugate showed great targeting ability. e) The imaging-guided surgery can remove the tumor via complete excision. f) T/NT ratios with CH1055-affibody targeted tumor imaging. Reprinted with permission from Ref. [88].
Figure 10.
Figure 10.. NIR-II molecular imaging with the peptide conjugate.
a) Scheme of SXH and H1. b) Absorption and emission of H1. c) U87MG cell targeted imaging with H1@RGD conjugates. d) U87MG tumor-bearing mice imaging with H1@RGD conjugates or the blocking agent RGD (imaging details: 1000 nm LP, 200 ms). Reprinted with permission from Ref. [91].
Figure 11.
Figure 11.. NIR-II confocal imaging of brain vessel.
a) Picture and NIR-II imaging of mouse brain after p-FE administration above 1200 nm long pass filter and 5 ms exposure time. b-d) NIR-II confocal imaging can reconstruct the three-dimensional vessel structure in the mouse brain. The field view of b is 200 μm2, c is 3000*2000 μm (imaging details: 785 nm excitation, 1100 nm LP emission, laser power ~30 mW). Reprinted with permission from Ref. [99].
Figure 12.
Figure 12.. NIR-II dual-color tumor imaging.
a) Whole body imaging of 4T1 tumor-bearing mouse after p-FE administration (imaging details: 1300 nm LP, 5 ms). b) The laser-ablation CNT was used to light up the 4T1 tumor while p-FE was injected to visualize the tumor vessels. c) NIR-II confocal dual-color imaging of 4T1 tumor. The field view is 740 μm2, and the scanned depth was 220 μm (imaging details: 2–5.4 μm step size, Laser power ~30 mW, 15 min/frame, Pinhole: 150–300 μm, 1100 nm LP+1300 nm SP for p-FE, 1500 nm LP for laser CNT). Reprinted with permission from Ref. [99].
Figure 13.
Figure 13.. NIR-II lymph node imaging through NIR-II fluorophores.
a) Photograph of imaging position/field view of a nude mouse for popliteal and sacral lymph nodes imaging. b) NIR-I imaging with ICG showed much scattering of lymph nodes (imaging details: 16 mWcm−2 785-nm laser with 780 band-pass filter, silica camera, 50 ms). c) NIR-II imaging with either CH-4T/PBS (left foot) or CH-4T/HSA-HT (right foot) showed the sharp shape of the lymph nodes. Scale bar is 1 cm (imaging details: InGaAs camera, 1100 nm LP, 100 ms). d) Photograph of imaging position/angle for lumbar lymph nodes (yellow stars). e) Scheme of compressing mouse reduced the distance from 1.5 to 0.5 cm. f) NIR-I/II mapping of lumbar lymph nodes with the administration of ICG and CH-4T@HSA complex, respectively. Scale bar is 1 cm (imaging details: silica camera and 300 ms for ICG channel, InGaAs camera and 400 ms for CH-4T channel). g) Signal profiles of lumbar lymph nodes. Reprinted with permission from Ref. [72]. h) The photograph showed a U87MG tumor-bearing nude mouse, with the intramuscular injection of ICG or CH1055-PEG. i–k) NIR-I/NIR-II imaging exhibited different imaging quality of inguinal lymph node and adjunctive lymphatic vasculature (imaging details: 850–900 nm and 100 ms for ICG, 1200 nm LP and 200–300 ms for CH1055-PEG). Reprinted with permission from Ref. [88].
Figure 14.
Figure 14.. NIR-II confocal imaging.
a) Optical scheme of the first NIR-II confocal microscopy with the stage scanning approach. b-c) The NIR-II confocal microscopy enabled the 2D and 3D imaging of mouse ovary with improved penetration depth and contrast resolution. The 3D imaging can distinguish the stage development of ovary with recognizing the theca layer, mature granulosa cells, and corpora lutea cells (imaging details: 785 nm excitation, 1100 nm LP emission, laser power ~30 mW). Reprinted with permission from Ref. [18].
Figure 15.
Figure 15.. The reduced tissue autofluorescence and scattering are the motivation for developing NIR-II fluorescence-derived biomedical imaging.
a) Excitation laser-organ/tissue interactions include blue excitation light, cyan reflection, green scattering, black absorption, as well as brown autofluorescence. All of these parameters generate the loss of fluorescence and the gain of background signals (noise). b) Diminished scattering coefficients of different tissue phantoms as a function of wavelengths. c) Quantum efficiency curves for several cameras based on silicon, InGaAs or HgCdTe sensors. d) NIR-II guided imaging will improve the surgery accuracy with lower autofluorescence and scattering compared with NIR-I navigation system. Reproduced with permission from ref. [4] for a-b) and ref. [150] for c).

References

    1. Zhang RR, Schroeder AB, Grudzinski JJ, Rosenthal EL, Warram JM, Pinchuk AN, Eliceiri KW, Kuo JS, Weichert JP, Nat. Rev. Clin. Oncol. 2017, 14, 347. - PMC - PubMed
    1. Vahrmeijer AL, Hutteman M, van der Vorst JR, van de Velde CJ, Frangioni JV, Nat. Rev. Clin. Oncol. 2013, 10, 507. - PMC - PubMed
    1. Mondal SB, Gao S, Zhu N, Liang R, Gruev V, Achilefu S, Adv. Cancer. Res. 2014, 124, 171. - PMC - PubMed
    1. Hong G, Antaris AL, Dai H, Nat. Biomed. Eng. 2017, 1, 0010.
    1. Stummer W, Pichlmeier U, Meinel T, Wiestler OD, Zanella F, Reulen H-J, Lancet Oncol. 2006, 7, 392. - PubMed

Substances

LinkOut - more resources