. 2019 May;33(3):1530-1539.
doi: 10.1111/jvim.15502. Epub 2019 Apr 25.

Clinical utility of urine specific gravity, electrical conductivity, and color as on-farm methods for evaluating urine concentration in dairy cattle

Affiliations

Clinical utility of urine specific gravity, electrical conductivity, and color as on-farm methods for evaluating urine concentration in dairy cattle

Ameer A Megahed et al. J Vet Intern Med. 2019 May.

Abstract

Background: Urine concentration (UC) provides clinically useful information concerning hydration status and renal function of animals.

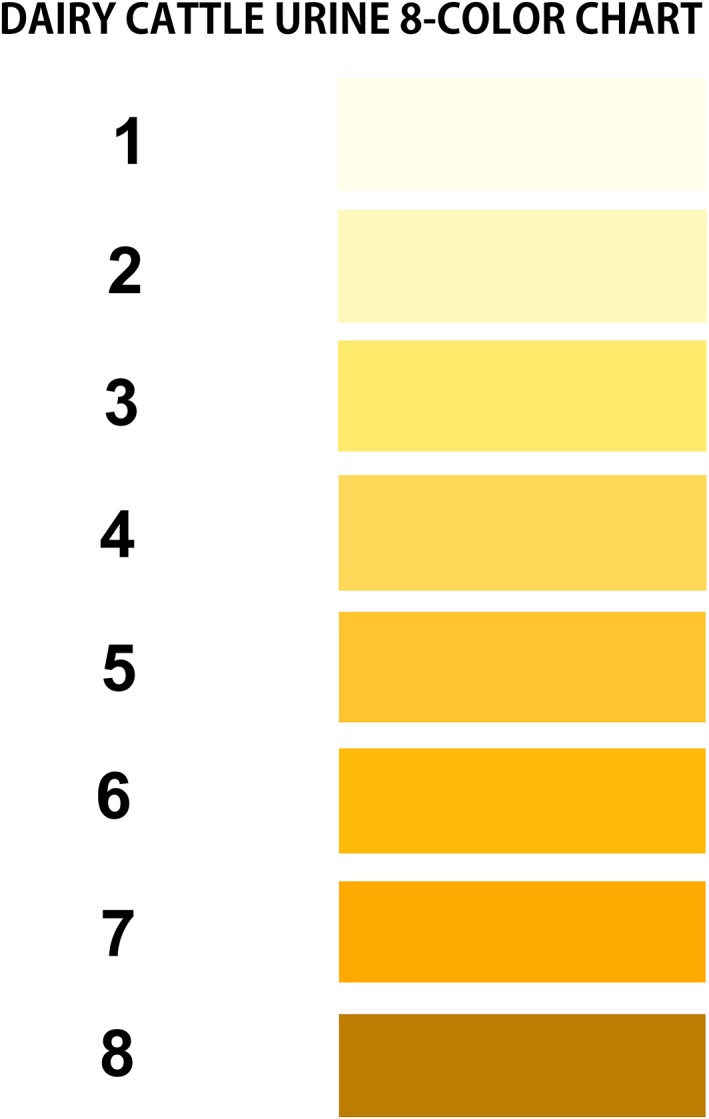
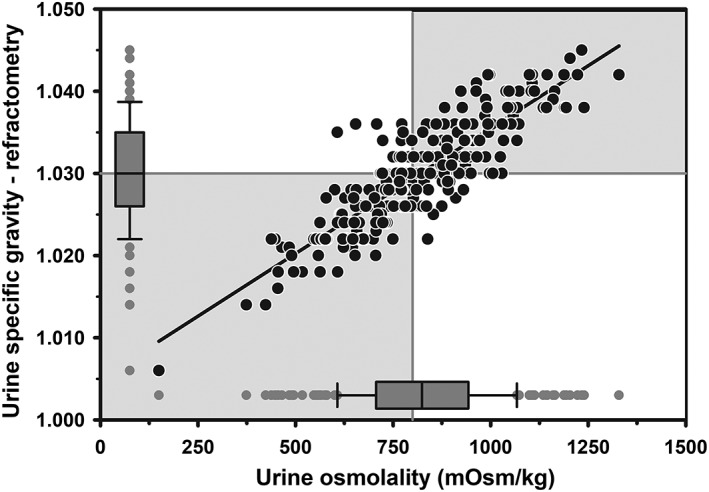
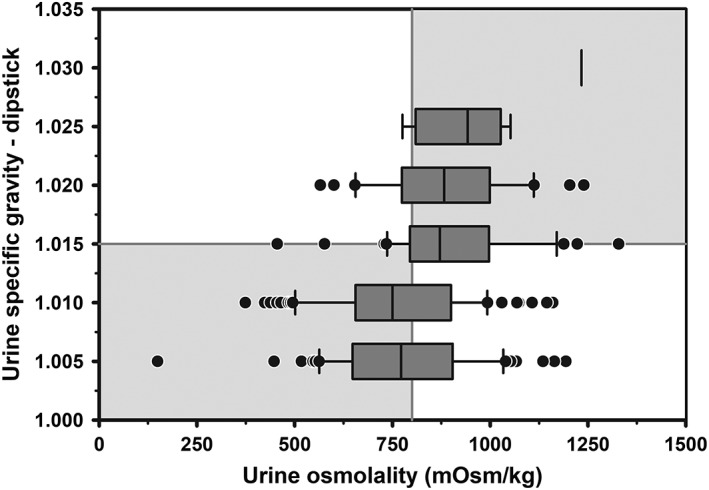
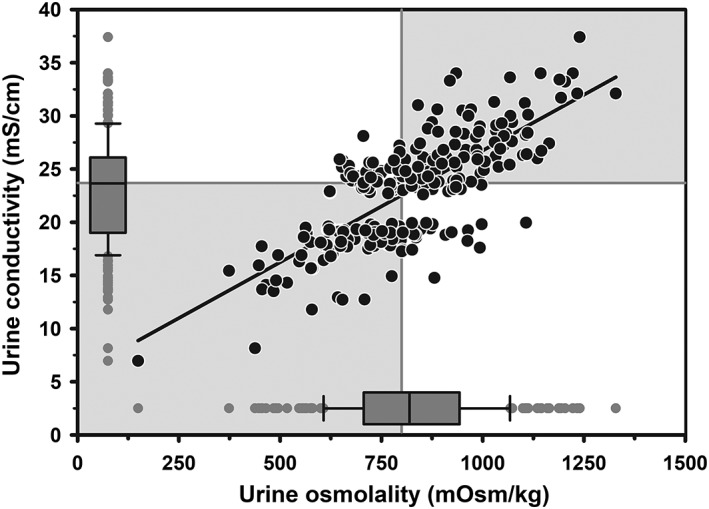
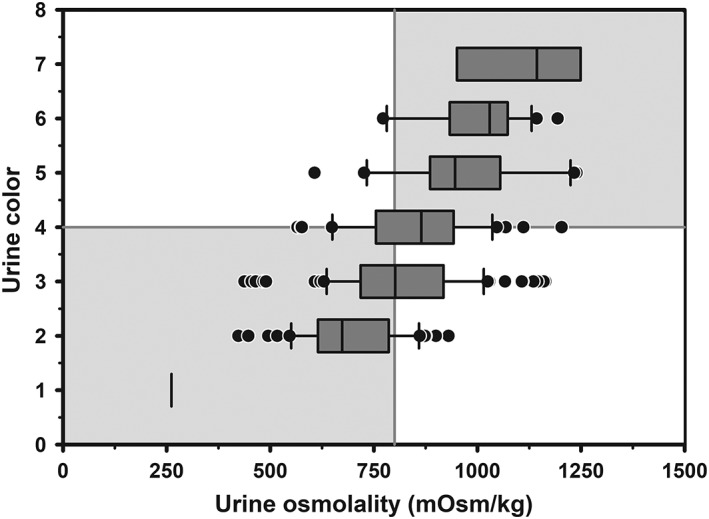
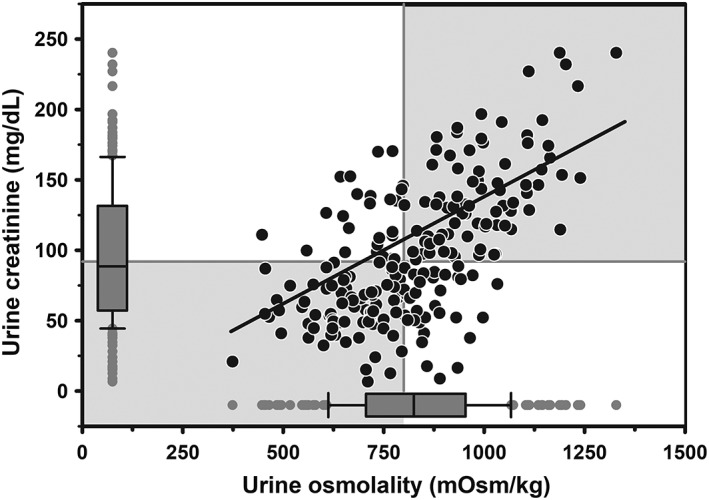
Objectives: To characterize the clinical performance of urine specific gravity measured by optical refractometry (USG-R ) or Multistix-SG urine reagent dipstick (USG-D ), urine electrical conductivity using an OAKTON Con 6 conductivity handheld meter (UEC ), urine color (UColor ) using a custom-designed 8-point color chart, and urine creatinine concentration (UCreat ) for assessing UC in dairy cattle.

Animals: 20 periparturient Holstein-Friesian cows.

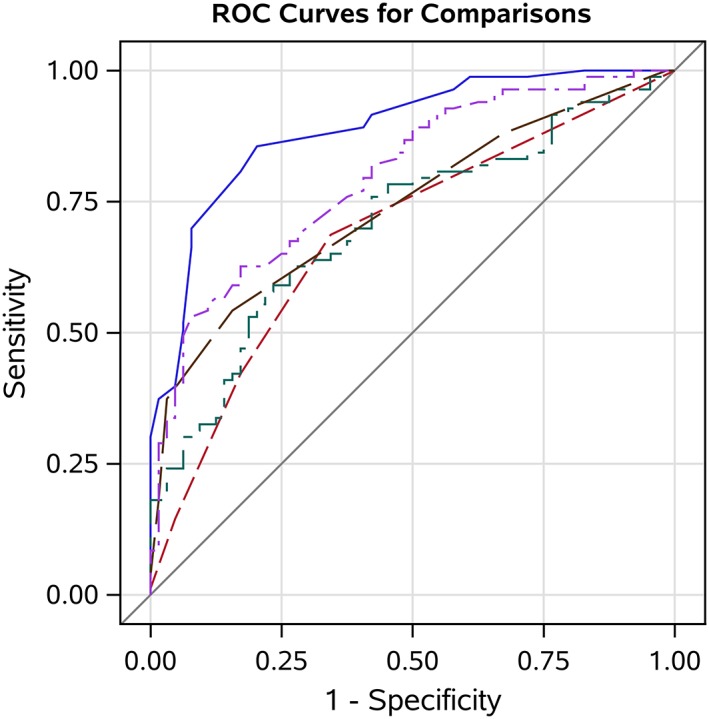
Methods: Urine was obtained by perineal stimulation or urethral catheterization and urine osmolality (UOsm , reference method), USG-R , USG-D , UEC , UColor , and UCreat determined. Diagnostic test performance was evaluated using Spearman's rho and logistic regression to determine the area under the receiver operating curve (AUC) and optimal cut point for diagnosing hypohydration (UOsm ≥800 mOsm/kg). P < .05 was considered significant.

Results: The best performing test for diagnosing hypohydration was USG-R (AUC = 0.90) at an optimal cut point ≥1.030. The second-best performing test was UEC (AUC = 0.82) at a cut point of ≥23.7 mS/cm, followed by UCreat (AUC = 0.76) at a cut point of ≥95.3 mg/dL, and UColor (AUC = 0.74) at a cut point of ≥4 on an 8-point scale. Urine specific gravity measured by dipstick performed poorly (AUC = 0.63).

Conclusions and clinical importance: USG-R and UEC provide practical and sufficiently accurate methods for measuring UC in dairy cattle. Urine color had moderate clinical utility as a no-cost cow-side method for assessing UC, whereas dipstick refractometry is not recommended for assessing UC.

Keywords: bovine; dehydration; hypohydration; refractometer; urine color chart; urine creatinine; urine dipstick.


Conflict of interest statement

Authors declare no conflict of interest.

Figures

Figure 1
Figure 1
Eight‐color urine chart for assessing urine concentration in periparturient multiparous dairy cows
Figure 2
Figure 2
Scatterplot of the linear relationship between urine specific gravity measured by optical refractometry (USG‐R) and urine osmolality (UOsm, reference method) for 242 urine samples obtained periodically from 20 multiparous periparturient Holstein‐Friesian cows from late gestation to early lactation. Some data points are superimposed. The solid black line is the line of regression. The solid gray vertical line indicates the recommended threshold value for diagnosing hypohydration (UOsm ≥800 mOsm/kg), and the solid gray horizontal line indicates the optimal cut point of USG‐R (≥1.030) identified by logistic regression for diagnosing hypohydration. The box and whiskers plot represents the median (middle line), interquartile range (ends of the shaded rectangle), 10% to 90% confidence interval (whiskers), and values outside this confidence interval (small gray circles)
Figure 3
Figure 3
Box and whiskers plot of the association between corrected urine specific gravity measured by urine dipstick (USG‐D) and urine osmolality (UOsm, reference method) for 241 urine samples obtained periodically from 20 multiparous periparturient Holstein‐Friesian cows. The solid gray vertical line indicates the recommended cut point for UOsm (≥800 mOsm/kg) for diagnosing hypohydration, and the solid gray horizontal line indicates the optimal cut point for corrected USG‐D (≥1.015) identified by logistic regression for diagnosing hypohydration. The box and whiskers plot represents the median (middle line), interquartile range (ends of the shaded rectangle), 10% to 90% confidence interval (whiskers), and values outside this confidence interval (small gray circles)
Figure 4
Figure 4
Scatterplot of the linear relationship between urine electrical conductivity (UEC) and osmolality (UOsm) for 237 urine sample obtained periodically from 20 multiparous periparturient Holstein‐Friesian cows. Some data points are superimposed. The solid line is the line of regression. The solid gray vertical line indicates the recommended cut point for UOsm (≥800 mOsm/kg), and the solid gray horizontal line indicates the optimal cut point for UEC (≥23.7 mS/cm) identified by logistic regression for diagnosing hypohydration. The box and whiskers plot represents the median (middle line), interquartile range (ends of the shaded rectangle), 10% to 90% confidence interval (whiskers), and values outside this confidence interval (small gray circles)
Figure 5
Figure 5
Box and whiskers plot of the association between urine color (8 levels) and urine osmolality (UOsm; reference method) for 237 urine samples obtained periodically from 20 multiparous periparturient Holstein‐Friesian cows. The solid gray vertical line indicates the recommended cut point for UOsm (≥800 mOsm/kg) for diagnosing hypohydration, and the solid gray horizontal line indicates the optimal cut point for color (≥4) identified by logistic regression for diagnosing hypohydration. The box and whiskers plot represents the median (middle line), interquartile range (ends of the shaded rectangle), 10% to 90% confidence interval (whiskers), and values outside this confidence interval (small gray circles)
Figure 6
Figure 6
Scatterplot of the linear relationship between urine creatinine concentration (UCreat) and urine osmolality (UOsm; reference method) for 217 urine samples from 20 multiparous periparturient Holstein‐Friesian cows. Some data points are superimposed. The solid line is the line of regression. The solid gray vertical line indicates the recommended threshold value for detecting hypohydration (UOsm, ≥800 mOsm/kg), and the solid gray horizontal line indicates the optimal cut point value for UCreat (≥95.3 mg/dL) identified by logistic regression for diagnosing hypohydration. The box and whiskers plot represents the median (middle line), interquartile range (ends of the shaded rectangle), 10% to 90% confidence interval (whiskers), and values outside this confidence interval (small gray circles)
Figure 7
Figure 7
Receiver operating characteristic (ROC) curves and the area under the curve (AUC) demonstrating the diagnostic ability of urine specific gravity measured by optical refractometry (USG‐R, blue solid line; AUC = 0.90), urine electrical conductivity (UEC, purple 2‐dashed line; AUC = 0.82), urine creatinine concentration (UCreat, green dash‐dot line; AUC = 0.76), urine color (UColor, brown long‐dashed line; AUC = 0.74), and urine specific gravity measured by Multistix‐SG urine dipstick (USG‐D, red short‐dashed line; AUC = 0.63) to detect hypohydration (≥800 mOsm/kg) in dairy cattle. The diagonal line represents the ROC curve for a test of no predictive ability. The optimal cut points for detecting hypohydration were ≥1.030, ≥23.7 mS/cm, ≥4, ≥95.3 mg/dL, and ≥1.015, for the USG‐R, UEC, UColor, UCreat, and USG‐D, respectively

References

    1. Thornton JR, English BP. Specific gravity and osmolality as measures of urine concentration in the calf. Aust Vet J. 1976;52:335‐337. - PubMed
    1. Silanikove N. The struggle to maintain hydration and osmoregulation in animals experiencing severe dehydration and rapid rehydration: the story of ruminants. Exp Physiol. 1994;79:281‐300. - PubMed
    1. Alcántara‐Isidro GJ, García‐Rodríguez MB, Diez‐Prietoa IM, et al. Urine concentration in healthy and diseased dairy cows during the first month after calving: comparison of the refractometry and reagent strip methods. J Vet Sci. 2015;1:34‐41.
    1. Chadha V, Garg U, Alon U. Measurement of urinary concentration: a critical appraisal of methodologies. Pediatr Nephrol. 2001;16:374‐382. - PubMed
    1. Ayoub JA, Beaufrere H, Acierno MJ. Association between urine osmolality and specific gravity in dogs and the effect of commonly measured urine solutes on that association. Am J Vet Res. 2013;74:1542‐1545. - PubMed