. 2019 May 17;14(5):916-924.
doi: 10.1021/acschembio.9b00113. Epub 2019 May 3.

Targeted Protein Degradation through Cytosolic Delivery of Monobody Binders Using Bacterial Toxins

Affiliations

Targeted Protein Degradation through Cytosolic Delivery of Monobody Binders Using Bacterial Toxins

Nadine Eliane Schmit et al. ACS Chem Biol. .

Abstract

Monobodies are small engineered binding proteins that, upon expression in cells, can inhibit signaling of cytosolic oncoproteins with outstanding selectivity. Efficacy may be further increased by inducing degradation of monobody targets through fusion to the von Hippel-Lindau (VHL) substrate receptor of the Cullin2-E3 ubiquitin ligase complex. However, potential therapeutic use is currently limited, because of the inability of monobody proteins to cross cellular membranes. Here, we use a chimeric bacterial toxin, composed of the Shiga-like toxin B (Stx2B) subunit and the translocation domain of Pseudomonas aeruginosa exotoxin A (ETA-II) for delivery of VHL-monobody protein fusions to target endogenous tyrosine kinases in cancer cells. Depending on the expression of the Stx2B receptor Gb3 on the cell surface, we show that monobodies are taken up by an endocytic route, but are not degraded in lysosomes. Delivery of monobodies fused to a nuclear localization signal resulted in accumulation in the nucleus, thereby indirectly, but unequivocally, demonstrating cytosolic delivery. Delivery of VHL fused to monobodies targeting the Lck tyrosine kinase in T-cells resulted in reduced Lck protein levels, which was dependent on the expression of Gb3. This led to the inhibition of proximal signaling events downstream of the T-cell receptor complex. This work provides a prime example of the delivery of a stoichiometric protein inhibitor of an endogenous target protein to cells and inducing its degradation without the need of genetic manipulation of target cells. It lays the foundation for further in vivo exploitation of this delivery system.


Conflict of interest statement

The authors declare no competing financial interest.

Figures

Figure 1
Figure 1
Expression and purification of recombinant toxin–monobody fusion proteins. (a) Schematic of the constructs with their monomeric and pentameric size given in kDa. (b) Size exclusion chromatogram of StxB-ETAII-ML3 as representative for the other purified proteins. (c) Coomassie-stained SDS-PAGE gel of StxB-TDP-ML3 with the fractions from the Ni-NTA purification and the main peak of the SEC after concentration. [Legend: L, crude lysate; FT, flow-through; W, wash; and E, elution.] (d) Corresponding immunoblot with an antibody recognizing penta-His.
Figure 2
Figure 2
Toxin–monobody delivery in HeLa cells. (a) HeLa cells were incubated with 1 μM toxin–emGFP and imaged at different time points; (b) HeLa cells were incubated with 1 μM AF488-labeled toxin–AS25 and imaged at different time points; and (c) HeLa cells were incubated with 0.1 μM or 1 μM or 2.5 μM toxin–AS25 for 1h. Live cells were imaged on a confocal microscope. Scale bars correspond to 10 μm. Image quantification of these experiments are shown in Figure S2 in the Supporting Information.
Figure 3
Figure 3
Life-cell imaging of delivery of SNAP-tagged toxin–monobody fusion proteins in HeLa cells. (a) HeLa cells were incubated with toxin–SNAP–AS25 prelabeled with BG-647 for the indicated durations. (b) HeLa cells were incubated with unlabeled toxin–SNAP–ML3 for the indicated durations, washed, and incubated with either BG-SiR or BG-647 for 30 min. The bottom image shows HeLa cells incubated only with BG-SiR, but no protein. (c) HeLa cells were incubated for 1 h with BG-647-labeled toxin–SNAP–AS25, washed, and incubated in medium for 2.5, 9, or 24 h. Live cells were imaged on a confocal microscope. Scale bars correspond to 10 μm. Image quantification of these experiments are shown in Figure S2 in the Supporting Information.
Figure 4
Figure 4
Subcellular localization of toxin–monobody fusion proteins. (a) Colocalization analysis of BG-647 labeled toxin–SNAP–AS25 with early endosomes in HeLa cells. HeLa cells were incubated with the protein for 10 min, washed, incubated in growth medium, and fixed after 0, 10 min, 30 min, or 1 h. Early endosomes were stained with an antibody against EEA1 and the Mander’s overlap coefficient 2 between the antibody and the protein signals is plotted for each cell. (Plots of Mander’s 1 versus 2 are shown in Figure S3 in the Supporting Information.) P-values were calculated using a Welch two-sample t-test. (b) Colocalization analysis of BG-647 labeled toxin–SNAP–AS25 with lysosomes in HeLa cells. Lysosomes were stained with an antibody against Lamp1 and the Mander’s overlap coefficient 2 between the antibody and the protein signals is plotted for each cell. (Plots of Mander’s 1 versus 2 are shown in Figure S4 in the Supporting Information.) (c) Uptake of NLS-tagged toxin–monobody proteins in the nucleus. HeLa cells were incubated with AF-488-labeled toxin–ML3–NLS or toxin–AS25–NLS or toxin–AS25 (without NLS) for 2.5 h, washed, and incubated in growth medium for the indicated total times. The fluorescence intensity of the 488 nm signal in the nucleus stained with Hoechst was quantified from confocal microscopy images of live cells. Each dot represents the mean 488 nm fluorescence in the nucleus of a single cell, normalized to the mean of the control cells incubated with unlabeled toxin–AS25–NLS. P-values were calculated using a Welch two-sample t-test. Boxplots represent the median value, the first and third quartiles (lower and upper hinges), and the smallest and largest value within 1.5 times the interquartile range (lower and upper whiskers). An independent repeat of the experiment with additional time points is shown in Figure S5D in the Supporting Information.
Figure 5
Figure 5
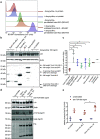
Delivery of toxin–VHL–ML3 in Jurkat cells. (a) A4GALT-transduced Jurkat cells were treated with doxycycline for 24 h to induce Gb3 expression (blue, orange, and purple lines) or left untreated (red and green lines). Uninduced cells were incubated with BG-647 labeled toxin–SNAP–ML3 for 30 min (green line); doxycycline-induced cells were incubated with unlabeled toxin–SNAP–ML3 for 30 min, washed, and subsequently incubated with BG-647 (orange line); doxycycline-induced cells were incubated with BG-647 labeled toxin–SNAP–ML3 for 30 min (purple line). All cells were washed and analyzed by flow cytometry. One representative plot is shown out of two biological repeats. (b) Expression of Gb3 was induced by addition of doxycycline in Jurkat cells, as indicated, and cells were incubated for 48 h with the indicated proteins, washed, and lysed. The cell lysate was immunoblotted with antibodies against Lck, Actin, and penta-His. (c) Quantification of the Lck immunoblot normalized to Actin and to the control where no protein was added. Each dot represents a biological repeat of the experiment. Toxin–VHL–MbCtrl means that either toxin–VHL–HA4_YA or toxin–VHL–AS25 was used as a control (two repeats of each). P-values were calculated using a two-tailed t-test. (Single asterisk (*) denotes p < 0.05, whereas a double asterisk symbol (**) denotes p < 0.005 data.) Error bars indicate the SD of the repeats. (d) Jurkat cells expressing Gb3 (induced with doxycycline) were incubated for 48 h with the indicated proteins. Cells were stimulated with an anti-TCR antibody for 5 min and lysed. Immunoblot analysis of the cell lysate with antibodies against Lck, Actin, phosphorylated Y319 residue of Zap70, total Zap70, and His-tagged proteins are shown from top to bottom. One representative blot is shown from three biological repeats. Quantification of the Lck immunoblot normalized to Actin is shown in Figure S7e in the Supporting Information. Quantification of the pY319 Zap70 immunoblot normalized to the loading control (Actin or total Zap70) and to the unstimulated cells incubated with toxin–VHL–HA4_YA from three biological repeats. P-values were calculated using a ratio paired t-test. (Single asterisk symbol (*) denotes p < 0.05.) Error bars indicate the SD of the repeats.

References

    1. Carter P. J.; Lazar G. A. (2017) Next generation antibody drugs: pursuit of the ’high-hanging fruit’. Nat. Rev. Drug Discovery 17, 197–223. 10.1038/nrd.2017.227. - DOI - PubMed
    1. Wang Q.; Zorn J. A.; Kuriyan J. (2014) A structural atlas of kinases inhibited by clinically approved drugs. Methods Enzymol. 548, 23–67. 10.1016/B978-0-12-397918-6.00002-1. - DOI - PubMed
    1. Sha F.; Salzman G.; Gupta A.; Koide S. (2017) Monobodies and other synthetic binding proteins for expanding protein science. Protein Sci. 26, 910–924. 10.1002/pro.3148. - DOI - PMC - PubMed
    1. Hantschel O. (2017) Monobodies as possible next-generation protein therapeutics—A perspective. Swiss Med. Wkly. 147, w14545.10.4414/smw.2017.14545. - DOI - PMC - PubMed
    1. Koide A.; Bailey C. W.; Huang X.; Koide S. (1998) The fibronectin type III domain as a scaffold for novel binding proteins. J. Mol. Biol. 284, 1141–1151. 10.1006/jmbi.1998.2238. - DOI - PubMed

Publication types