

Identification of Factors Associated With Variation in US County-Level Obesity Prevalence Rates Using Epidemiologic vs Machine Learning Models
- PMID: 31026030
- PMCID: PMC6487629
- DOI: 10.1001/jamanetworkopen.2019.2884
Identification of Factors Associated With Variation in US County-Level Obesity Prevalence Rates Using Epidemiologic vs Machine Learning Models
Abstract
Importance: Obesity is a leading cause of high health care expenditures, disability, and premature mortality. Previous studies have documented geographic disparities in obesity prevalence.
Objective: To identify county-level factors associated with obesity using traditional epidemiologic and machine learning methods.
Design, setting, and participants: Cross-sectional study using linear regression models and machine learning models to evaluate the associations between county-level obesity and county-level demographic, socioeconomic, health care, and environmental factors from summarized statistical data extracted from the 2018 Robert Wood Johnson Foundation County Health Rankings and merged with US Census data from each of 3138 US counties. The explanatory power of the linear multivariate regression and the top performing machine learning model were compared using mean R2 measured in 30-fold cross validation.
Exposures: County-level demographic factors (population; rural status; census region; and race/ethnicity, sex, and age composition), socioeconomic factors (median income, unemployment rate, and percentage of population with some college education), health care factors (rate of uninsured adults and primary care physicians), and environmental factors (access to healthy foods and access to exercise opportunities).
Main outcomes and measures: County-level obesity prevalence in 2018, its association with each county-level factor, and the percentage of variation in county-level obesity prevalence explained by linear multivariate and gradient boosting machine regression measured with R2.
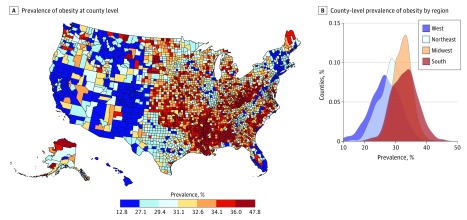
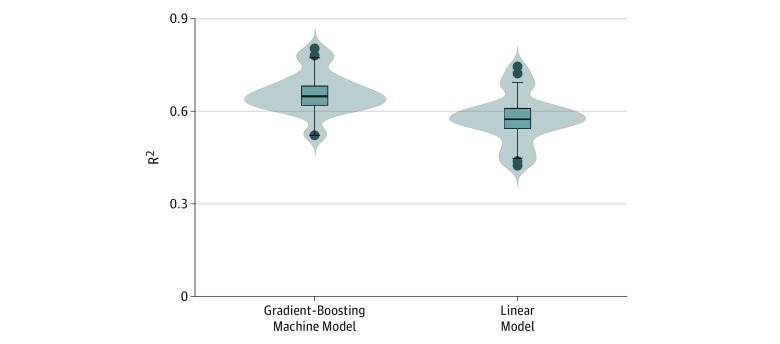
Results: Among the 3138 counties studied, the mean (range) obesity prevalence was 31.5% (12.8%-47.8%). In multivariate regressions, demographic factors explained 44.9% of variation in obesity prevalence; socioeconomic factors, 33.0%; environmental factors, 15.5%; and health care factors, 9.1%. The county-level factors with the strongest association with obesity were census region, median household income, and percentage of population with some college education. R2 values of univariate regressions of obesity prevalence were 0.238 for census region, 0.218 for median household income, and 0.160 for percentage of population with some college education. Multivariate linear regression and gradient boosting machine regression (the best-performing machine learning model) of obesity prevalence using all county-level demographic, socioeconomic, health care, and environmental factors had R2 values of 0.58 and 0.66, respectively (P < .001).
Conclusions and relevance: Obesity prevalence varies significantly between counties. County-level demographic, socioeconomic, health care, and environmental factors explain the majority of variation in county-level obesity prevalence. Using machine learning models may explain significantly more of the variation in obesity prevalence..
Conflict of interest statement
Figures
References
Publication types
MeSH terms
Grants and funding
LinkOut - more resources
Full Text Sources
Medical
