Comparative Study
. 2019 Apr 26;62(4S):1099-1116.
doi: 10.1044/2018_JSLHR-H-ASCC7-18-0076.

Age Effects on Neural Representation and Perception of Silence Duration Cues in Speech

Affiliations
Comparative Study

Age Effects on Neural Representation and Perception of Silence Duration Cues in Speech

Lindsey Roque et al. J Speech Lang Hear Res. .

Abstract

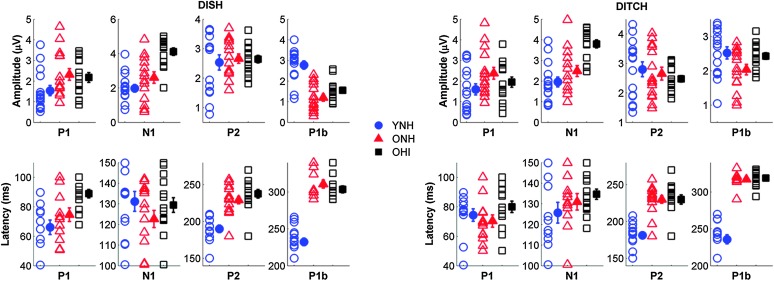
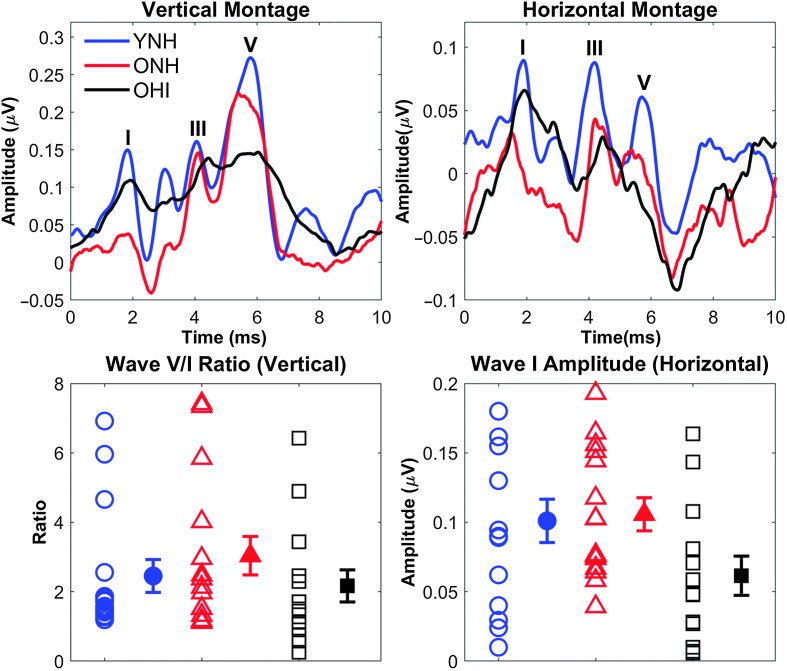
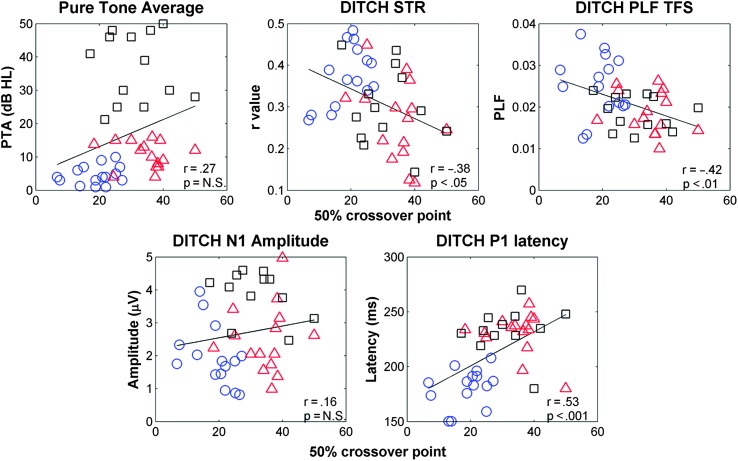
Purpose Degraded temporal processing associated with aging may be a contributing factor to older adults' hearing difficulties, especially in adverse listening environments. This degraded processing may affect the ability to distinguish between words based on temporal duration cues. The current study investigates the effects of aging and hearing loss on cortical and subcortical representation of temporal speech components and on the perception of silent interval duration cues in speech. Method Identification functions for the words DISH and DITCH were obtained on a 7-step continuum of silence duration (0-60 ms) prior to the final fricative in participants who are younger with normal hearing (YNH), older with normal hearing (ONH), and older with hearing impairment (OHI). Frequency-following responses and cortical auditory-evoked potentials were recorded to the 2 end points of the continuum. Auditory brainstem responses to clicks were obtained to verify neural integrity and to compare group differences in auditory nerve function. A multiple linear regression analysis was conducted to determine the peripheral or central factors that contributed to perceptual performance. Results ONH and OHI participants required longer silence durations to identify DITCH than did YNH participants. Frequency-following responses showed reduced phase locking and poorer morphology, and cortical auditory-evoked potentials showed prolonged latencies in ONH and OHI participants compared with YNH participants. No group differences were noted for auditory brainstem response Wave I amplitude or Wave V/I ratio. After accounting for the possible effects of hearing loss, linear regression analysis revealed that both midbrain and cortical processing contributed to the variance in the DISH-DITCH perceptual identification functions. Conclusions These results suggest that age-related deficits in the ability to encode silence duration cues may be a contributing factor in degraded speech perception. In particular, degraded response morphology relates to performance on perceptual tasks based on silence duration contrasts between words.


Figures

Figure 1.
Figure 1.
Mean audiometric thresholds of younger listeners with normal hearing (YNH; blue), older listeners with normal hearing (ONH; red), and older listeners with hearing impairment (OHI; black). Participants with normal hearing have clinically normal hearing (pure-tone thresholds ≤ 25 dB HL at octave frequencies from 125 to 4000 Hz). Participants with hearing impairment have pure-tone averages of ≥ 25 dB HL for octave frequencies from 500 to 4000 Hz. Error bars indicate ±1 SD. Shaded areas indicate ± minimum/maximum thresholds.
Figure 2.
Figure 2.
Average identification functions for percentage of trials identified as DISH as a function of silence duration for the three participant groups. Older participants with normal hearing (ONH) and hearing loss (OHI) required longer silence durations to discriminate DISH–DITCH than did younger participants (YNH). Error bars indicate ± 1 SE.
Figure 3.
Figure 3.
Spectra (A) and waveforms (B) for DISH (0-ms silence duration; left column) and DITCH (60-ms silence duration; right column) stimuli. (C) Average response waveforms in the time domain to DISH and DITCH for younger listeners with normal hearing (YNH; blue), older listeners with normal hearing (ONH; red), and older listeners with hearing impairment (OHI; black). The periodicity of the stimuli, representing the 9.1-ms period of the 110-Hz F0, is mirrored in the average response waveforms. No group differences were observed to the speech token DISH. Younger listeners, however, demonstrated better approximations to the stimulus waveform for DITCH than did either group of older listeners. (D) Individual (open symbol) and group average (closed symbol) stimulus-to-response correlation r values displayed for DISH and DITCH. Error bars indicate ± 1 SE.
Figure 4.
Figure 4.
A: Average phase-locking factor (PLF) to the temporal envelope (ENV) of DISH and DITCH stimuli represented in the time-frequency domain, with hotter (red) colors indicating increased PLF. B: Individual (open symbol) and group average (closed symbol) PLF to 110 Hz (F0) of the stimulus in time region corresponding to the vowel /ɪ/ (50–190 ms). No group differences were noted for either word. Error bars indicate ± 1 SE. YNH = younger listeners with normal hearing; ONH = older listeners with normal hearing; OHI = older listeners with hearing impairment.
Figure 5.
Figure 5.
A: Average phase-locking factor (PLF) to the temporal fine structure (TFS) of DISH and DITCH stimuli represented in the time-frequency domain, with hotter colors (red) indicating increased PLF. B: Individual (open symbol) and group average (closed symbol) PLF to 400 Hz (F1) of the stimulus in time region corresponding to the vowel /ɪ/ (50–190 ms). Younger listeners (YNH) exhibited more robust phase locking compared with older listeners with normal hearing (ONH) and hearing loss (OHI). Error bars indicate ± 1 SE.
Figure 6.
Figure 6.
Average cortical auditory-evoked potentials obtained through the denoising source separation algorithm (DSS; top) and for single Cz electrode (bottom) for younger listeners with normal hearing (YNH; blue), older listeners with normal hearing (ONH; red), and older listeners with hearing impairment (OHI; black).
Figure 7.
Figure 7.
Top: Individual (open symbol) and group average (closed symbol) amplitude for prominent cortical peaks to DISH (left) and DITCH (right) obtained from the denoising source separation algorithm for the three participant groups. Older adults with hearing loss (OHI) exhibited increased N1 amplitudes compared with both normal hearing groups to both DISH and DITCH. Bottom: Individual (open symbol) and group average (closed symbol) latencies for prominent cortical peaks to DISH (left) and DITCH (right) obtained from the denoising source separation algorithm for the three participant groups. Older listeners with hearing loss exhibited longer P1 latencies than did younger (YNH) and older listeners with normal hearing (ONH) to DISH. N1 latencies are equivalent across groups to both speech tokens. Both groups of older listeners exhibited larger peak latencies for P2 and P1b than did younger listeners to both speech tokens. Error bars show ± 1 SE.
Figure 8.
Figure 8.
Top: Average auditory response waveforms to a 100-μs click in younger listeners with normal hearing (YNH; blue), older listeners with normal hearing (ONH; red), and older listeners with hearing impairment (OHI; black) participants using a vertical montage (left) and a derived horizontal montage (right). The major peaks are labeled as I, III, or V. Bottom: The Wave V/I ratio from the vertical montage (left) and the Wave I amplitude from the derived horizontal montage (right) are quantified. No significant group differences were found, but considerable individual variability was observed as can been seen in the large error bars. Error bars indicate ± 1 SE.
Figure 9.
Figure 9.
Scatter plots demonstrating relationships among perceptual (50% crossover point on the perceptual identification function), peripheral (PTA), and neural variables (DITCH STR, DITCH PLF TFS, DITCH N1 amplitude, and DITCH P2 latency). Significant correlations were obtained between the 50% crossover point and DITCH STR, DITCH PLF TFS, and DITCH P2 latency. PTA = pure-tone average; STR = stimulus-to-response correlation; PLF TFS = phase-locking factor to the temporal fine structure.

References

    1. American National Standard Institute. (2010). S3.6-2010, American National Standard specification for audiometers (revision of ANSI S3.6-1996, 2004). New York, NY: Author.
    1. Ananthakrishnan S., Krishnan A., & Bartlett E. (2016). Human frequency following response: Neural representation of envelope and temporal fine structure in listeners with normal hearing and sensorineural hearing loss. Ear and Hearing, 37(2), e91–e103. https://doi.org/10.1097/AUD.0000000000000247 - PMC - PubMed
    1. Anderson S., Parbery-Clark A., White-Schwoch T., & Kraus N. (2012). Aging affects neural precision of speech encoding. The Journal of Neuroscience, 32(41), 14156–14164. https://doi.org/10.1523/jneurosci.2176-12.2012 - PMC - PubMed
    1. Anderson S., Parbery-Clark A., White-Schwoch T., & Kraus N. (2013). Auditory brainstem response to complex sounds predicts self-reported speech-in-noise performance. Journal of Speech, Language, and Hearing Research, 56(1), 31–43. https://doi.org/10.1044/1092-4388(2012/12-0043) - PMC - PubMed
    1. Anderson S., White-Schwoch T., Parbery-Clark A., & Kraus N. (2013). A dynamic auditory-cognitive system supports speech-in-noise perception in older adults. Hearing Research, 300, 18–32. https://doi.org/10.1016/j.heares.2013.03.006 - PMC - PubMed

Publication types