

GPA: A Microbial Genetic Polymorphisms Assignments Tool in Metagenomic Analysis by Bayesian Estimation
- PMID: 31026578
- PMCID: PMC6520909
- DOI: 10.1016/j.gpb.2018.12.005
GPA: A Microbial Genetic Polymorphisms Assignments Tool in Metagenomic Analysis by Bayesian Estimation
Abstract
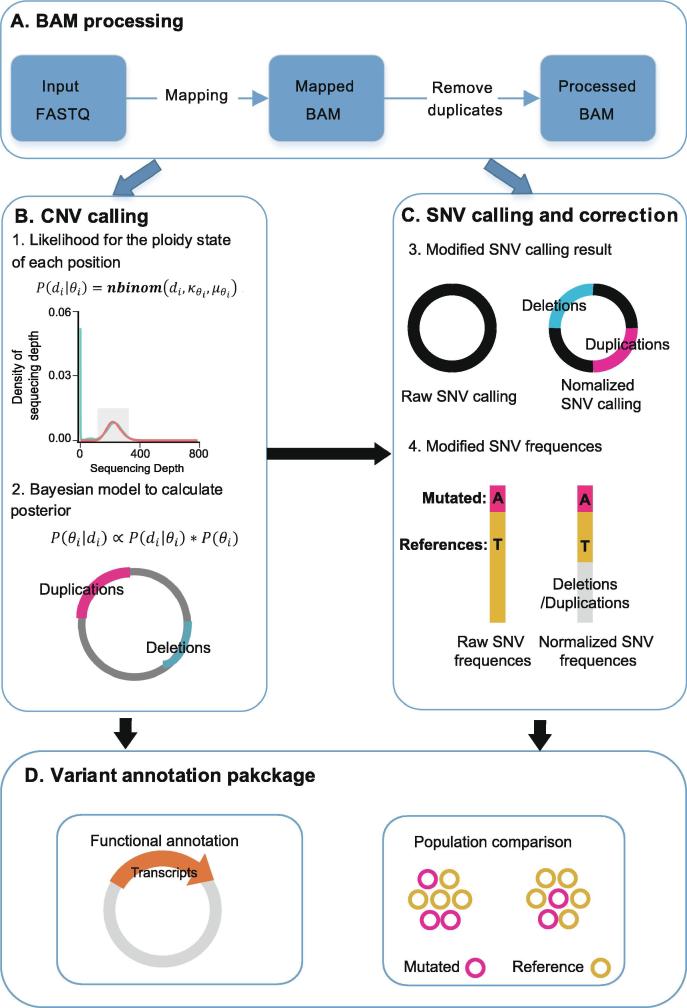
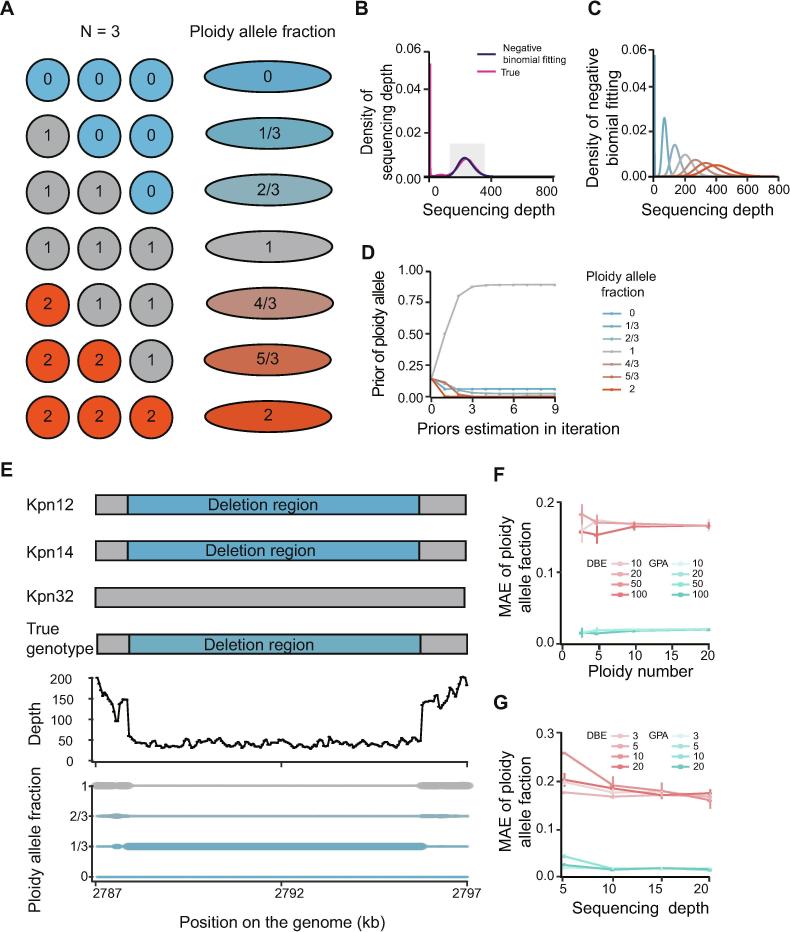
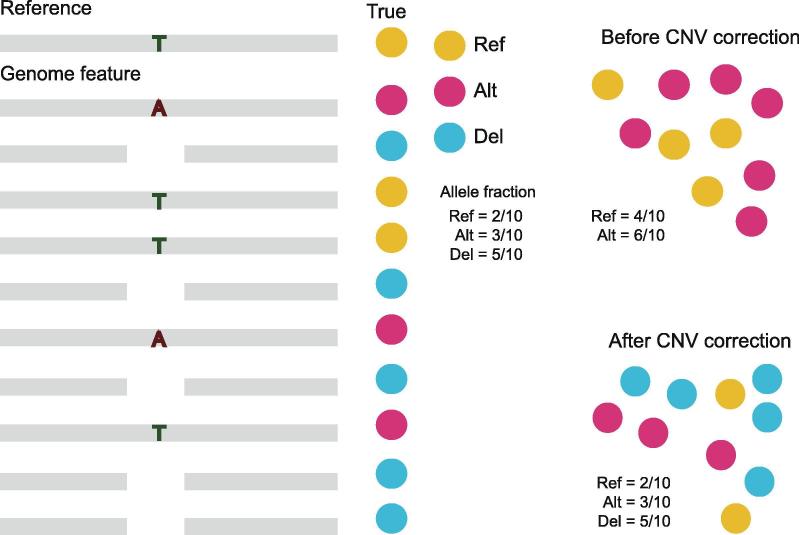
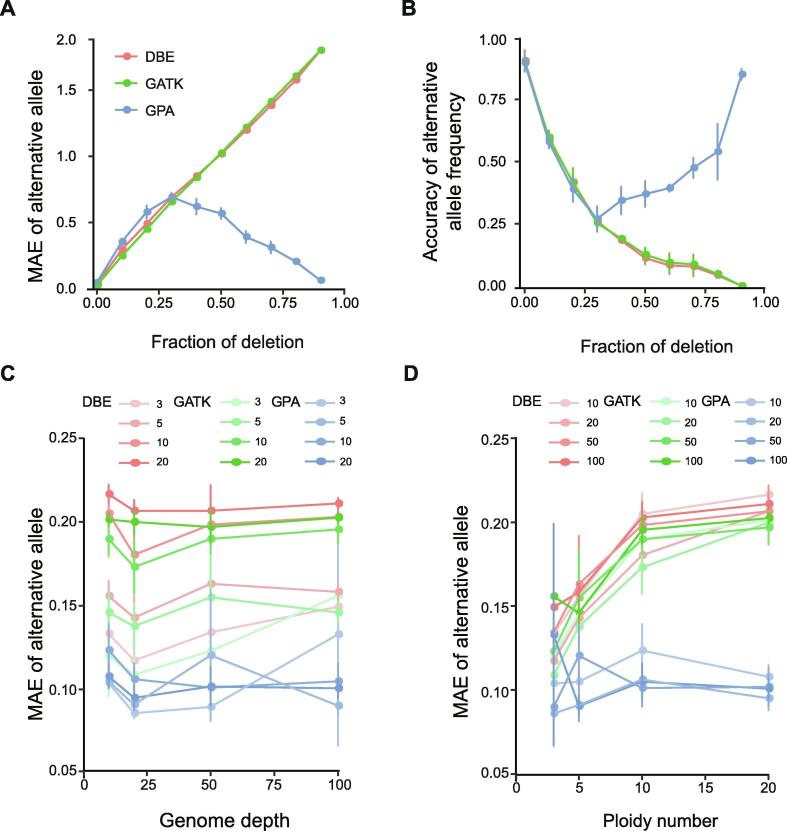
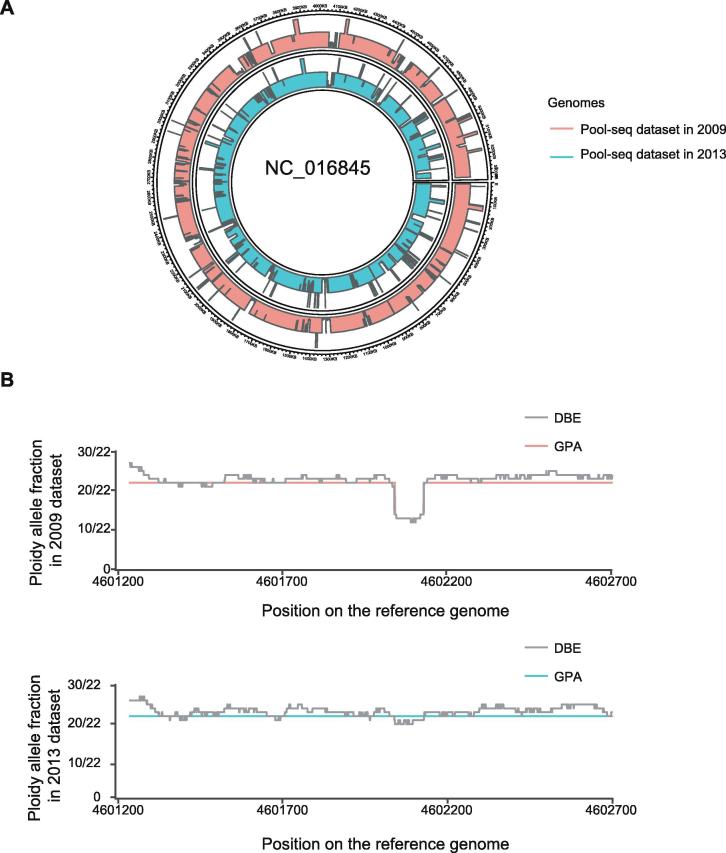
Identifying antimicrobial resistant (AMR) bacteria in metagenomics samples is essential for public health and food safety. Next-generation sequencing (NGS) technology has provided a powerful tool in identifying the genetic variation and constructing the correlations between genotype and phenotype in humans and other species. However, for complex bacterial samples, there lacks a powerful bioinformatic tool to identify genetic polymorphisms or copy number variations (CNVs) for given genes. Here we provide a Bayesian framework for genotype estimation for mixtures of multiple bacteria, named as Genetic Polymorphisms Assignments (GPA). Simulation results showed that GPA has reduced the false discovery rate (FDR) and mean absolute error (MAE) in CNV and single nucleotide variant (SNV) identification. This framework was validated by whole-genome sequencing and Pool-seq data from Klebsiella pneumoniae with multiple bacteria mixture models, and showed the high accuracy in the allele fraction detections of CNVs and SNVs in AMR genes between two populations. The quantitative study on the changes of AMR genes fraction between two samples showed a good consistency with the AMR pattern observed in the individual strains. Also, the framework together with the genome annotation and population comparison tools has been integrated into an application, which could provide a complete solution for AMR gene identification and quantification in unculturable clinical samples. The GPA package is available at https://github.com/IID-DTH/GPA-package.
Keywords: Bayesian model; Genetic polymorphisms; Metagenomics; Next-generation sequencing; Pool-seq.
Copyright © 2019 The Authors. Production and hosting by Elsevier B.V. All rights reserved.
Figures
Similar articles
-
cn.MOPS: mixture of Poissons for discovering copy number variations in next-generation sequencing data with a low false discovery rate.Nucleic Acids Res. 2012 May;40(9):e69. doi: 10.1093/nar/gks003. Epub 2012 Feb 1. Nucleic Acids Res. 2012. PMID: 22302147 Free PMC article.
-
Clinical analysis of germline copy number variation in DMD using a non-conjugate hierarchical Bayesian model.BMC Med Genomics. 2018 Oct 20;11(1):91. doi: 10.1186/s12920-018-0404-4. BMC Med Genomics. 2018. PMID: 30342520 Free PMC article.
-
Estimation of population allele frequencies from next-generation sequencing data: pool-versus individual-based genotyping.Mol Ecol. 2013 Jul;22(14):3766-79. doi: 10.1111/mec.12360. Epub 2013 Jun 4. Mol Ecol. 2013. PMID: 23730833
-
Sequencing pools of individuals - mining genome-wide polymorphism data without big funding.Nat Rev Genet. 2014 Nov;15(11):749-63. doi: 10.1038/nrg3803. Epub 2014 Sep 23. Nat Rev Genet. 2014. PMID: 25246196 Review.
-
Massive parallel sequencing in animal genetics: wherefroms and wheretos.Anim Genet. 2010 Dec;41(6):561-9. doi: 10.1111/j.1365-2052.2010.02057.x. Anim Genet. 2010. PMID: 20477787 Review.
Cited by
-
The Fast Track for Microbiome Research.Genomics Proteomics Bioinformatics. 2019 Feb;17(1):1-3. doi: 10.1016/j.gpb.2019.04.001. Epub 2019 Apr 26. Genomics Proteomics Bioinformatics. 2019. PMID: 31034986 Free PMC article. No abstract available.
-
Metagenomics for taxonomy profiling: tools and approaches.Bioengineered. 2020 Dec;11(1):356-374. doi: 10.1080/21655979.2020.1736238. Bioengineered. 2020. Retraction in: Bioengineered. 2022 Jun;13(6):14750. doi: 10.1080/21655979.2022.2126093. PMID: 32149573 Free PMC article. Retracted.
-
Deconvoluting the diversity of within-host pathogen strains in a multi-locus sequence typing framework.BMC Bioinformatics. 2019 Dec 17;20(Suppl 20):637. doi: 10.1186/s12859-019-3204-8. BMC Bioinformatics. 2019. PMID: 31842753 Free PMC article.
References
-
- Berendonk T.U., Manaia C.M., Merlin C., Fatta-Kassinos D., Cytryn E., Walsh F. Tackling antibiotic resistance: the environmental framework. Nat Rev Microbiol. 2015;13:310–317. - PubMed
-
- Jolley K.A. Multi-locus sequence typing. Methods Mol Med. 2001;67:173–186. - PubMed
-
- Suchkov I., Vodop'ianov A.S., Vodop'ianov S.O., Shishiianu M.V., Mishan'kin B.N. The multi-locus VNTR-analysis in studies of the population structure of Yersinia pestis in natural foci. Mol Gen Mikrobiol Virusol. 2004:19–28. - PubMed
-
- Schwartz D.C., Cantor C.R. Separation of yeast chromosome-sized DNAs by pulsed field gradient gel electrophoresis. Cell. 1984;37:67–75. - PubMed
-
- Burnham C.D., Leeds J., Nordmann P., O'Grady J., Patel J. Diagnosing antimicrobial resistance. Nat Rev Microbiol. 2017;15:697–703. - PubMed
Publication types
MeSH terms
LinkOut - more resources
Full Text Sources
