

Hepatitis B Surface Antigen Activates Unfolded Protein Response in Forming Ground Glass Hepatocytes of Chronic Hepatitis B
- PMID: 31027244
- PMCID: PMC6520809
- DOI: 10.3390/v11040386
Hepatitis B Surface Antigen Activates Unfolded Protein Response in Forming Ground Glass Hepatocytes of Chronic Hepatitis B
Abstract
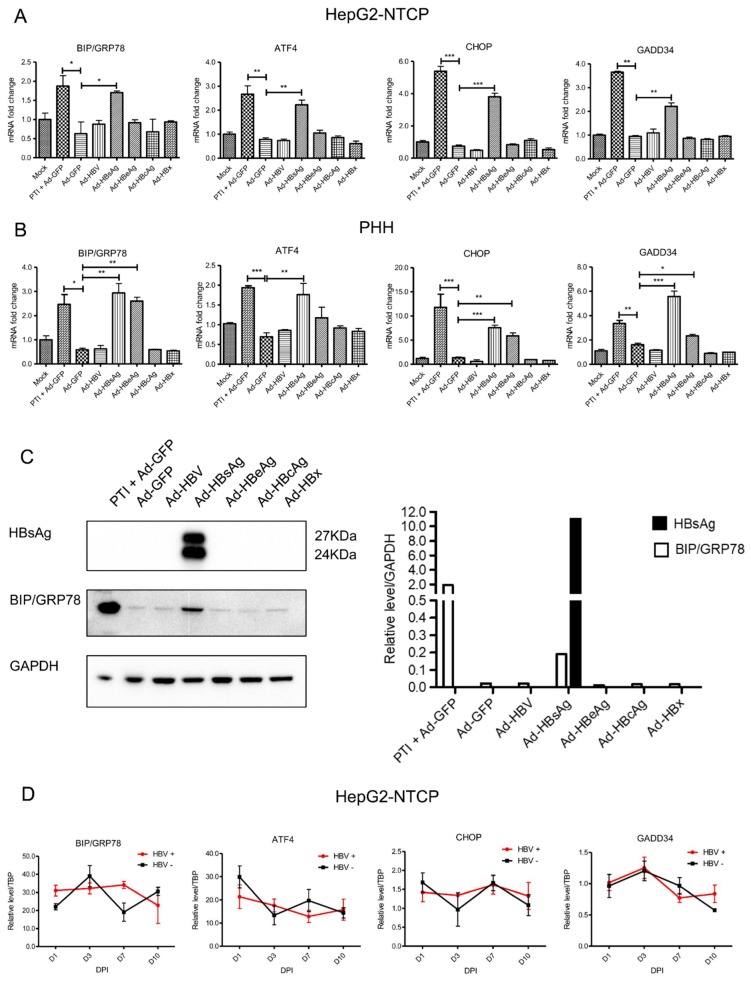
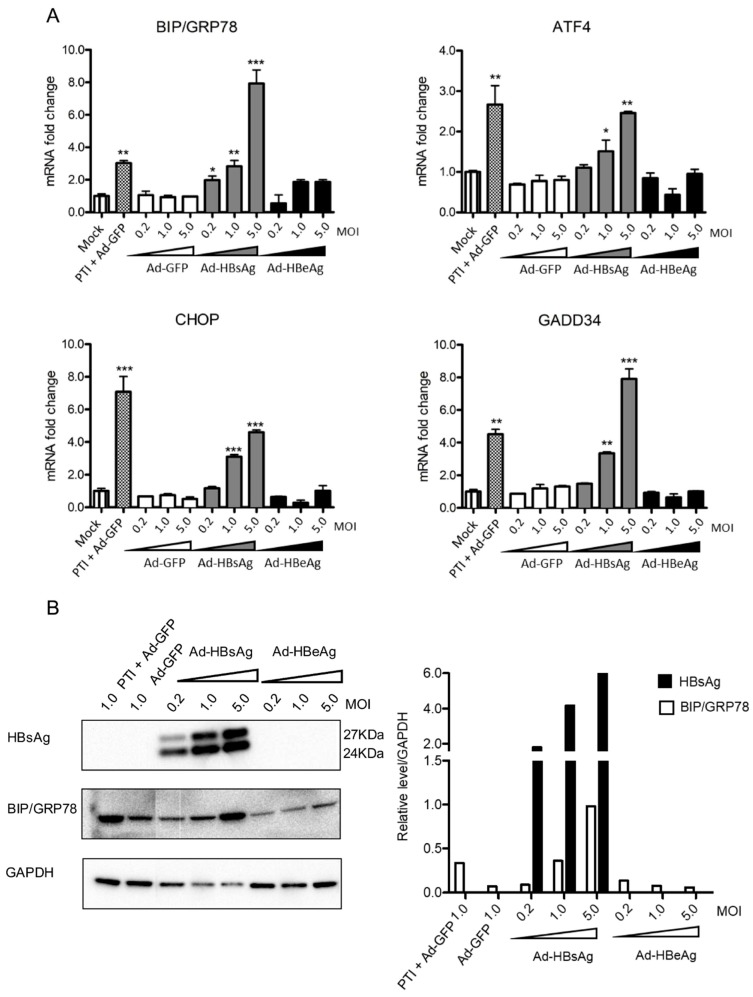
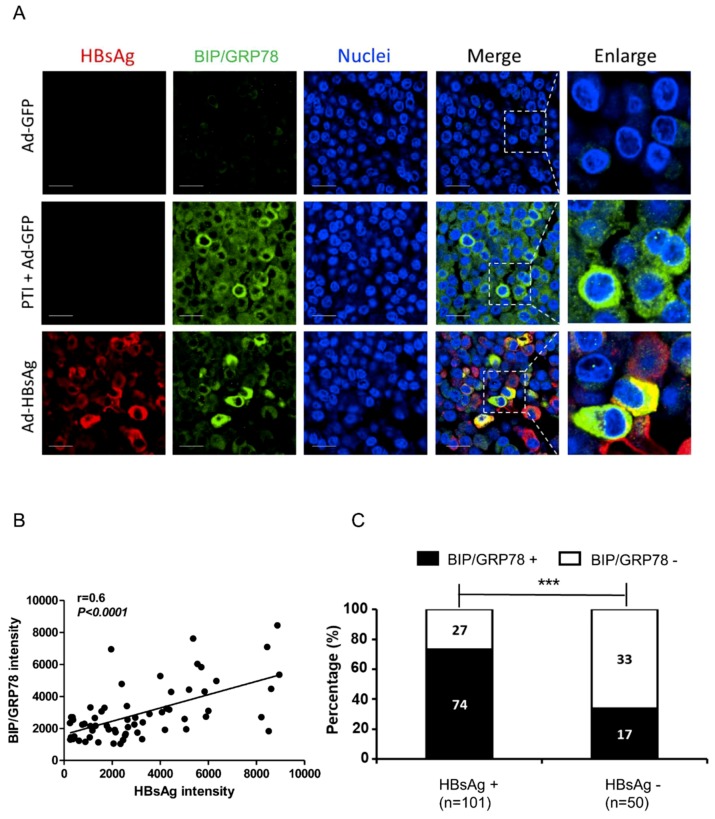
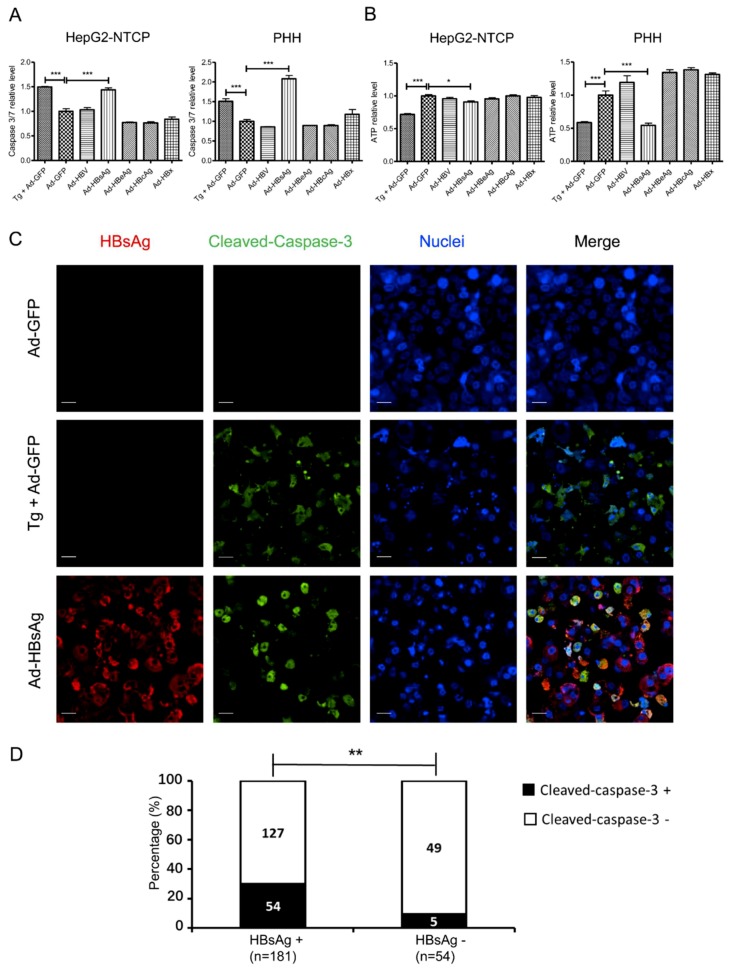
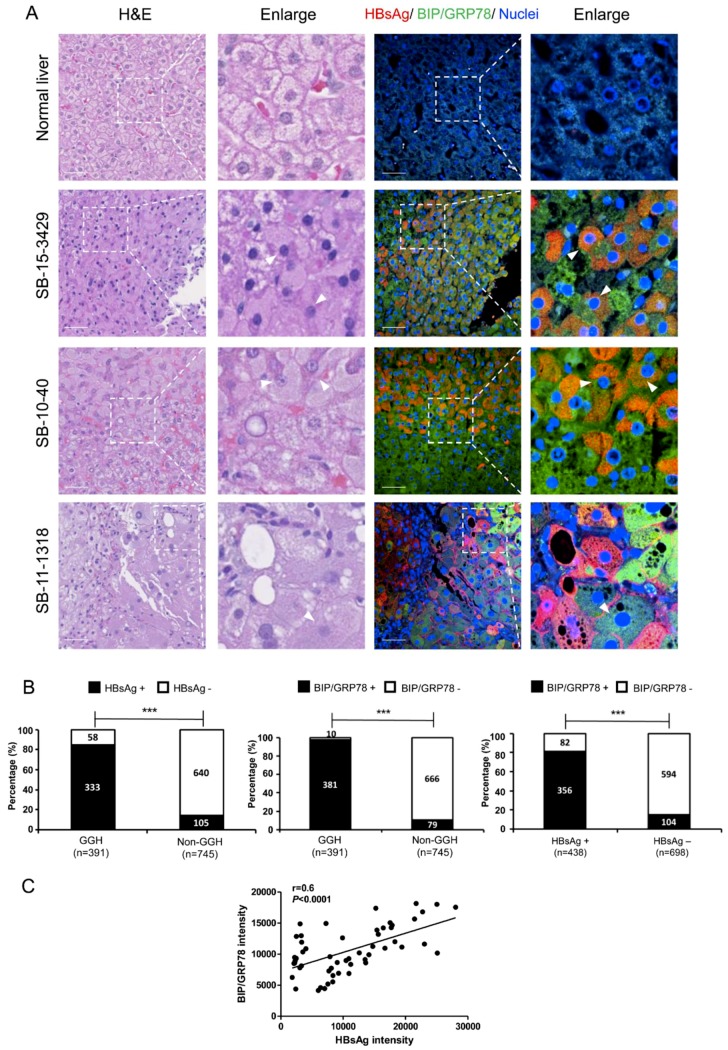
Ground glass hepatocytes (GGHs), a histological hallmark of chronic hepatitis B virus (HBV) infection, contain excessive hepatitis surface antigen (HBsAg) in the endoplasmic reticulum (ER), which is linked to unfolded protein response (UPR). The mechanism by which HBV activates UPR has not been fully defined. To investigate this, HepG2-NTCP cells and primary human hepatocytes (PHHs) were either infected with HBV or transduced with adenoviral vectors expressing replication-competent HBV genome or individual HBV genes. UPR markers were evaluated by qPCR, Western blotting, and immunofluorescence. Apoptosis and cell viability were measured by Caspase-3/7 and ATPlite assay respectively. We found that UPR markers were induced by the overexpression of HBsAg in HepG2-NTCP cells and PHHs. Elevation of UPR-induced genes showed a dose-dependent correlation with HBsAg levels. In HBV-infected livers, GGHs also demonstrated excessive accumulation of HBsAg associated with increased BIP/GRP78 staining, a marker of UPR. Prolonged activation of UPR by HBsAg overexpression induced signs of apoptosis. Overexpression of HBsAg can induce ER stress through protein kinase RNA-like endoplasmic reticulum kinase (PERK) pathway in vitro, and may be linked to the appearance of GGHs. The activation of UPR by HBsAg may sensitize hepatocytes to cell death and result in possible subsequent cellular changes leading to a premalignant phenotype.
Keywords: apoptosis; chronic hepatitis B; endoplasmic reticulum stress; ground glass hepatocyte; hepatocellular carcinoma; liver disease.
Conflict of interest statement
The authors declare no conflict of interest.
Figures
Similar articles
-
Interferon signaling suppresses the unfolded protein response and induces cell death in hepatocytes accumulating hepatitis B surface antigen.PLoS Pathog. 2021 May 12;17(5):e1009228. doi: 10.1371/journal.ppat.1009228. eCollection 2021 May. PLoS Pathog. 2021. PMID: 33979382 Free PMC article.
-
Pre-S mutant surface antigens in chronic hepatitis B virus infection induce oxidative stress and DNA damage.Carcinogenesis. 2004 Oct;25(10):2023-32. doi: 10.1093/carcin/bgh207. Epub 2004 Jun 3. Carcinogenesis. 2004. PMID: 15180947
-
Intrahepatic hepatitis B virus large surface antigen induces hepatocyte hyperploidy via failure of cytokinesis.J Pathol. 2018 Aug;245(4):502-513. doi: 10.1002/path.5102. Epub 2018 Jul 4. J Pathol. 2018. PMID: 29862509
-
Naturally Occurring Hepatitis B Virus Mutations Leading to Endoplasmic Reticulum Stress and Their Contribution to the Progression of Hepatocellular Carcinoma.Int J Mol Sci. 2019 Jan 30;20(3):597. doi: 10.3390/ijms20030597. Int J Mol Sci. 2019. PMID: 30704071 Free PMC article. Review.
-
Hepatocellular carcinoma and hepatitis B surface protein.World J Gastroenterol. 2016 Feb 14;22(6):1943-52. doi: 10.3748/wjg.v22.i6.1943. World J Gastroenterol. 2016. PMID: 26877602 Free PMC article. Review.
Cited by
-
HBV-Integration Studies in the Clinic: Role in the Natural History of Infection.Viruses. 2021 Feb 26;13(3):368. doi: 10.3390/v13030368. Viruses. 2021. PMID: 33652619 Free PMC article. Review.
-
Biological Characterization of Hepatitis B virus Genotypes: Their Role in Viral Replication and Antigen Expression.Front Microbiol. 2021 Nov 4;12:758613. doi: 10.3389/fmicb.2021.758613. eCollection 2021. Front Microbiol. 2021. PMID: 34803982 Free PMC article.
-
State of the art treatment of hepatitis B virus hepatocellular carcinoma and the role of hepatitis B surface antigen post-liver transplantation and resection.Liver Int. 2022 Feb;42(2):288-298. doi: 10.1111/liv.15124. Epub 2021 Dec 20. Liver Int. 2022. PMID: 34846790 Free PMC article. Review.
-
HERV1-env Induces Unfolded Protein Response Activation in Autoimmune Liver Disease: A Potential Mechanism for Regulatory T Cell Dysfunction.J Immunol. 2023 Mar 15;210(6):732-744. doi: 10.4049/jimmunol.2100186. J Immunol. 2023. PMID: 36722941 Free PMC article.
-
Molecular Mechanisms during Hepatitis B Infection and the Effects of the Virus Variability.Viruses. 2021 Jun 18;13(6):1167. doi: 10.3390/v13061167. Viruses. 2021. PMID: 34207116 Free PMC article. Review.
References
-
- Cohen C. Ground-glass hepatocytes. S. Afr. Med. J. 1975;49:1401–1403. - PubMed
-
- Su I.J., Lai M.Y., Hsu H.C., Chen D.S., Yang P.M., Chuang S.M., Sung J.L. Diverse virological, histopathological and prognostic implications of seroconversion from hepatitis B e antigen to anti-HBe in chronic hepatitis B virus infection. J. Hepatol. 1986;3:182–189. doi: 10.1016/S0168-8278(86)80024-1. - DOI - PubMed
-
- Wang H.C., Wu H.C., Chen C.F., Fausto N., Lei H.Y., Su I.J. Different types of ground glass hepatocytes in chronic hepatitis B virus infection contain specific pre-S mutants that may induce endoplasmic reticulum stress. Am. J. Pathol. 2003;163:2441–2449. doi: 10.1016/S0002-9440(10)63599-7. - DOI - PMC - PubMed
Publication types
MeSH terms
Substances
LinkOut - more resources
Full Text Sources
Other Literature Sources
Molecular Biology Databases
Research Materials
Miscellaneous
