. 2019 Apr 26;7(1):68.
doi: 10.1186/s40168-019-0683-9.

Alterations in the gut microbiome and metabolism with coronary artery disease severity

Affiliations

Alterations in the gut microbiome and metabolism with coronary artery disease severity

Honghong Liu et al. Microbiome. .

Abstract

Background: Coronary artery disease (CAD) is associated with gut microbiota alterations in different populations. Gut microbe-derived metabolites have been proposed as markers of major adverse cardiac events. However, the relationship between the gut microbiome and the different stages of CAD pathophysiology remains to be established by a systematic study.

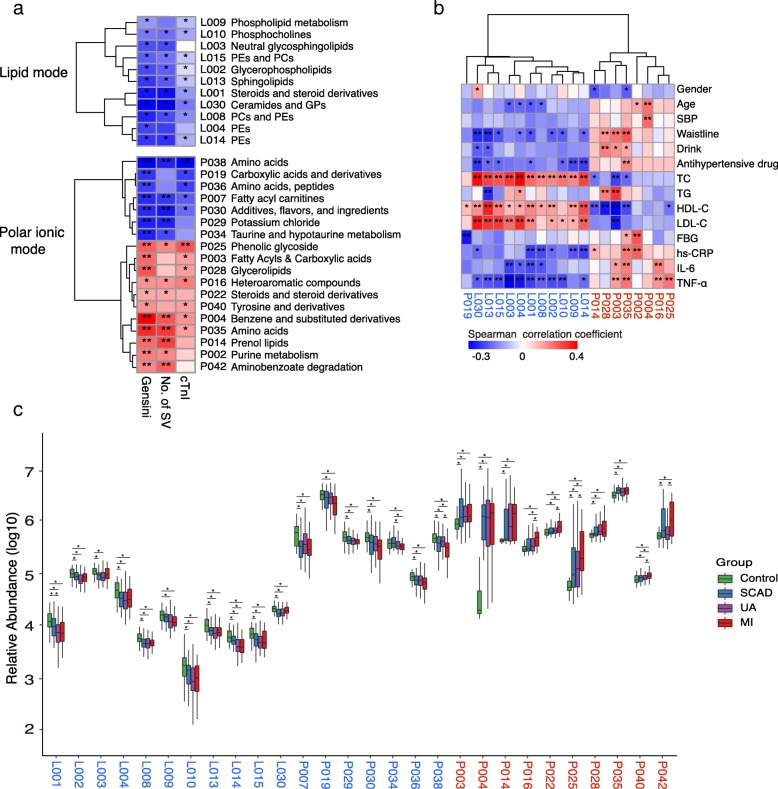
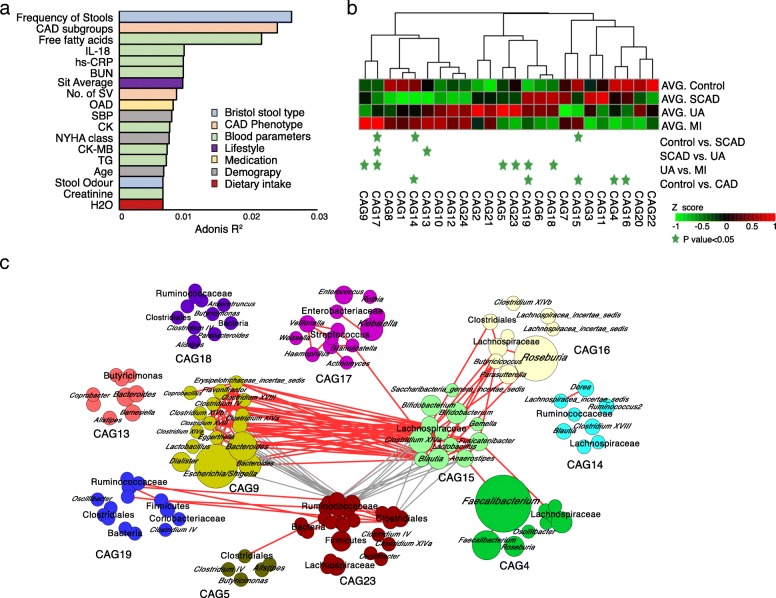
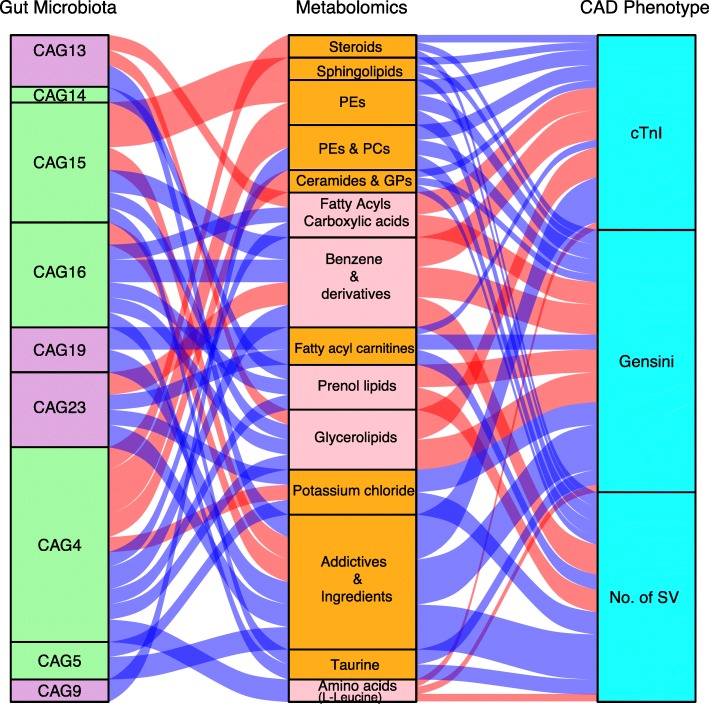
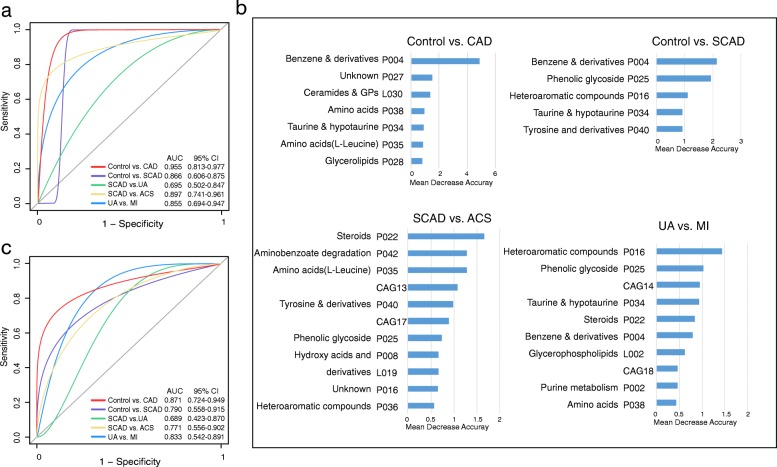
Results: Based on multi-omic analyses (sequencing of the V3-V4 regions of the 16S rRNA gene and metabolomics) of 161 CAD patients and 40 healthy controls, we found that the composition of both the gut microbiota and metabolites changed significantly with CAD severity. We identified 29 metabolite modules that were separately classified as being positively or negatively correlated with CAD phenotypes, and the bacterial co-abundance group (CAG) with characteristic changes at different stages of CAD was represented by Roseburia, Klebsiella, Clostridium IV and Ruminococcaceae. The result revealed that certain bacteria might affect atherosclerosis by modulating the metabolic pathways of the host, such as taurine, sphingolipid and ceramide, and benzene metabolism. Moreover, a disease classifier based on differential levels of microbes and metabolites was constructed to discriminate cases from controls and was even able to distinguish stable coronary artery disease from acute coronary syndrome accurately.

Conclusion: Overall, the composition and functions of the gut microbial community differed from healthy controls to diverse coronary artery disease subtypes. Our study identified the relationships between the features of the gut microbiota and circulating metabolites, providing a new direction for future studies aiming to understand the host-gut microbiota interplay in atherosclerotic pathogenesis.

Keywords: Atherosclerosis; Coronary artery disease; Diagnostic marker; Metabolomics; Microbiome; Multi-omics analysis.


Conflict of interest statement

Ethics approval and consent to participate

The study was approved by local ethics committees (JS-1195, Peking Union Medical College Hospital, Beijing), and informed consent was obtained from all subjects.

Consent for publication

Not applicable.

Competing interests

The authors declare that they have no competing interests.

Publisher’s Note

Springer Nature remains neutral with regard to jurisdictional claims in published maps and institutional affiliations.

Figures

Fig. 1
Fig. 1
Identification of the major serum metabolite modules associated with the onset and development of CAD. a Spearman correlations between serum metabolite modules and major CAD phenotypes. b Spearman correlations between serum metabolite modules and major CAD risk factor indicators. c The box plot shows that the serum metabolite modules significantly changed between different groups according to the Wilcoxon rank sum test. The names of the metabolite clusters comprising the CAD-positive and CAD-negative metabotypes are highlighted in red and blue, respectively. In a and b, the colour represents positive (red) or negative (blue) correlations, and FDRs are denoted as follows: *FDR < 0.05, **FDR < 0.01. In c, the asterisk represents P values < 0.05 by the Wilcoxon rank sum test, boxes represent the inter-quartile ranges, and lines inside the boxes denote medians. PE phosphatidylethanolamine, PC phosphatidylcholine, GP glycerophospholipids, SBP systolic blood pressure, TC total cholesterol, TG triglyceride, HDL-C high-density lipoprotein cholesterol, LDL-C low-density lipoprotein cholesterol, FBG fasting blood glucose, hs-CRP high-sensitivity C-reactive protein, IL-6 interleukin 6, TNF-α tumour necrosis factor-α
Fig. 2
Fig. 2
Identification of the important co-abundance groups that were strikingly different across CAD groups. a Bar plot illustrating the top host factors that were found to be significantly associated with gut microbial variations. The variations were derived from between-sample unweighted UniFrac distances. The bars were coloured according to metadata categories. Size effects and statistical significance were calculated by PERMANOVA (Adonis). The P value was controlled at 0.1. b Relative abundances of the 24 co-abundance groups (CAGs) across different CAD subgroups. The abundance profiles were transformed into Z scores by subtracting the average abundances and dividing the standard deviations of all the samples. The Z score was negative (shown in green) when the row abundance was lower than the mean. CAGs at P values <0.05, as determined by the Wilcoxon rank sum test, are marked with green stars. c OTU-level network diagram showing the enrichments of OTUs in the different groups based on significantly changed CAGs. Node size indicates the mean abundance of each OTU. The bacteria denoted on the nodes were of the lowest classification status that could be clearly identified using the RDP classifier. Lines between nodes represent correlations between the nodes connected by the lines, with line width indicating correlation magnitude, red representing positive correlation, and grey representing negative correlation. Only lines corresponding to correlations with magnitudes greater than 0.4 were drawn. IL-18 interleukin 18, BUN blood urea nitrogen, hs-CRP high-sensitivity C-reactive protein, OAD Oral antidiabetic drugs, SBP systolic blood pressure, CK creatine kinase, NYHA class New York Heart Association classification, TG triglyceride
Fig. 3
Fig. 3
Interrelationship between gut microbiota composition, host metabolic profile and main CAD phenotype. Visualization of the correlation network according to Spearman correlation analysis between the gut microbiota of significant CAGs and the parameters represented CAD severity was mediated by serum metabolites. Red connections indicate a positive correlation (Spearman correlation test, FDR < 0.05), while blue connections show correlations that were negative (Spearman correlation test, FDR < 0.05). In the gut microbiota column, the green stratum represents CAGs that were highly enriched in the control group, and the stratum coloured in purple was increased in the more severe group among the subgroup’s comparisons. In the metabolomics column, the orange stratum represents CAD-negative metabotypes, and the pink stratum represents CAD-positive metabotypes. CAG co-abundance group, PE phosphatidylethanolamine, PC phosphatidylcholine, GP glycerophospholipids, No. of SV number of stenosed vessels, cTnI troponin I
Fig. 4
Fig. 4
Diagnostic outcomes are shown via receiver operating characteristic (ROC) curves for CAD severity. a ROC of the random forest classifier using CAG + serum metabolite modules based on the most important variables by ranking the variables by importance in the discovery phase among 201 subjects. b The detailed explanatory variables based on the random forest model in each comparison. The lengths of the bars in the histogram represent the mean decrease accuracy, which indicates the importance of the CAG or metabolite module for classification. c ROC of the cross-validated random forest classifier using the most important explanatory variables in the validation cohort. GP glycerophospholipids

References

    1. Benjamin EJ, et al. Heart Disease and Stroke Statistics-2018 Update: A Report From the American Heart Association.Circulation. 2018;137(12):e67-e492. - PubMed
    1. Piepoli MF, et al. 2016 European guidelines on cardiovascular disease prevention in clinical practice. Kardiol Pol. 2016;74(9):821–936. - PubMed
    1. Ford TJ, Corcoran D, Berry C. Stable coronary syndromes: pathophysiology, diagnostic advances and therapeutic need. Heart. 2018;104(4):284–292. - PMC - PubMed
    1. Braunwald E, Morrow DA. Unstable angina: is it time for a requiem? Circulation. 2013;127(24):2452–2457. - PubMed
    1. Thygesen K, et al. Fourth universal definition of myocardial infarction (2018) Eur Heart J. 2019;40(3):237–269. - PubMed

Publication types