. 2019 May 21;50(5):1262-1275.e4.
doi: 10.1016/j.immuni.2019.03.023. Epub 2019 Apr 23.

Mechanical Skin Injury Promotes Food Anaphylaxis by Driving Intestinal Mast Cell Expansion

Affiliations

Mechanical Skin Injury Promotes Food Anaphylaxis by Driving Intestinal Mast Cell Expansion

Juan-Manuel Leyva-Castillo et al. Immunity. .

Abstract

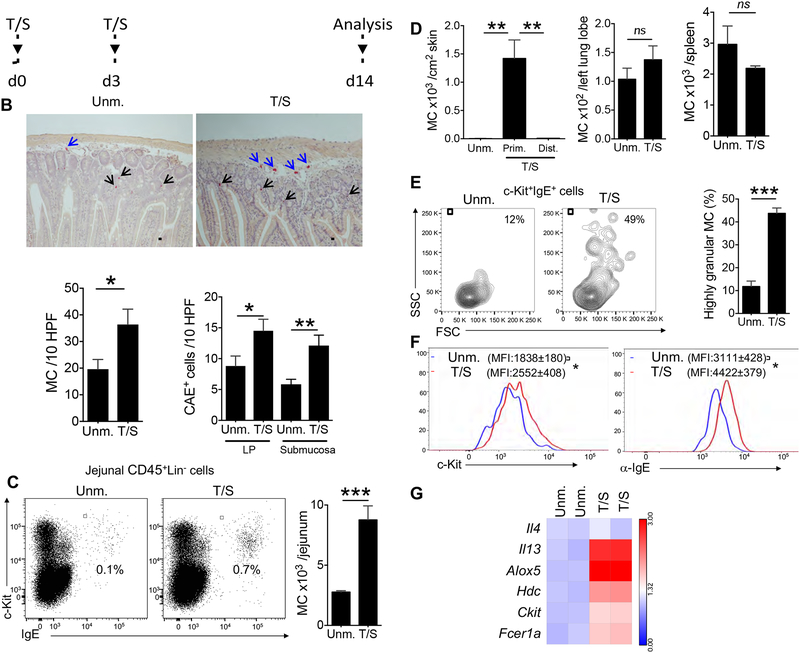
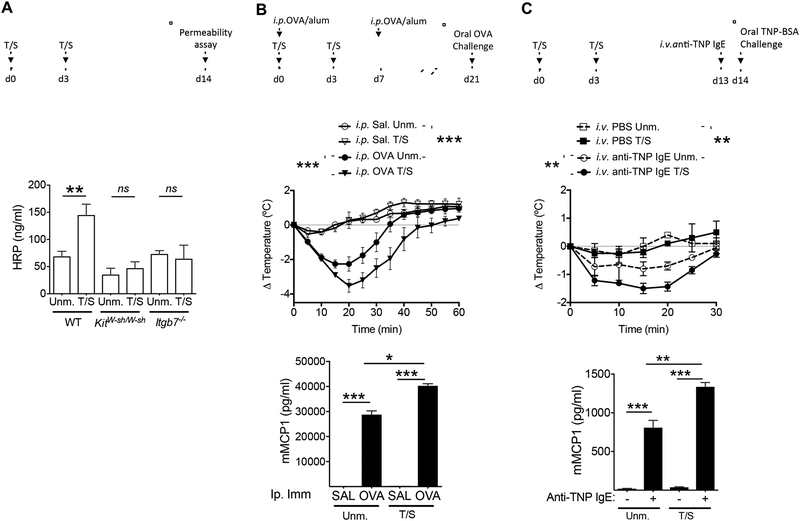
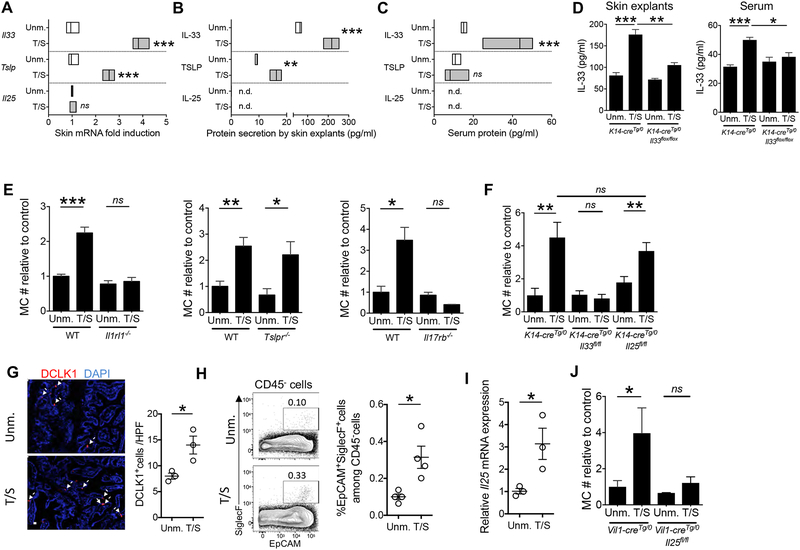
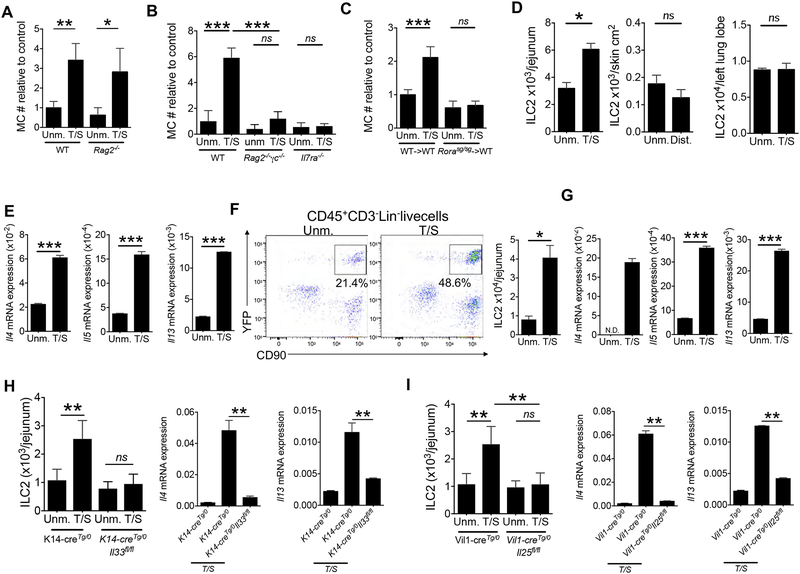
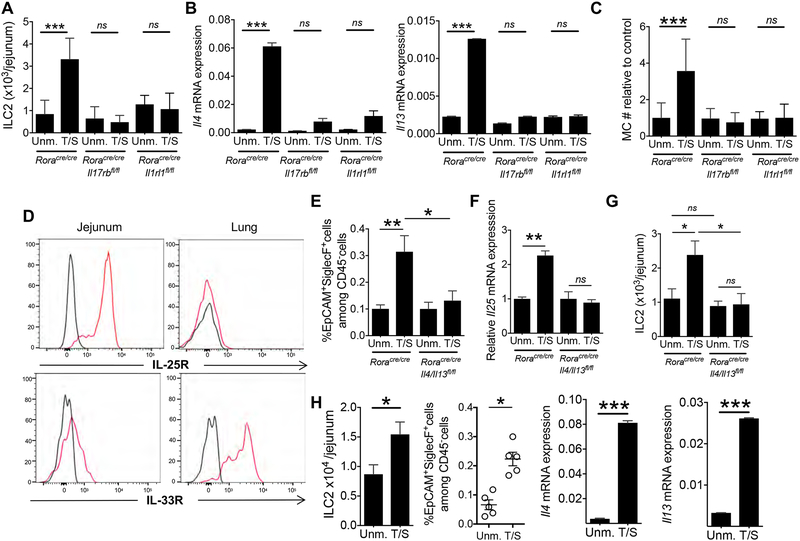
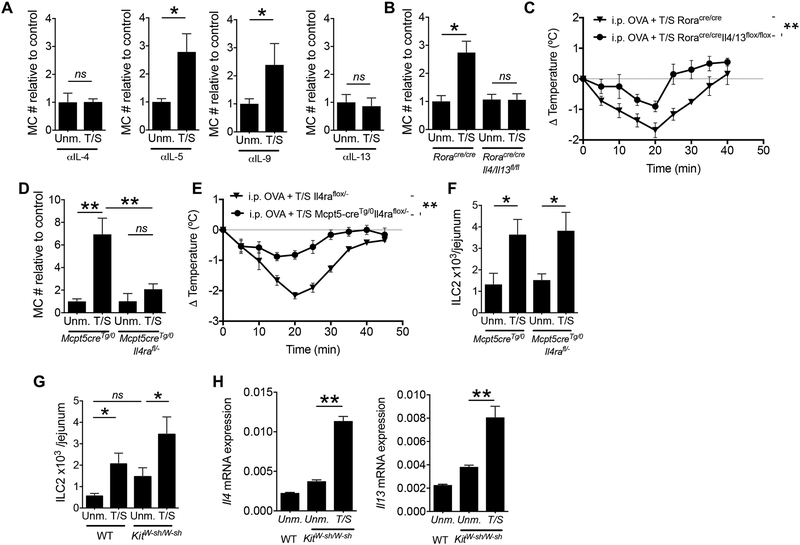
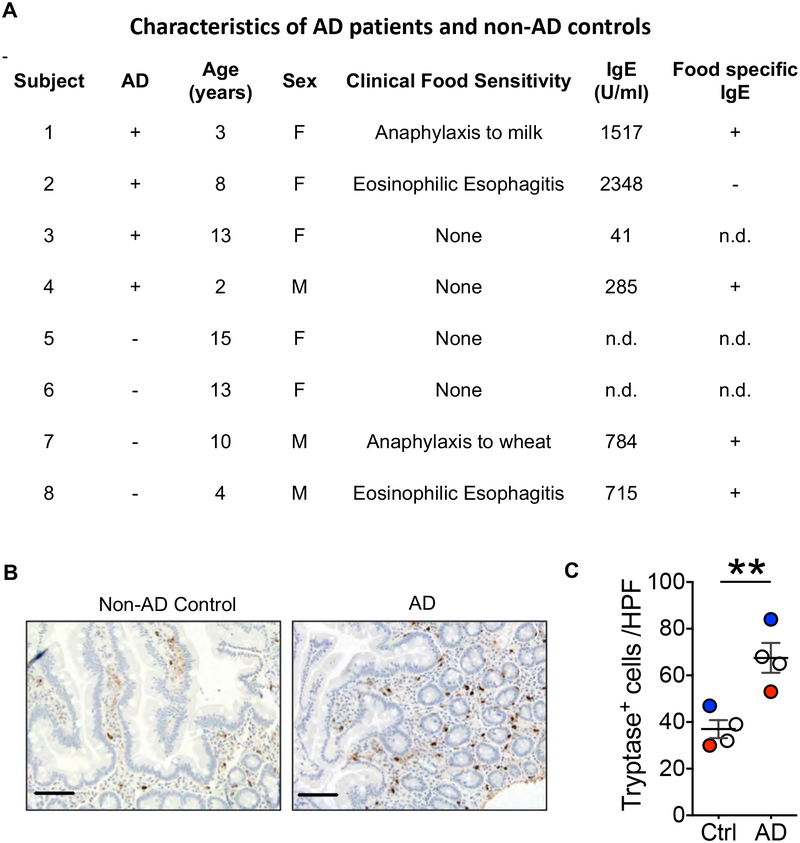
Mast cell (MC) mediator release after crosslinking of surface-bound IgE antibody by ingested antigen underlies food allergy. However, IgE antibodies are not uniformly associated with food allergy, and intestinal MC load is an important determinant. Atopic dermatitis (AD), characterized by pruritis and cutaneous sensitization to allergens, including foods, is strongly associated with food allergy. Tape stripping mouse skin, a surrogate for scratching, caused expansion and activation of small intestinal MCs, increased intestinal permeability, and promoted food anaphylaxis in sensitized mice. Tape stripping caused keratinocytes to systemically release interleukin-33 (IL-33), which synergized with intestinal tuft-cell-derived IL-25 to drive the expansion and activation of intestinal type-2 innate lymphoid cells (ILC2s). These provided IL-4, which targeted MCs to expand in the intestine. Duodenal MCs were expanded in AD. In addition to promoting cutaneous sensitization to foods, scratching may promote food anaphylaxis in AD by expanding and activating intestinal MCs.

Keywords: ILC2s; food allergy; gut; innate immunity; mast cells; skin.


Conflict of interest statement

DECLARATION OF INTERESTS.

The authors declare no competing interests.

Figures

Figure 1.
Figure 1.. Tape stripping mouse skin causes expansion of mast cells (MC) in the small intestine.
A. Experimental protocol. BALB/C mouse skin was tape stripped (T/S) 6 times on Day 0 and 3 times on Day 3 using Tegaderm; mice were analyzed on Day 14. B. Representative CAE staining of jejunal sections, with scale bars representing 100 μM (top), and quantitation of MC numbers per 10 HPF in jejunum (bottom left) and jejunal LP and submucosa (bottom right) of T/S mice and unmanipulated (Unm.) controls. Results are derived from 2 independent experiments each with 3 to 5 mice/group. C. Representative flow cytometry analysis of c-kit+IgE+ MCs in the CD45+Lin fraction of jejunal LP cells from T/S mice and Unm. controls (left), and absolute numbers of jejunal CD45+Linc-kit+IgE+ MCs (right). Results are derived from 2 independent experiments each with 4 mice/group. D. Numbers of CD45+Linc-kit+IgE+ MCs in primary (Prim.) skin sites subjected to tape stripping, distant (Dist.) skin site (left) lungs (middle) and spleen (right) of T/S mice and Unm. controls. Data is representative of 2 independent experiments each with 3 to 4 mice/group. E. Representative flow cytometry analysis of the granularity (side scatter) and size (forward scatter) of CD45+Linc-kit+IgE+ MCs (left) and percentage of SSChighc-kit+IgE+ MCs (right) in the jejunum of T/S mice and Unm. controls. Results are derived from 2 independent experiments each with 4 mice/group. F. Representative flow cytometry analysis of surface expression of c-KIT or CD117 (left) and FcεR1 detected as IgE binding (right) by CD45+Linc-kit+IgE+ MCs from the lamina propria (LP) of T/S mice and Unm. controls. Results are representative of 2 independent experiments each with 4 mice/group. G. qPCR analysis of mRNA expression of select genes by CD45+Linc-kit+IgE+ MCs sorted from the LP of T/S mice and Unm. controls. expressed relative to the mean of Unm. controls. The lanes correspond to the groups from 2 different experiments in which MCs were pooled from 4–5 mice/group. Columns and bars in B-E represent SEM. ** = p<0.01, *** = p< 0.001, ns: not significant Please see also Figure S1.
Figure 2.
Figure 2.. Tape stripping of the skin increases intestinal permeability and promotes anaphylaxis to oral antigen challenge.
A. Effect of tape stripping (T/S) the skin on intestinal permeability. Upper panel: Experimental protocol. Lower panel: Serum HRP concentrations in T/S and Unm. WT, KitW-sh/W-sh and Itgb7−/− mice. Results are derived from 3 independent experiments each with 4 to 5 mice/group. B. Effect of tape stripping the skin on food anaphylaxis in i.p. immunized T/S and Unm. WT mice. Upper panel: Experimental protocol. Middle panel: Change in core body temperature following oral OVA challenge. Lower panel: serum mMCPT1 concentrations. Data are representative of 2 independent experiments, each with 4 to 5 mice/group. C. Effect of tape stripping the skin on food anaphylaxis in T/S and Unm. mice passively sensitized with IgE anti-TNP. Upper panel: Experimental protocol. Middle panel: change in core body temperature following oral challenge with TNP-BSA. Lower panel: serum mMCPT1 concentrations. Data are representative of 2 independent experiments each with 4 to 5 mice/group. Columns and bars in A, and symbols and bars in B and C represent SEM. ** = p<0.01, *** = p< 0.001, ns: not significant. Please see also Figure S2.
Figure 3.
Figure 3.. Keratinocyte-derived IL-33 and IEC-derived IL-25, are necessary for intestinal MC expansion elicited by tape stripping the skin.
A. Il33, Tslp and Il25 mRNA expression in skin. Values represent fold induction in tape stripped skin relative to unmanipulated (Unm.) skin. Data are representative of 2 independent experiments each with 3 mice/group. B. IL-33, TSLP and IL-25 concentrations in the supernatants of skin explants from T/S and Unm. skin C. Serum concentrations of IL-33, TSLP and IL-25 in mice one hour after tape stripping the skin and in Unm. controls. Data representative of 2 independent experiments each with 3 mice/group. D. IL-33 concentrations in the supernatants of skin explants (left) and serum (right) of T/S and UnmK14-creTg/0Il33flox/flox mice and K14-creTg/0 controls. E. Jejunal MC numbers (#) in T/S and Unm. Il1rl1−/−, Tslpr−/−, and Il17rb−/− mice and genetically matched WT controls relative to the mean of unmanipulated controls. Results are derived from 2 independent experiments with 3 to 5 mice/group. F. Jejunal MC numbers (#) in T/S and Unm. K14- creTg/0Il33flox/flox, K14-creTg/0Il25flox/flox and K14-creTg/0 mice relative to the mean of the unmanipulated K14-creTg/0 controls. Results are derived from 2 independent experiments with 3 to 5 mice/group. G. Representative immunofluorescence staining of jejunal sections for DCLK1 in red and DAPI in blue (left) and quantitation of DCLK1+ tuft cells per HPF (right) in T/S WT mice and Unm. controls. Results are derived from 2 independent experiments each with respectively 1 and 2 mice/group. H. Representative flow cytometry analysis (left) and quantitation of the percentage (right) of SiglecF+EPCAM+ cells gating on CD45 cells from the jejunal epithelial layer. Results are derived from 2 independent experiments, each with 2 mice/group, I. Il25 mRNA expression in intestinal epithelial cells from T/S WT mice and Unm. controls. Values represent fold induction relative to the mean of unmanipulated mice. Results are derived from 2 independent experiments each with respectively 1 and 2 mice/group. J. Jejunal MC numbers (#) in T/S and Unm. Vil1-creTg/0Il25flox/flox mice and Vil1-creTg/0 controls relative to unmanipulated Vil1-creTg/0 controls. Results are derived from 2 independent experiments with 2 to 3 mice/group. Circles in G-I represent individual mice. Floating bars in A-C, columns and bars in D-F and J, and horizontal lines and bars in G-I represent mean and SEM. * = p < 0.05, ** = p <0.01, *** = p< 0.001, ns: not significant. Please see also Figure S3.
Figure 4.
Figure 4.. ILC2s are necessary for intestinal MC expansion elicited by tape stripping the skin.
A, B. Jejunal MC numbers in tape stripped (T/S) and unmanipulated (Unm.) Rag2−/−, Rag2−/−γc−/− and Il7ra−/− mice (B) and genetically matched WT controls relative to the mean value of the unmanipulated control group. Results are derived from 2 independent experiments with 2 to 5 mice/group. C. Jejunal MC numbers (#) in T/S and Unm. Rorasg/sg->WT and WT ->WT chimeras, relative to the mean value of the unmanipulated WT->WT chimera group Results are derived from 2 independent experiments each with 2 to 3 mice/group. D. ILC2 numbers in the jejunum (left) distant skin (middle) and lungs (right) in T/S BALB/c mice and Unm. controls. Data pooled from 2 independent experiments each with 3–4 mice/group. E. Cytokine mRNA expression, relative to B2m in sorted CD45+LinCD90+ ILCs from the jejunum of T/S mice and Unm. controls. Data pooled from 2 independent experiments each with 3–4 mice/group. F. Representative flow cytometry analysis (left) and quantitation (right) of CD90+YFP+ ILC2s gating on CD45+Lin live cells from the jejunum of T/S and Unm. Roracre/creROSAYFP mice. G. Cytokine mRNA expression, relative to B2m, in LinYPF+ cells (ILC2s) sorted from the jejunum of T/S and Unm. Roracre/creROSAYFP mice. Data pooled from 2 independent experiments each with 3–4 mice/group. H, I. ILC2s numbers (left) and Il4 and Il13 mRNA expression, relative to B2m, in sorted CD45+LinCD90+ ILCs (right) from the jejunum of T/S and Unm. K14-creTg/0Il33flox/flox mice, and K14-creTg/0 controls (H) and T/S and Unm. Vilin1-cre I25flox/flox mice and vilin1-cre controls (I). Results are derived from 2 independent experiments with 3 to 5 mice/group. Columns and bars represent mean and SEM. * = p < 0.05, ** = p <0.01, *** = p< 0.001, ns: not significant. Please see also Figure S5 and S6.
Figure 5.
Figure 5.. IL-33 and IL-25 directly target ILC2s to cause their expansion and to activate a feed forward ILC2 and tuft cells loop in the intestine of tape stripped mice.
A-C. ILC2 numbers (A) Il4 and Il13 mRNA expression relative to B2m, in sorted CD45+LinCD90+ ILCs and MC numbers in the jejunum of T/S and Unm. Roracre/creIl17rbflox/flox, Roracre/creIl1rl1flox/flox and Roracre/cre mice relative to Unm. Roracre/cre controls (C). Results are derived from 3 independent experiments with 2 to 4 mice/group. D. Representative flow cytometry analysis of IL-25R (left) and IL-33R (right) expression by jejunal and lung CD45+Lin CD90+YFP+ ILC2s from Roracre/creROSAYFP mice. Black lines represent isotype control. Similar results were obtained in two other independent experiments. E-F. Quantitation of the percentage of SiglecF+EPCAM+ cells gating on CD45 cells from the epithelial layer (E), Il25 mRNA expression in IECs (F) and ILC2s numbers (G) in the jejunum of T/S and Unm. Roracre/creIl4/13flox/flox mice and Roracre/cre controls. Results are derived from 3 independent experiments with 2 to 4 mice/group. H. ILC2s numbers (left), percentage SiglecF+EPCAM+ cells gating on CD45- cells from the jejunal epithelial layer (center) and Il4 and Il13 mRNA expression relative to B2m, in sorted CD45+LinCD90+ ILCs (right) in the jejunum of T/S and Unm. Rag2−/− mice. Results are derived from 2 independent experiments with 3 to 4 mice/group. Columns and bars represent mean and SEM. * = p < 0.05, *** = p< 0.001, ns: not significant. Please see also Figure S5.
Figure 6.
Figure 6.. ILC2-derived IL-4 and IL-13 directly target MCs to cause their expansion in the intestine of tape stripped mice.
A. Jejunal MC numbers (#) in T/S and Unm. WT mice treated with neutralizing anti-IL-4, anti-IL-5, anti-IL-9 or anti-IL-13 mAbs. MC values are relative to the mean value of the unmanipulated control group. Results are derived from 3 independent experiments with 2 to 4 mice/group. B. MC numbers relative to Unm. RoraCre/Cre controls in the jejunum of T/S and Unm. Roracre/creIl4/13flox/flox and Roracre/cre mice. Results are derived from 3 independent experiments with 2 to 4 mice/group. C. Change in core body temperature following oral OVA challenge in T/S Roracre/creIl4/13flox/flox mice and Roracre/cre controls i.p. sensitized with OVA. Results are derived from 2 independent experiments with 3 to 5 mice/group. D, E. MC numbers relative to Unm. Mcpt5-creTg/0 (D) and ILC2s numbers (E), in the jejunum of T/S and Unm. Mcpt5-creTg/0Il4raflox/- mice and Mcpt5-creTg/0 mice. Results are derived from 2 independent experiments with 3 to 5 mice/group. F. Change in core body temperature following oral OVA challenge in T/S Mcpt5-creTg/0Il4raflox/- mice and Mcpt5-creTg/0 controls i.p. sensitized with OVA. Results are derived from 2 independent experiments with 3 to 5 mice/group. G, H. ILC2 numbers (G) and Il4 and Il13 mRNA expression in sorted CD45+LinCD90+ ILCs (H) in the jejunum of T/S and Unm. KitW-sh/W-sh mice and genetically matched controls. Results are derived from 2 independent experiments with 3 to 5 mice/group. Columns and bars represent mean and SEM. * =p < 0.05, ** =p <0.01, ns: not significant.
Figure 7.
Figure 7.. Duodenal mast cells are increased in patients with AD.
A. Characteristics of AD patients and non-AD controls, n.d.: not done. B. Representative immunohistochemistry staining of duodenal sections with anti-tryptase mAb, with scale bars representing 100 μm (left), and numbers of tryptase+ cells per HPF in the duodenum (right) of 4 children with active AD and scratching, and 4 children with no AD and no scratching. Circles represent individual patients Open circle: no history of food sensitivity, red circle: anaphylaxis to food, blue circle: eosinophilic esophagitis. Horizontal lines and bars in C represent mean and SEM. ** = p <0.01.

Comment in

References

    1. Ahrens R, Osterfeld H, Wu D, Chen CY, Arumugam M, Groschwitz K, Strait R, Wang YH, Finkelman FD, and Hogan SP (2012). Intestinal mast cell levels control severity of oral antigen-induced anaphylaxis in mice. Am J Pathol 180, 1535–1546. - PMC - PubMed
    1. Al-Shami A, Spolski R, Kelly J, Keane-Myers A, and Leonard WJ (2005). A role for TSLP in the development of inflammation in an asthma model. J Exp Med 202, 829–839. - PMC - PubMed
    1. Angkasekwinai P, Chang SH, Thapa M, Watarai H, and Dong C (2010). Regulation of IL-9 expression by IL-25 signaling. Nat Immunol 11, 250–256. - PMC - PubMed
    1. Bartnikas LM, Gurish MF, Burton OT, Leisten S, Janssen E, Oettgen HC, Beaupre J, Lewis CN, Austen KF, Schulte S, et al. (2013). Epicutaneous sensitization results in IgE-dependent intestinal mast cell expansion and food-induced anaphylaxis. J Allergy Clin Immunol 131, 451–460 e451–456. - PMC - PubMed
    1. Burton OT, Darling AR, Zhou JS, Noval-Rivas M, Jones TG, Gurish MF, Chatila TA, and Oettgen HC (2013). Direct effects of IL-4 on mast cells drive their intestinal expansion and increase susceptibility to anaphylaxis in a murine model of food allergy. In Mucosal Immunology, pp. 740–750. - PMC - PubMed

Publication types

MeSH terms