

Bronchioalveolar stem cells are a main source for regeneration of distal lung epithelia in vivo
- PMID: 31028085
- PMCID: PMC6576211
- DOI: 10.15252/embj.2019102099
Bronchioalveolar stem cells are a main source for regeneration of distal lung epithelia in vivo
Abstract
Bronchioalveolar stem cells (BASCs) are a potential source for lung regeneration, but direct in vivo evidence for a multipotential lineage contribution during homeostasis and disease is critically missing, since specific genetic labeling of BASCs has not been possible. We developed a novel cell tracing approach based on intein-mediated assembly of newly engineered split-effectors, allowing selective targeting of dual-marker expressing BASCs in the mouse lung. RNA sequencing of isolated BASCs demonstrates that BASCs show a distinct transcriptional profile, characterized by co-expression of bronchiolar and alveolar epithelial genes. We found that BASCs generate the majority of distal lung airway cells after bronchiolar damage but only moderately contribute to cellular turnover under homeostatic conditions. Importantly, DTA-mediated ablation of BASCs compromised proper regeneration of distal airways. The study defines BASCs as crucial components of the lung repair machinery and provides a paradigmatic example for the detection and manipulation of stem cells that cannot be recognized by a single marker alone.
Keywords: BASCs; cell tracing; lung repair; lung stem cells; split‐tTA.
© 2019 The Authors.
Conflict of interest statement
The authors declare that they have no conflict of interest.
Figures
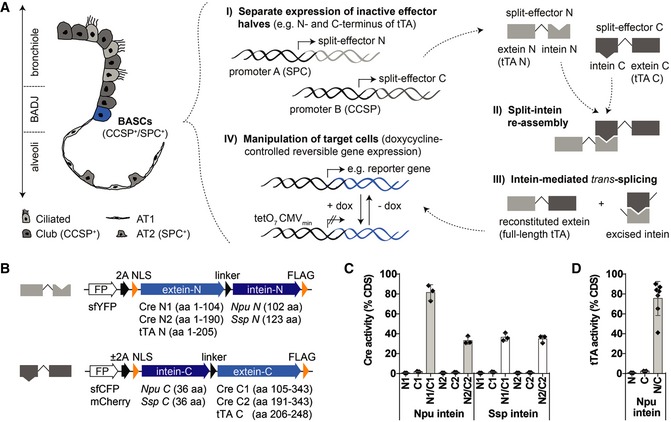
Schematic depiction of bronchioalveolar cell types and strategy for selective in vivo manipulation of dual‐marker expressing target cells.
Split‐effector construct design.
Quantification of Cre activity by dual luciferase assays (mean ± SD, n = 3).
Quantification of tTA activity by dual luciferase assays [mean ± SD, n = 3 (N and C) or n = 7 (N/C)].
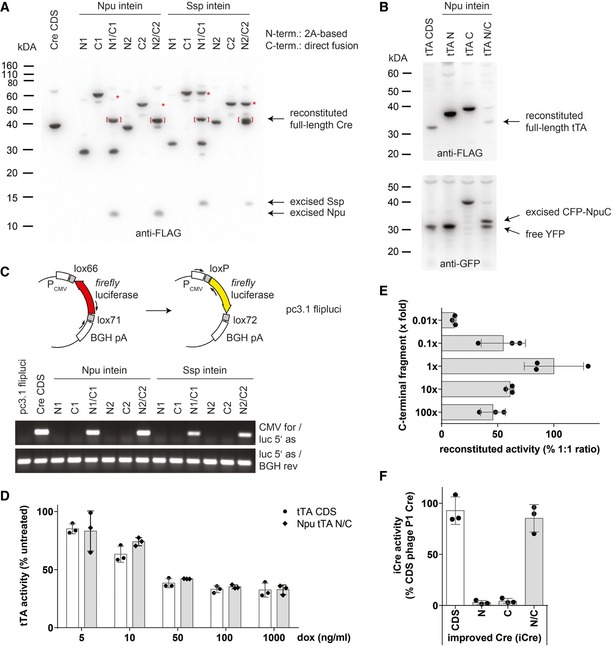
Western blot analysis of Cre reconstitution by intein‐mediated trans‐splicing. Brackets indicate reconstituted full‐length Cre protein, and asterisks denote near complete conversion of C‐terminal effector fragment using Npu‐based split‐Cre pairs.
Reconstitution of full‐length tTA protein by intein‐mediated trans‐splicing.
PCR‐based analysis of Cre‐mediated DNA recombination.
Quantification of tTA activity by dual luciferase assays in the presence of doxycycline (dox). Data depicted as mean ± SD, n = 3.
Reconstitution of biologically active tTA protein at different ratios of N‐ and C‐terminal fragments. A constant amount of Npu tTA N was co‐transfected with varying amounts of Npu tTA C to mimic potential differences in expression levels. tTA activity was quantified by dual luciferase assays. Data depicted as mean ± SD, n = 3.
In vitro testing of split‐iCre reconstitution used for insertion into endogenous Ccsp and Spc gene loci. Phage P1‐derived Cre fragments within the Npu N1/C1 split‐pair were replaced by equivalent sequences from a codon‐improved Cre recombinase (iCre). Cre activity was quantified by dual luciferase assays. Data depicted as mean ± SD, n = 3.
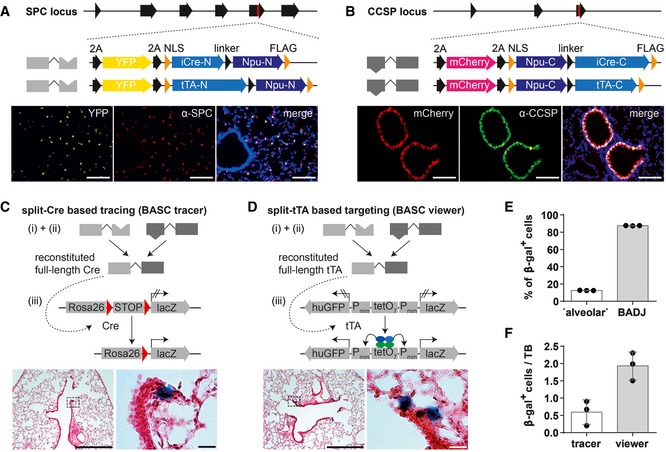
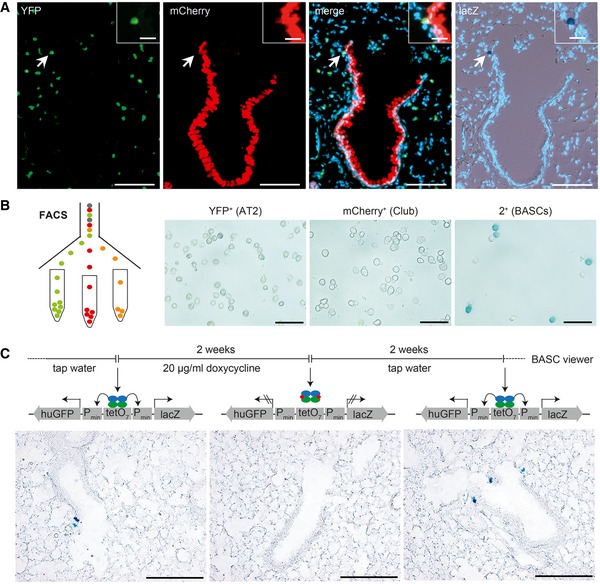
- A, B
Scheme of engineered Spc and Ccsp loci after integration of split‐Cre and split‐tTA effectors (red mark = stop codon) and comparison of endogenous SPC or CCSP expression and YFP or mCherry reporter expression in lung sections. Blue: DAPI. Scale bar: 100 μm.
- C, D
β‐galactosidase and H&E staining of lung sections from BASC tracer and BASC viewer animals. Scale bars: 500 μm (overview) and 20 μm (boxed magnification).
- E
Localization of β‐gal+ cells in adult BASC viewer animals. BADJ‐associated and “alveolar” β‐gal+ cells are expressed as percentage of all lineage‐labeled cells (mean ± SD, n = 3).
- F
Number of β‐gal+ cells in adult BASC tracer and BASC viewer animals, normalized to the number of terminal bronchioles (TBs; mean ± SD, n = 3).
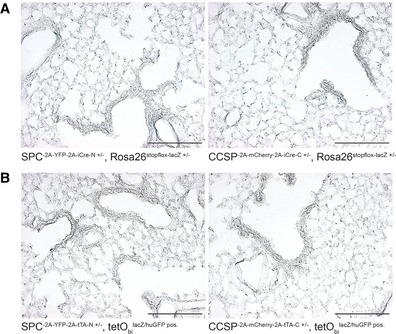
- A, B
β‐galactosidase staining of lung sections from N‐ and C‐terminal. (A) split‐Cre or (B) split‐tTA knock‐in strains combined with corresponding reporter alleles as indicated. Scale bar: 200 μm.
Sequential microscopic imaging of epifluorescence and β‐galactosidase activity in lung sections of adult BASC viewer animals. Arrow highlights labeled BASC at BADJ (magnified in box). Blue: DAPI. Scale bars: 100 μm (overview) and 20 μm (boxed magnification).
β‐galactosidase staining of AT2 cells (YFP+), Club cells (mCherry+), and BASCs (mCherry+/YFP+) isolated from BASC viewer mice by fluorescence‐activated cell sorting (FACS). Scale bar: 50 μm.
Doxycycline‐dependent reversible labeling of BASCs in BASC viewer mice. Scale bar: 200 μm.
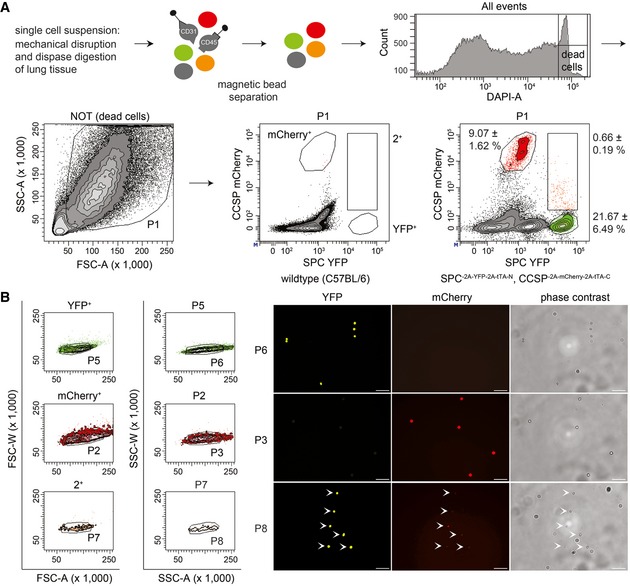
Hematopoietic and endothelial cells were separated from lung cell suspensions using magnetic beads (anti‐CD45 and anti‐CD31). Viable epithelial cells were analyzed for mCherry and YFP fluorescence to establish the gates for mCherry+ (Club cells), YFP+ (AT2 cells), and 2+ (BASCs). Cell abundance is shown as percentage of total P1 cells. Data depicted as mean ± SD, n = 10.
Doublet exclusion based on forward (FSC) and side scatter (SSC) width versus amplitude plots and subsequent fluorescence microscopy of FACS‐isolated single cells. Scale bar: 50 μm.
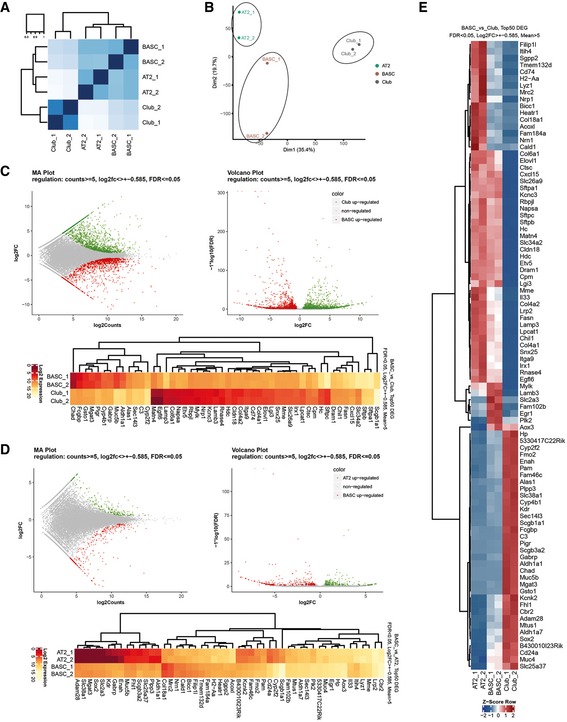
Heatmaps for Spearman correlation.
Principal component analysis reveals distinct clustering of AT2, Club, and BASC populations.
MA and volcano plots, and Top50 DEGs (FDR < 0.05, Log2FC > ± 0.585, Means > 5) for visualization of pairwise differential gene expression analysis of BASCs and Club cells.
MA and volcano plots, and Top50 DEGs (FDR < 0.05, Log2FC > ± 0.585, Means > 5) for visualization of pairwise differential gene expression analysis of BASCs and AT2 cells.
Heatmap of RNA‐seq z‐scores computed for the Top50 DEGs in BASC, AT2 and Club cells (FDR < 0.05, Log2FC > ± 0.585, Means > 5).
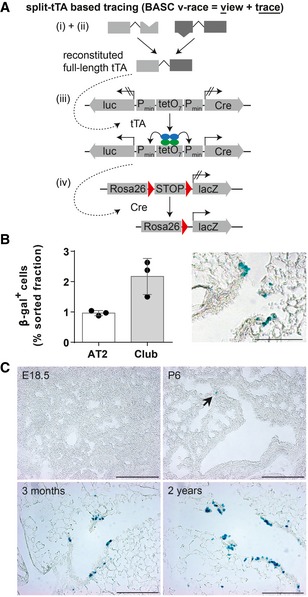
Schematic depiction of the strategy to trace BASCs and descendants via the split‐tTA system.
Quantification of β‐gal+ cells in FACS‐purified AT2 and Club cell fractions isolated from 3‐month‐old BASC v‐race mice (mean ± SD, n = 3) and example of β‐galactosidase label distribution in lung sections. Scale bar: 100 μm.
BASCs emerge at early postnatal stages and contribute to epithelial turnover throughout life. β‐galactosidase staining of lung sections derived from BASC v‐race animals collected at indicated time points. Arrow highlights β‐gal+ cell at P6. Scale bar: 200 μm.
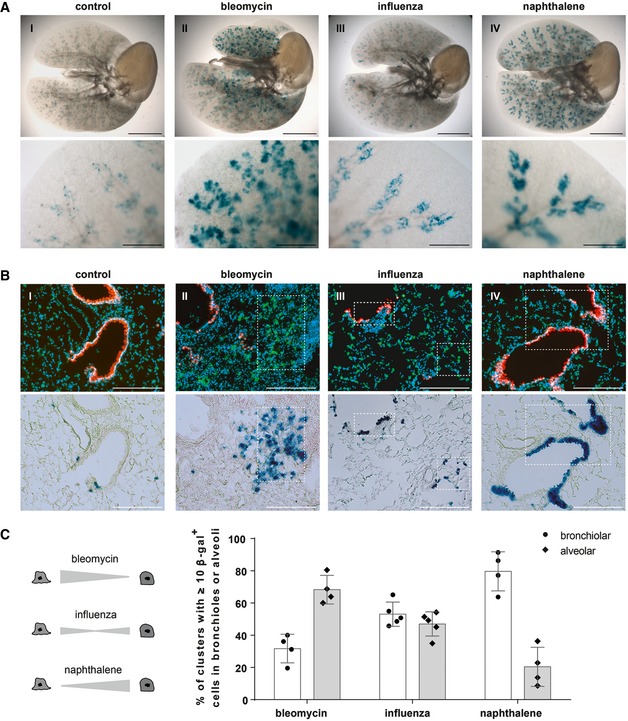
β‐galactosidase staining of cleared whole lung preparations isolated from control and injured BASC v‐race animals 21 days (bleomycin, naphthalene) or 35 days (influenza) following injury. Scale bar: 5 mm (whole lungs) and 1 mm (magnification).
Sequential microscopic imaging of epifluorescence and β‐galactosidase activity in lung sections of control and injured BASC v‐race mice. Clusters of BASC‐derived AT2 (YFP+) and Club cells (mCherry+) are highlighted. Blue: DAPI. Scale bar: 200 μm.
Contribution of BASCs to different cellular compartments. Bronchiolar and alveolar accumulations of lineage‐traced BASC derivatives are expressed as percentage of all clusters containing ≥ 10 β‐gal+ cells. Data depicted as mean ± SD, n = 4 (bleomycin, naphthalene) or n = 5 (influenza).
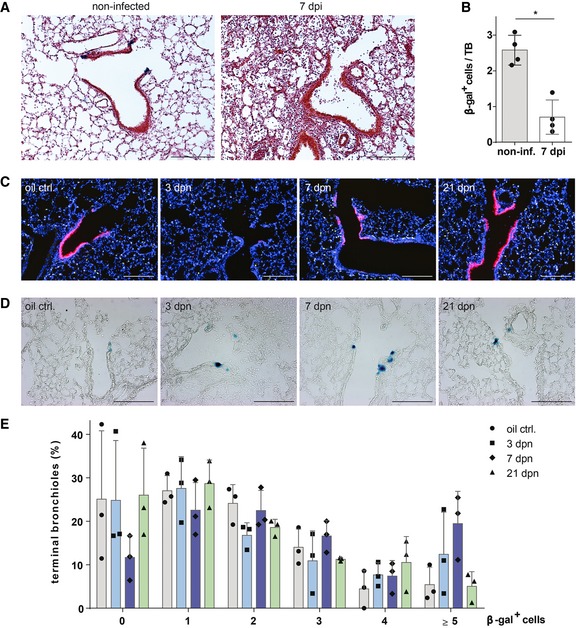
β‐galactosidase and H&E staining of lung sections from control (non‐infected) and injured BASC viewer mice 7 days post‐infection (7 dpi) with influenza virus. Scale bar: 200 μm.
Abundance of β‐gal+ cells in control (non‐infected) and injured (7 dpi) BASC viewer animals. Data depicted as mean ± SD, n = 4, *P = 0.0286 (Mann–Whitney test), TB, terminal bronchiole.
Club cell depletion/recovery after naphthalene treatment. Microscopic imaging of epifluorescence in lung sections from control and injured BASC viewer animals isolated 3, 7, and 21 days post‐naphthalene (dpn). Blue: DAPI. Scale bar: 200 μm.
β‐galactosidase staining of lung sections from control and injured BASC viewer animals 3, 7, and 21 days post‐naphthalene (dpn). Scale bar: 200 μm.
Abundance of β‐gal+ cells in control and injured BASC viewer animals. The percentage of terminal bronchioles containing 0, 1, 2, 3, 4, ≥ 5 β‐gal+ cells is shown. Data depicted as mean ± SD, n = 3.
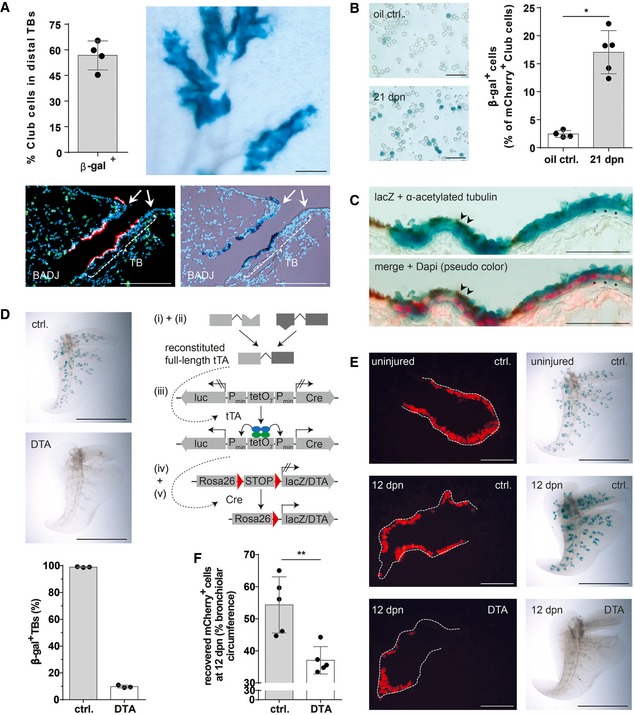
Quantification of lineage‐traced Club cells in distal TBs and β‐galactosidase staining of cleared accessory lobe preparation (scale bar: 250 μm) isolated from injured BASC v‐race mice at 21 dpn (mean ± SD, n = 4). Bottom panel: example of sequential microscopic imaging to quantify β‐gal+ mCherry+ cells in distal TBs. Arrows denote last airway bifurcation before bronchioalveolar duct junction (BADJ). Scale bar: 200 μm.
β‐galactosidase staining of FACS‐purified Club cells from control and injured BASC v‐race animals. Scale bar: 50 μm. The percentage of lineage‐traced Club cells is shown [(mean ± SD, n = 4 (oil ctrl.) or n = 5 (21 dpn), * P = 0.0159 (Mann–Whitney test)].
Combined β‐galactosidase (blue) and acetylated tubulin staining (cilia, brown color) of lung sections from BASC v‐race animals at 21 dpn. Red: DAPI (pseudocolor). Examples of lineage‐traced ciliated cells (arrowheads) and Club cells (asterisks) are highlighted. Scale bar: 50 μm.
β‐galactosidase staining of cleared accessory lobe preparations (scale bar: 5 mm) and quantification of β‐gal+ bronchioles in lung sections from adult BASC v‐race (ctrl.) and BASC‐ablated mice (DTA). Data depicted as mean ± SD, n = 3.
β‐galactosidase staining of cleared accessory lobe preparations (scale bar: 5 mm) and fluorescence microscopy of lung sections from uninjured and naphthalene‐exposed BASC v‐race (ctrl.) and BASC‐ablated (DTA) mice 12 days post‐naphthalene (dpn). Dotted lines depict bronchiolar boundaries. Scale bar: 100 μm.
Quantification of Club cell recovery in injured BASC v‐race (ctrl.) and BASC‐ablated (DTA) animals, expressed as percentage of bronchiolar circumference re‐populated by mCherry+ cells at 12 dpn. Data depicted as mean ± SD, n = 5, **P = 0.0079 (Mann–Whitney test). DTA, diphtheria toxin fragment A.
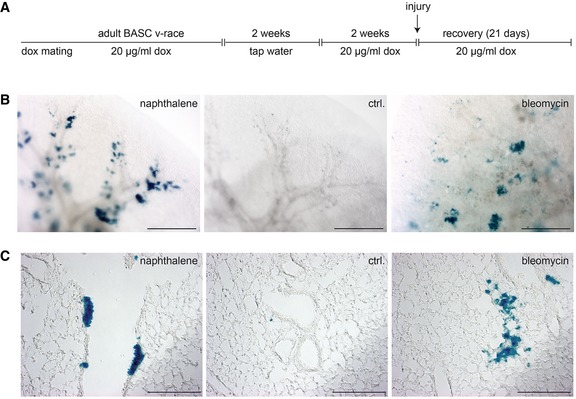
- A
Schematic outline of the treatment regimen. BASC v‐race animals were already treated with doxycycline during breeding. Doxycycline treatment of offspring was continued until adulthood. To induce labeling of single BASCs, doxycycline treatment was temporarily suspended for 2 weeks when mice reached an age of 2 months. Two weeks after re‐initiation of doxycycline treatment, lung injury was induced by administration of naphthalene or bleomycin.
- B, C
β‐galactosidase staining of cleared whole lung preparations (scale bar: 1 mm) and lung sections (scale bar: 200 μm) from control and injured BASC v‐race animals 21 days after injury. Labeling of single BASCs resulted in distinct clusters of β‐gal+ cells in the bronchiolar (Club cells) and alveolar (AT2 cells) compartment.
Comment in
-
BASC-ing in the glow: bronchioalveolar stem cells get their place in the lung.EMBO J. 2019 Jun 17;38(12):e102344. doi: 10.15252/embj.2019102344. Epub 2019 May 28. EMBO J. 2019. PMID: 31138607 Free PMC article.
References
-
- Albert H, Dale EC, Lee E, Ow DW (1995) Site‐specific integration of DNA into wild‐type and mutant lox sites placed in the plant genome. Plant J 7: 649–659 - PubMed
-
- Bardeesy N, Sinha M, Hezel AF, Signoretti S, Hathaway NA, Sharpless NE, Loda M, Carrasco DR, DePinho RA (2002) Loss of the Lkb1 tumour suppressor provokes intestinal polyposis but resistance to transformation. Nature 419: 162–167 - PubMed
Publication types
MeSH terms
LinkOut - more resources
Full Text Sources
Other Literature Sources
Molecular Biology Databases
