

Published Erratum
doi: 10.4049/jimmunol.1900420.
Epub 2019 Apr 26.
Correction: Pleiotropic Impacts of Macrophage and Microglial Deficiency on Development in Rats with Targeted Mutation of the Csf1r Locus
- PMID: 31028122
- PMCID: PMC6526391
- DOI: 10.4049/jimmunol.1900420
Item in Clipboard
Published Erratum
Correction: Pleiotropic Impacts of Macrophage and Microglial Deficiency on Development in Rats with Targeted Mutation of the Csf1r Locus
J Immunol.
.
No abstract available
Figures
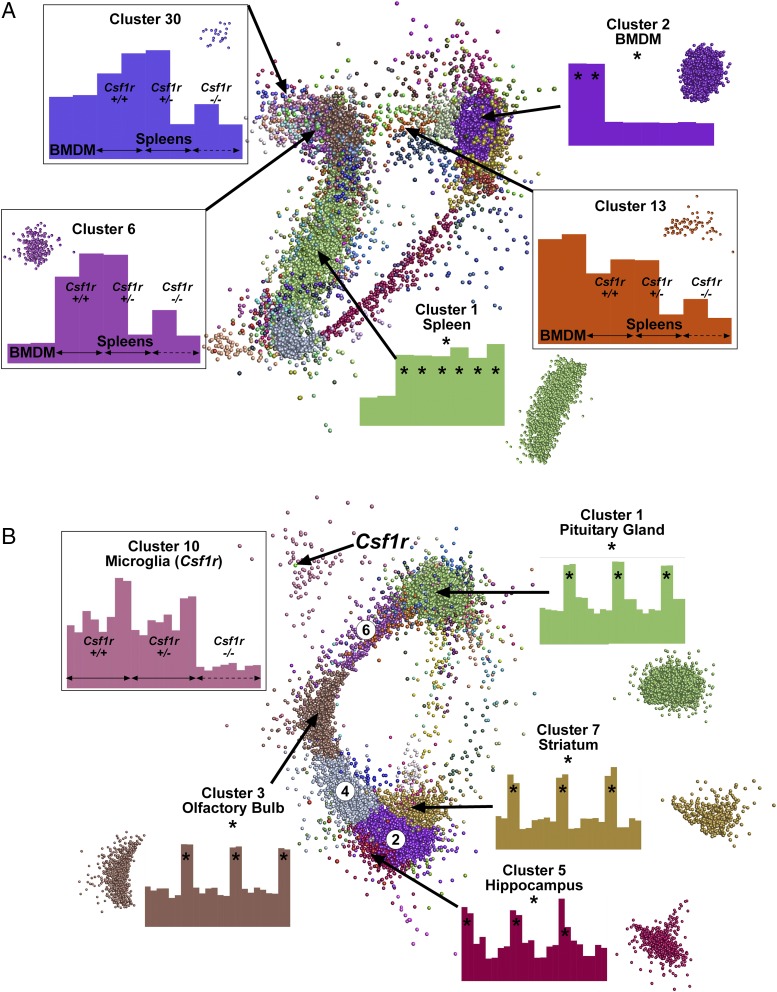
Network analysis of gene expression in the spleen and brains of Csf1r deficient rats. RMA-normalized microarray data from Supplemental Table I was analyzed with Graphia Pro. Edges have been removed for ease of visualization. Nodes allocated to the same cluster are the same color. Histograms show the averaged expression patterns of all genes in the cluster. Boxed clusters refer to genes affected by loss of Csf1r. Unboxed clusters refer to genes that are tissue specific (*). (A) Key clusters from spleen. All known genes in which no sample reached an intensity of 20 were excluded. Analysis was performed at a Pearson correlation coefficient ≥0.95 (12,305 nodes making 1,746,925 edges). Clustering was performed at an inflation of 2.0 with a minimum cluster size of 10. (B) Key clusters from brain. All known genes in which no sample reached an intensity of 20 were excluded. Analysis was performed at a Pearson correlation coefficient ≥0.85 (11,833 nodes making 3,617,804 edges). Clustering was performed at an inflation of 2.0 with a minimum cluster size of 10. Three clusters (circled numbers) shared gene expression with multiple brain regions: cluster 2 (striatum and hippocampus), cluster 4 (olfactory bulb, striatum, and hippocampus), and cluster 6 (olfactory bulb and pituitary gland). Histograms for these clusters are shown in Supplemental Table I.
Erratum for
-
Pleiotropic Impacts of Macrophage and Microglial Deficiency on Development in Rats with Targeted Mutation of the Csf1r Locus.J Immunol. 2018 Nov 1;201(9):2683-2699. doi: 10.4049/jimmunol.1701783. Epub 2018 Sep 24. J Immunol. 2018. PMID: 30249809 Free PMC article.
Publication types
LinkOut - more resources
Full Text Sources
Miscellaneous
