. 2019 May 17;39(5):BSR20181601.
doi: 10.1042/BSR20181601. Print 2019 May 31.

Mapping the metabolism of five amino acids in bloodstream form Trypanosoma brucei using U-13C-labelled substrates and LC-MS

Affiliations

Mapping the metabolism of five amino acids in bloodstream form Trypanosoma brucei using U-13C-labelled substrates and LC-MS

Katharina Johnston et al. Biosci Rep. .

Abstract

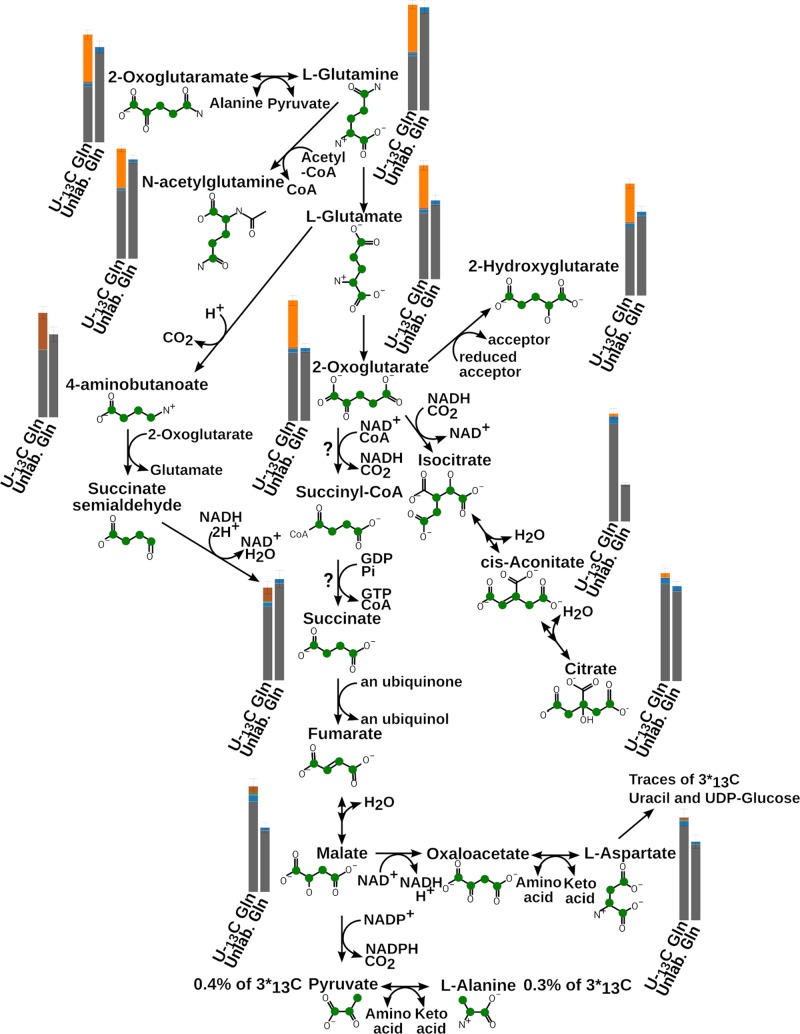
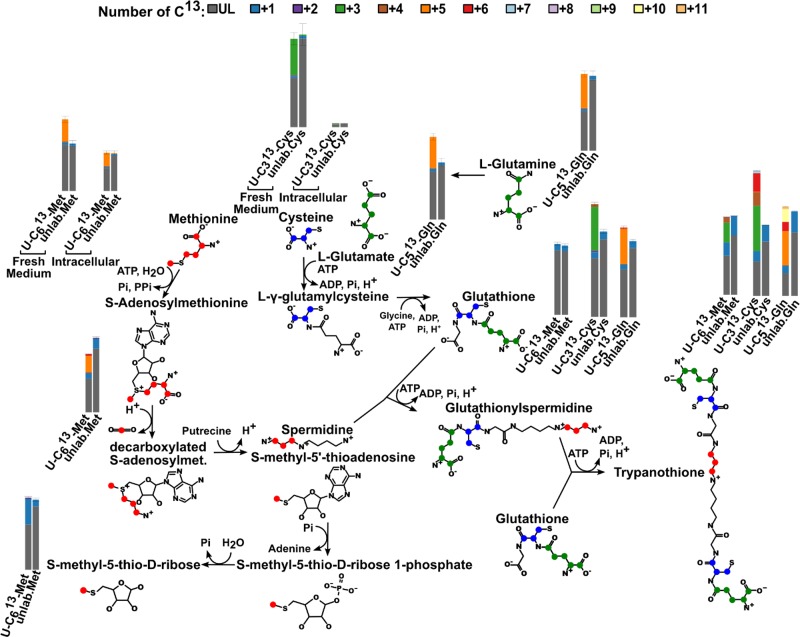
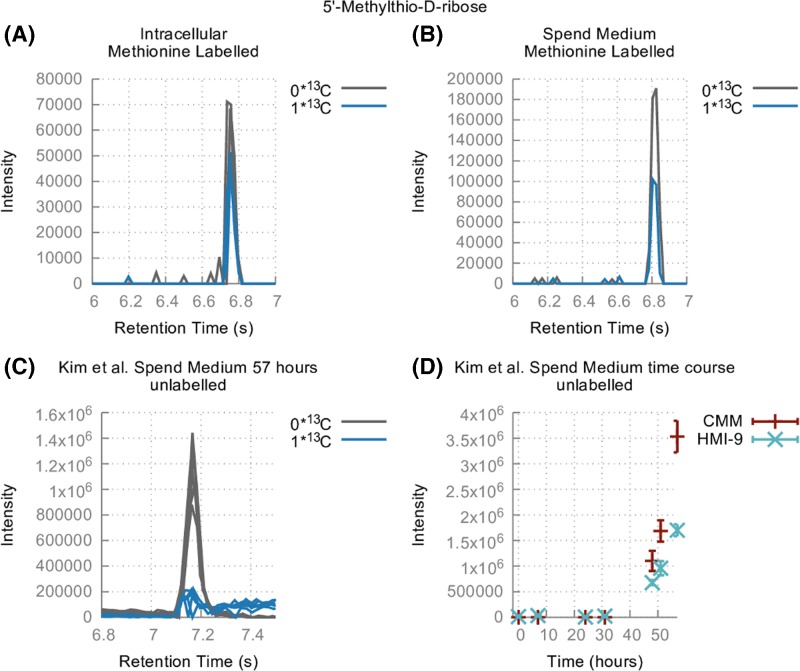
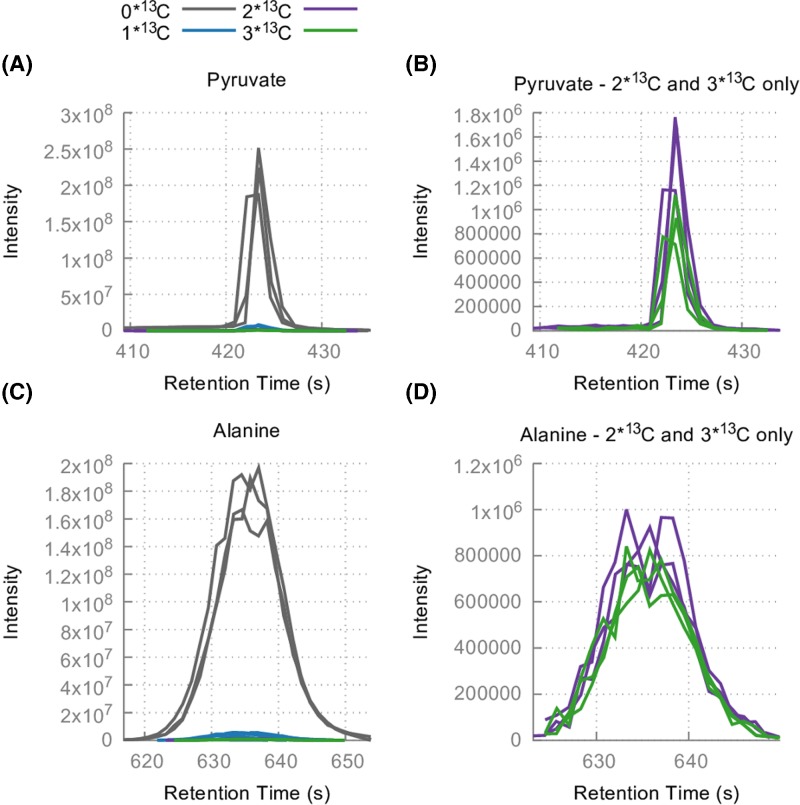
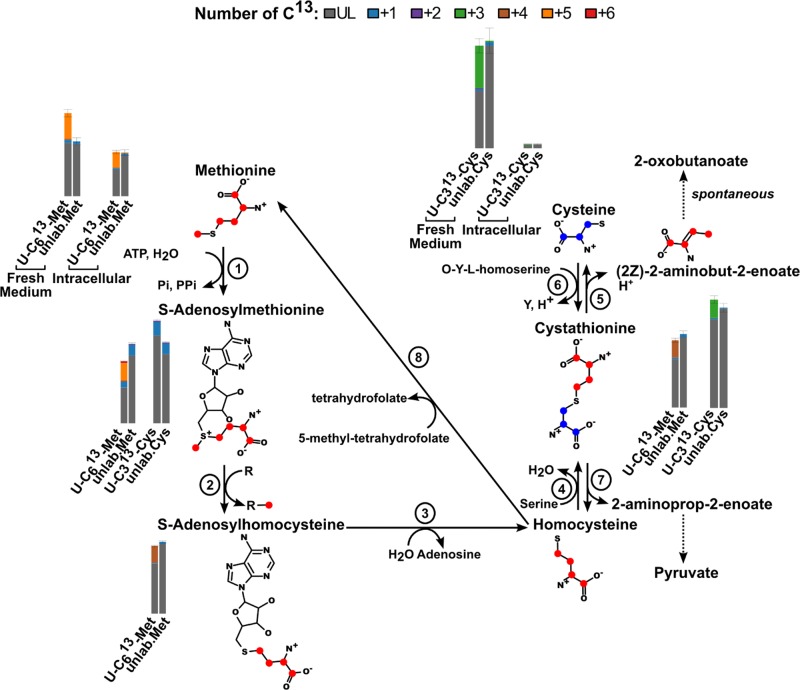
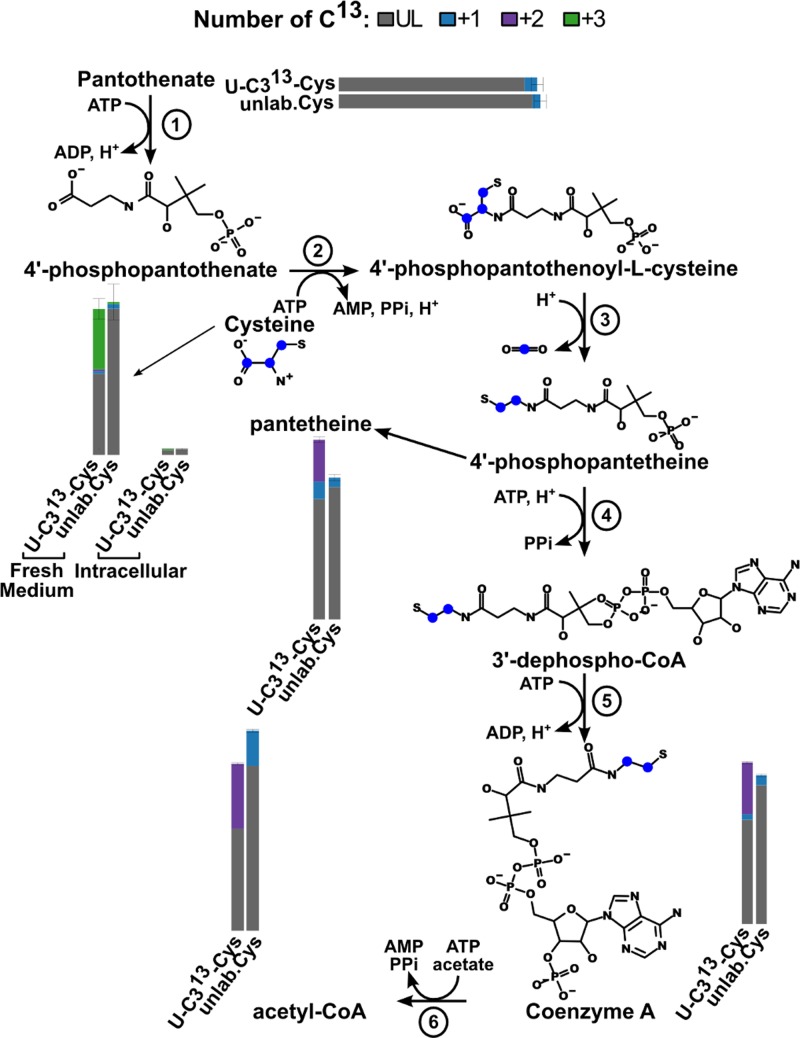
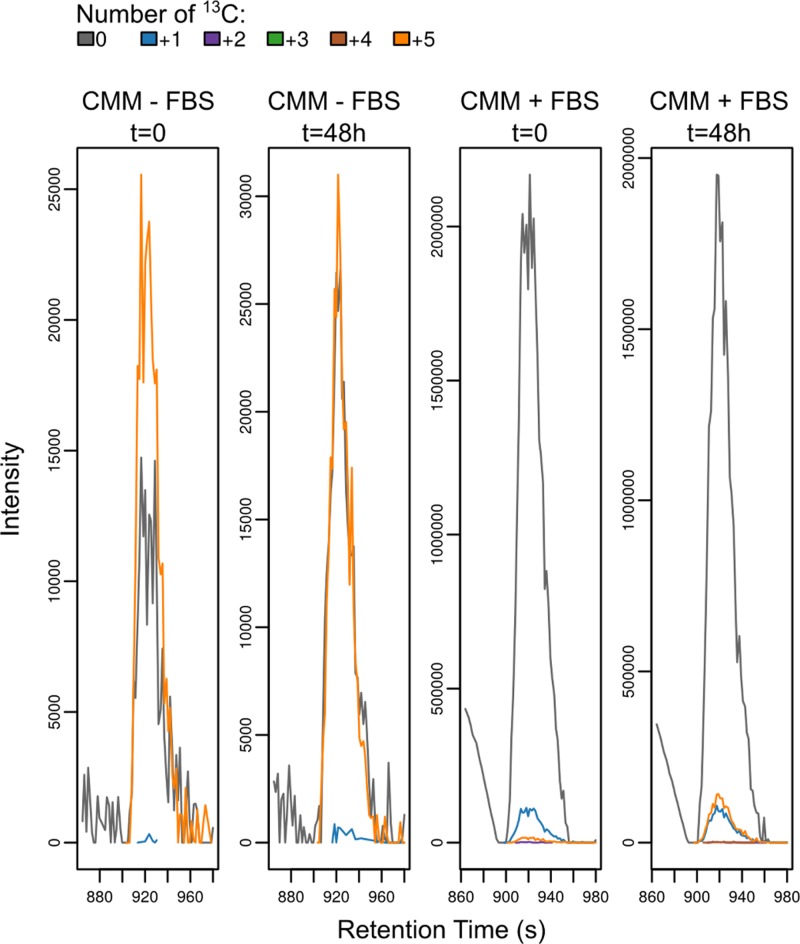
The metabolism of the parasite Trypanosoma brucei has been the focus of numerous studies since the 1940s. Recently it was shown, using metabolomics coupled with heavy-atom isotope labelled glucose, that the metabolism of the bloodstream form parasite is more complex than previously thought. The present study also raised a number of questions regarding the origin of several metabolites, for example succinate, only a proportion of which derives from glucose. In order to answer some of these questions and explore the metabolism of bloodstream form T. brucei in more depth we followed the fate of five heavy labelled amino acids - glutamine, proline, methionine, cysteine and arginine - using an LC-MS based metabolomics approach. We found that some of these amino acids have roles beyond those previously thought and we have tentatively identified some unexpected metabolites which need to be confirmed and their function determined.

Keywords: amino acid metabolism; mass spectrometry; parasitic protozoa; trypanosomes.


Conflict of interest statement

The authors declare that there are no competing interests associated with the manuscript.

Figures

Figure 1
Figure 1. Glutamine labelled experiments results
The bar charts show the measured proportions of the different number of 13C: grey represents fully unlabelled metabolite, blue 1 carbon 13C, brown 4 carbons 13C and orange 5 carbons 13C. The green dots on the molecules represent the theoretical individual 13C starting with a fully labelled precursor following this pathway.
Figure 2
Figure 2. Trypanothione biosynthesis pathway as seen using 50% U-13C glutamine, cysteine or methionine
The bar charts show the measured proportions of the different number of 13C (colour code is shown at the top of the figure). The green dots on the molecules represent the theoretical individual 13C coming from fully labelled glutamine, blue carbons come from fully labelled cysteine and red from fully labelled methionine.
Figure 3
Figure 3. Putative methylthio-d-ribose in the U-13C methionine experiment (A and B) and in Kim et al. [18] spend medium experiment (C and D)
Figure 4
Figure 4. Pyruvate (A and B) and alanine (C and D) as seen in the 50% U-13C glutamine experiment
Figure 5
Figure 5. S-Adenosylhomocysteine recycling pathway
The bar charts show the measured proportions of the different number of 13C (colour code is shown at the top of the figure). The blue dots on the molecules represent the theoretical individual 13C coming from cysteine and red from methionine.
Figure 6
Figure 6. Coenzyme A biosynthesis pathway
The bar charts show the measured proportions of the different number of 13C (colour code is shown at the top of the figure). The blue dots on the molecules represent the theoretical individual 13C coming from cysteine.
Figure 7
Figure 7. Peak of ornithine as seen in the medium (CMM) when arginine is fully labelled, with or without FBS but no cells
(Intensity of the peak shown as a function of retention time).
Figure 8
Figure 8. Growth of wild type and Δak cells
Figure 9
Figure 9. OPLS-DA scores plot of the metabolomics pH experiment
(A) OPLS-DA including all four groups: WT and Δak cells at pH 7.4 and 8.7. (B) OPLS-DA including only Δak cells at both pH. (C) OPLS-DA including only WT cells at both pH.

References

    1. Bienen E.J., Hammadi E. and Hill G.C. (1981) Trypanosoma brucei: biochemical and morphological changes during in vitro transformation of bloodstream to procyclic-trypomastigotes. Exp. Parasitol. 51, 408–417 10.1016/0014-4894(81)90128-4 - DOI - PubMed
    1. Hart D.T., Misset O., Edwards S.W. and Opperdoes F.R. (1984) A comparison of the glycosomes (microbodies) isolated from Trypanosoma brucei bloodstream form and cultured procyclic trypomastigotes. Mol. Biochem. Parasitol. 12, 25–35 10.1016/0166-6851(84)90041-0 - DOI - PubMed
    1. Bringaud F., Rivière L. and Coustou V. (2006) Energy metabolism of trypanosomatids: adaptation to available carbon sources. Mol. Biochem. Parasitol. 149, 1–9 10.1016/j.molbiopara.2006.03.017 - DOI - PubMed
    1. Chokkathukalam A., Jankevics A., Creek D.J., Achcar F., Barrett M.P. and Breitling R. (2013) mzMatch-ISO: an R tool for the annotation and relative quantification of isotope-labelled mass spectrometry data. Bioinformatics 29, 281–283 10.1093/bioinformatics/bts674 - DOI - PMC - PubMed
    1. Creek D.J., Mazet M., Achcar F., Anderson J., Kim D.-H., Kamour R.. et al. (2015) Probing the metabolic network in bloodstream-form Trypanosoma brucei using untargeted metabolomics with stable isotope labelled glucose. PLoS Pathog. 11, e1004689 10.1371/journal.ppat.1004689 - DOI - PMC - PubMed

Publication types

MeSH terms