. 2019 May 14;116(20):9999-10008.
doi: 10.1073/pnas.1822001116. Epub 2019 Apr 26.

PD-1+ regulatory T cells amplified by PD-1 blockade promote hyperprogression of cancer

Affiliations

PD-1+ regulatory T cells amplified by PD-1 blockade promote hyperprogression of cancer

Takahiro Kamada et al. Proc Natl Acad Sci U S A. .

Abstract

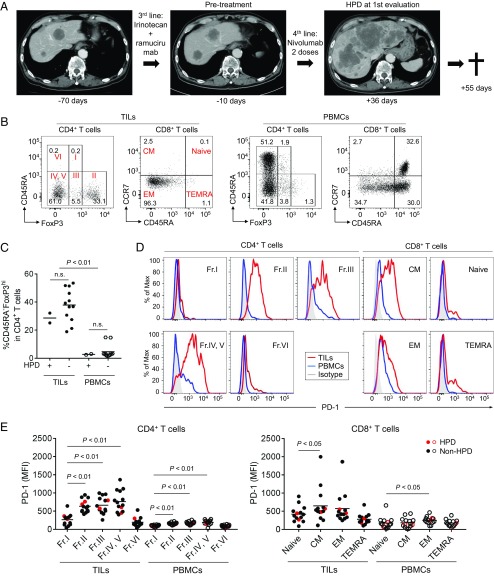
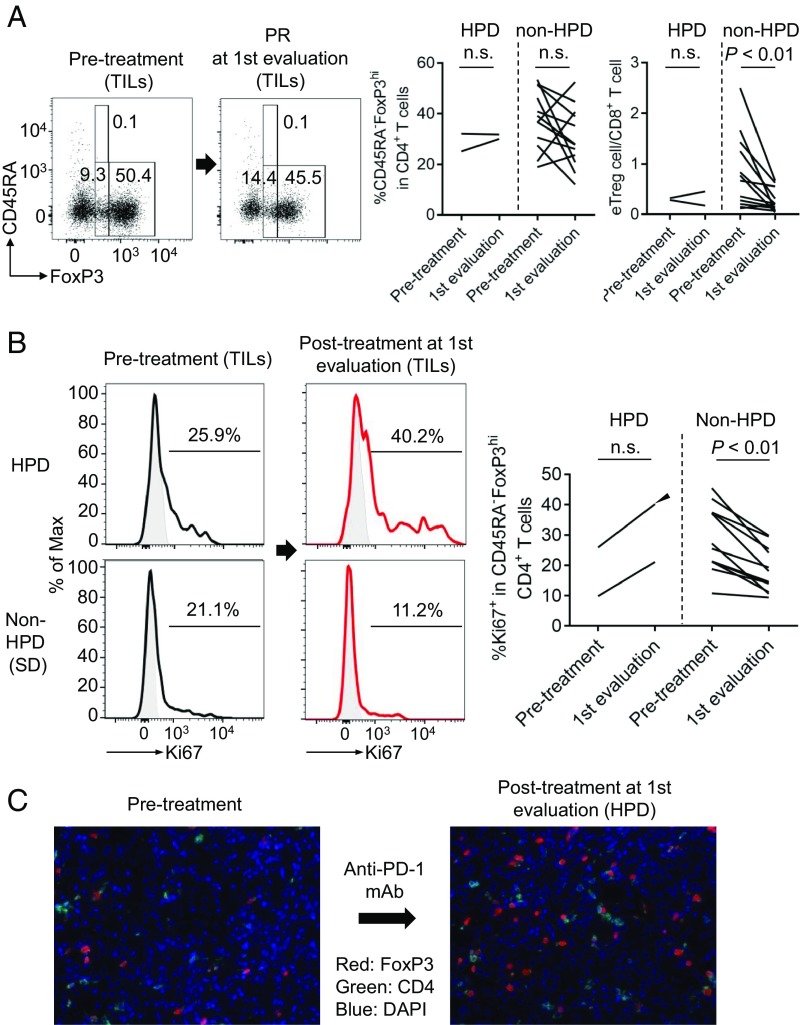
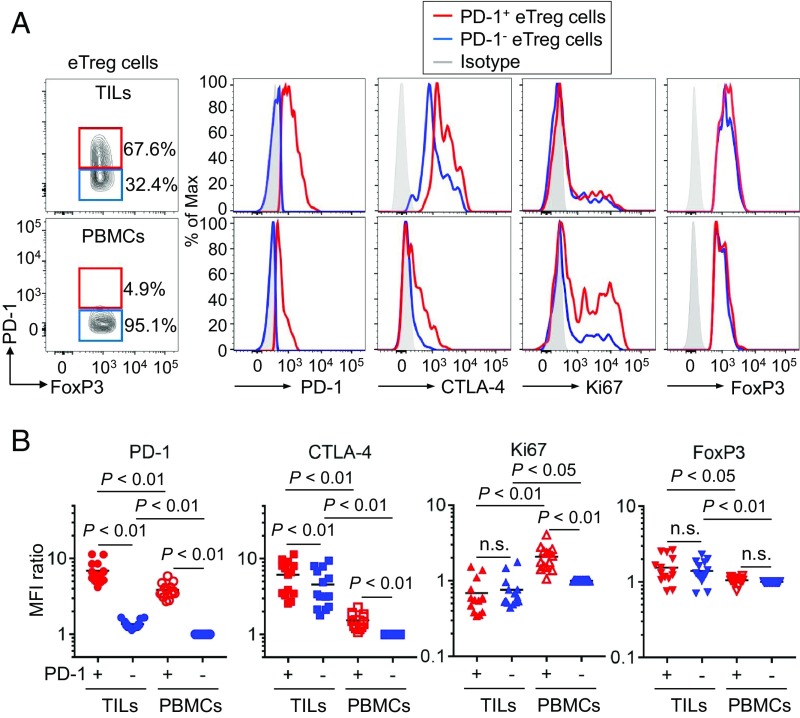
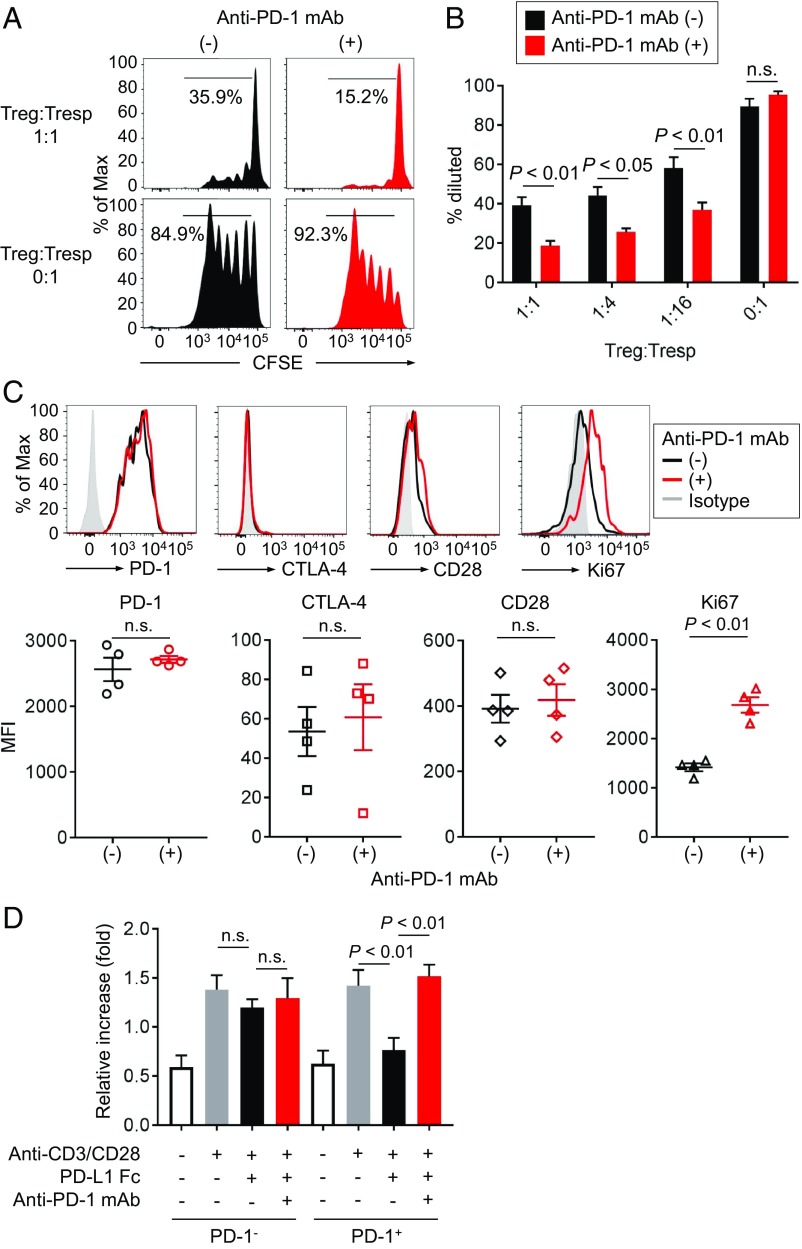
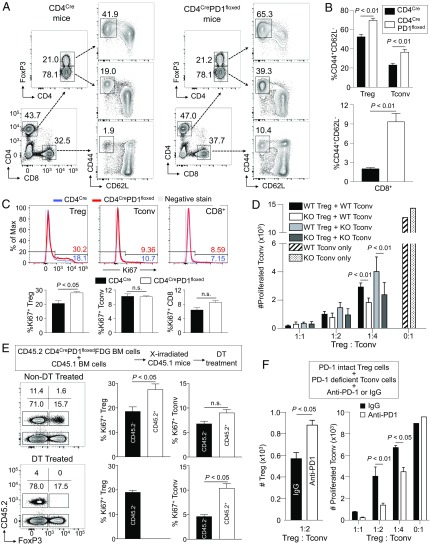
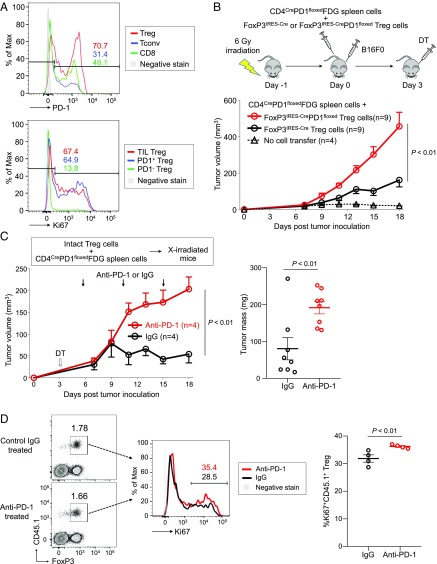
PD-1 blockade is a cancer immunotherapy effective in various types of cancer. In a fraction of treated patients, however, it causes rapid cancer progression called hyperprogressive disease (HPD). With our observation of HPD in ∼10% of anti-PD-1 monoclonal antibody (mAb)-treated advanced gastric cancer (GC) patients, we explored how anti-PD-1 mAb caused HPD in these patients and how HPD could be treated and prevented. In the majority of GC patients, tumor-infiltrating FoxP3highCD45RA-CD4+ T cells [effector Treg (eTreg) cells], which were abundant and highly suppressive in tumors, expressed PD-1 at equivalent levels as tumor-infiltrating CD4+ or CD8+ effector/memory T cells and at much higher levels than circulating eTreg cells. Comparison of GC tissue samples before and after anti-PD-1 mAb therapy revealed that the treatment markedly increased tumor-infiltrating proliferative (Ki67+) eTreg cells in HPD patients, contrasting with their reduction in non-HPD patients. Functionally, circulating and tumor-infiltrating PD-1+ eTreg cells were highly activated, showing higher expression of CTLA-4 than PD-1- eTreg cells. PD-1 blockade significantly enhanced in vitro Treg cell suppressive activity. Similarly, in mice, genetic ablation or antibody-mediated blockade of PD-1 in Treg cells increased their proliferation and suppression of antitumor immune responses. Taken together, PD-1 blockade may facilitate the proliferation of highly suppressive PD-1+ eTreg cells in HPDs, resulting in inhibition of antitumor immunity. The presence of actively proliferating PD-1+ eTreg cells in tumors is therefore a reliable marker for HPD. Depletion of eTreg cells in tumor tissues would be effective in treating and preventing HPD in PD-1 blockade cancer immunotherapy.

Keywords: PD-1; hyperprogressive disease; immune-checkpoint blockade; regulatory T cells.


Conflict of interest statement

Conflict of interest statement: The Sponsor declares a conflict of interest. Y. Togashi has received honoraria and grants from Ono Pharmaceutical as to this work, honoraria and grants from Bristol-Myers Squibb and AstraZeneca, and honoraria from Chugai Pharmaceutical and Merck Sharp & Dohme (MSD) outside of this study. K.S. received honoraria and grants from Ono Pharmaceutical and Bristol-Myers Squibb and grants from MSD outside of this study. H.N. received honoraria and grants from Ono Pharmaceutical as to this work, honoraria and grants from Bristol-Myers Squibb and Chugai Pharmaceutical, and grants from Taiho Pharmaceutical, Daiichi-Sankyo, Kyowa-Hakko Kirin, Zenyaku Kogyo, Astellas Pharmaceutical, Sysmex, and BD Japan outside of this study. Other authors declare no competing financial interests.

Figures

Fig. 1.
Fig. 1.
Clinical course of an HPD patient and PD-1 expression by various T cell fractions in tumors and the periphery. (A) Clinical course of an HPD patient. A 73-y-old male with an MDM2 amplification (case 3 in SI Appendix, Table S2) received anti–PD-1 mAb (nivolumab) as fourth-line treatment. After two doses of anti–PD-1 mAb, his performance status became poor, and the computed tomography showed rapid disease progression diagnosed as HPD. Fifty-five days after the initial administration of anti–PD-1 mAb, he died of tumor progression. (B) TILs and PBMCs collected from 14 GC patients before anti–PD-1 mAb treatment were subjected to flow cytometry. Representative flow cytometry plots of CD4+ T cells (CD45RA and FoxP3) and CD8+ T cells (CCR7 and CD45RA) are shown. (C) Frequency of CD45RAFoxP3highCD4+ eTreg cells in 14 GC patients. (D and E) PD-1 expression by each CD4+ and CD8+ T cell fraction. TILs and PBMCs collected from 14 GC patients before anti–PD-1 mAb treatment were subjected to flow cytometry. Representative flow cytometry staining for PD-1 by each CD4+ and CD8+ T cell fraction. Red, TILs; blue, PBMCs; gray, isotype control (D). Summary of PD-1 expression by each CD4+ and CD8+ T cell fraction in 14 GC patients (E). Red circle, HPD patients; black circle, non-HPD patients; naive (CCR7+CD45RA+); CM, central memory (CCR7+CD45RA); EM, effector memory (CCR7CD45RA); TEMRA, terminally differentiated effector memory (CCR7CD45RA+).
Fig. 2.
Fig. 2.
Immunological features of HPD patients. (A and B) TILs and PBMCs collected from 14 GC patients before and after anti–PD-1 mAb treatment were subjected to flow cytometry. (A, Left) Representative flow cytometry plots for eTreg cells of kinetic changes of eTreg cells in TILs from pretreatment to first evaluation. (A, Right) Summaries of kinetic changes of eTreg cells in two HPD patients and 12 non-HPD patients. (B, Left) Representative staining of Ki67 by eTreg cells in TILs of kinetic changes from pretreatment to first evaluation. Black, anti–PD-1 mAb (−); red, anti–PD-1 mAb (+); gray, isotype control. (B, Right) Summary of kinetic changes of Ki67+ eTreg cells in two HPD patients and 12 non-HPD patients. One patient who experienced HPD without any MDM2 gene alterations had very high Ki67+ eTreg cell infiltration at HPD state (an arrowhead; case 1 in SI Appendix, Table S2). n.s., not significant. (C) FFPE slides of case 1 before and after treatment were subjected to immunohistochemical staining of tumor-infiltrating Treg cells.
Fig. 3.
Fig. 3.
Phenotypic and functional differences between PD-1+and PD-1 eTreg cells. (A and B) TILs and PBMCs collected from 14 GC patients before anti–PD-1 mAb treatment as in Fig. 1 were subjected to flow cytometry. Representative staining for PD-1, CTLA-4, Ki-67, and FoxP3 of PD-1+ and PD-1 eTreg cells from TILs or PBMCs. Naive Treg cells were used to demarcate PD-1+ and PD-1 eTreg cell fractions. Red, PD-1+ eTreg cells; blue, PD-1 eTreg cells; gray, isotype control (A). Summary for expression level detected by MFI (Mean Fluorescence Intensity) of PD-1, CTLA-4, Ki-67, and FoxP3 in PD-1+ and PD-1 eTreg cells in 14 GC patients (B). MFI for each molecule relative to MFI of PD-1 eTreg cells in PBMCs were summarized. n.s., not significant.
Fig. 4.
Fig. 4.
Role of PD-1 in Treg cell-mediated immune suppression. (A and B) PD-1+CD45RACD25highCD4+ T cells (eTreg cells) were sorted from PBMCs, and CFSE-labeled CD8+ T cells (Tresp cells) from PBMCs were cocultured with the indicated ratio of the sorted PD-1+ eTreg cells for 5 d with anti-CD3 mAb and irradiated APCs. Proliferation of Tresp cells was determined by CFSE dilution. Representative CFSE staining (A) and percent of proliferating Tresp cells in the cultures with the indicated ratio of Treg cells and Tresp cells (B). (C) eTreg cells in the cultures were subjected to flow cytometry to examine activation and proliferative status. (Top) Phenotypic changes (PD-1, CTLA-4, and CD28 expression) and proliferative capacity (Ki-67 expression) of eTreg cells with/without anti–PD-1 mAb (nivolumab). Black, anti–PD-1 mAb (−); red, anti–PD-1 mAb (+); gray, isotype control. (Bottom) Summary for expression levels detected by MFI of PD-1, CTLA-4, CD28, and Ki-67 of eTreg cells with/without anti–PD-1 mAb in four healthy individuals. (D) Proliferation of Treg cells. PD-1 or PD-1+ eTreg cells were sorted from PBMCs of healthy individuals and cultured with/without PD-L1 Fc Ig and/or anti–PD-1 mAb in the presence of anti-CD3 mAb and anti-CD28 mAb. Forty-eight hours after incubation, the proliferation of PD-1 or PD-1+ eTreg cells was evaluated by WST-1 assay. Ratio of the absorbance at 48 to 0 h is shown.
Fig. 5.
Fig. 5.
Strong proliferation and immunosuppressive function of murine Treg cells with PD-1 deficiency. (AC) Spleen cells from 9- to 10-wk-old CD4CreFDG and CD4CrePD1floxedFDG mice were subjected to flow cytometry. Representative flow cytometry plots of activated CD44+CD62L cells in FoxP3+CD4+ Treg cells, FoxP3CD4+ Tconv cells, and CD8+ T cells in the indicated mice are shown (A). Summary for the percentage of activated (CD44+CD62L) cells in each cell population (B). Representative staining (Top) and summary (Bottom) of proliferating (Ki67+) Treg cells, Tconv cells, and CD8+ T cells (C). n = 4 per each group. Blue, CD4CreFDG mouse; red, CD4CrePD1floxedFDG mouse; gray, negative stain control. (D) PD-1–intact (wild-type; WT) and PD-1–deficient (knockout; KO) Treg and Tconv cells were collected from CD4CreFDG and CD4CrePD1floxedFDG mice, respectively. PD-1–intact and PD-1–deficient Tconv cells were stained with CellTrace violet (CTV) and cocultured with either PD-1–intact or PD-1–deficient Treg cells at the indicated ratios of Treg cells and Tresp cells. After 3 d culture, the number of proliferating cells was measured by CTV dilution. (E) Bone marrow chimeric (BMC) mice were generated by transferring bone marrow (BM) cells comprising 70% CD45.1 and 30% CD45.2 CD4CrePD1floxed FDG into lethally irradiated recipient CD45.1 mice. DT was administered in BMC mice to deplete PD-1–deficient CD45.2+ Treg cells. Five days after DT treatment, spleen cells were collected and subjected to flow cytometry. Representative staining of CD4+ T cells in spleens (Left) and percentages of proliferating (Ki67+) Treg cells and Tconv cells (Right). n = 4–5 in each group. (F) PD-1–intact Treg cells were cocultured with PD-1–deficient Tconv cells labeled with CTV in the presence of either anti–PD-1 or isotype-matched IgG mAb. The number of FoxP3+CD4+ Treg cells recovered (Left) and the number of proliferating Tconv cells (Right) are shown. Numbers on flow cytometry plots indicate percentages of gated populations. Data are representative of at least two independent experiments.
Fig. 6.
Fig. 6.
Increased tumor growth by PD-1–deficient Treg cells. (A) C57BL/6 mice were inoculated with B16F0 melanoma cells in the right rear flank. Fifteen days after inoculation, T cells were prepared from tumors and draining inguinal lymph nodes and subjected to flow cytometry. Representative flow cytometry staining for PD-1 expressed by Treg cells (red), Tconv cells (blue), and CD8+ T cells (green) in TILs (Top) and Ki67 expressed by TIL Treg cells (red) from tumor and PD-1+ Treg cells (blue) and PD-1 Treg cells (green) from draining lymph nodes (Bottom). (B) C57BL/6 mice were lympho-depleted by 6-Gy irradiation and then were transferred with spleen cells from CD4CrePD1floxedFDG mice and Treg cells from either FoxP3IRES-Cre or FoxP3IRES-CrePD1floxed mice. After cell transfer, mice were injected s.c. with B16F0 cells. DT was administered intraperitoneally 3 d after cell transfer to deplete Treg cells from the CD4CrePD1floxedFDG transferred fraction. Tumor growth of B16 tumors was measured over 18 d. (C) Irradiated (6 Gy) CD45.2 B6 mice were transferred with CD45.2 CD4CrePD1floxedFDG spleen cells and PD-1–intact CD45.1 Treg cells. Mice were injected with B16 tumor cells and DT as in B, and anti–PD-1 or isotype-matched IgG mAb was administered on days 5, 10, and 15. Tumor growth of B16 tumors was measured over 18 d (Left). Tumor masses measured on day 18 are shown (Right). (D) Tumor-draining lymph nodes in anti–PD-1 mAb-treated or control mice were collected on day 18 posttransfer to assess transferred CD45.1+ Treg cells. Representative flow cytometry staining (Left) and percentage (Right) of proliferating (Ki67+) transferred CD45.1+ Treg cells from both groups. Data are representative of at least two independent experiments.

References

    1. Zou W, Wolchok JD, Chen L. PD-L1 (B7-H1) and PD-1 pathway blockade for cancer therapy: Mechanisms, response biomarkers, and combinations. Sci Transl Med. 2016;8:328rv4. - PMC - PubMed
    1. Pardoll DM. The blockade of immune checkpoints in cancer immunotherapy. Nat Rev Cancer. 2012;12:252–264. - PMC - PubMed
    1. Topalian SL, et al. Safety, activity, and immune correlates of anti-PD-1 antibody in cancer. N Engl J Med. 2012;366:2443–2454. - PMC - PubMed
    1. Brahmer JR, et al. Safety and activity of anti-PD-L1 antibody in patients with advanced cancer. N Engl J Med. 2012;366:2455–2465. - PMC - PubMed
    1. Hodi FS, et al. Improved survival with ipilimumab in patients with metastatic melanoma. N Engl J Med. 2010;363:711–723. - PMC - PubMed

Publication types

MeSH terms