

Coupling carbon and energy fluxes in the North Pacific Subtropical Gyre
- PMID: 31028256
- PMCID: PMC6486601
- DOI: 10.1038/s41467-019-09772-z
Coupling carbon and energy fluxes in the North Pacific Subtropical Gyre
Abstract
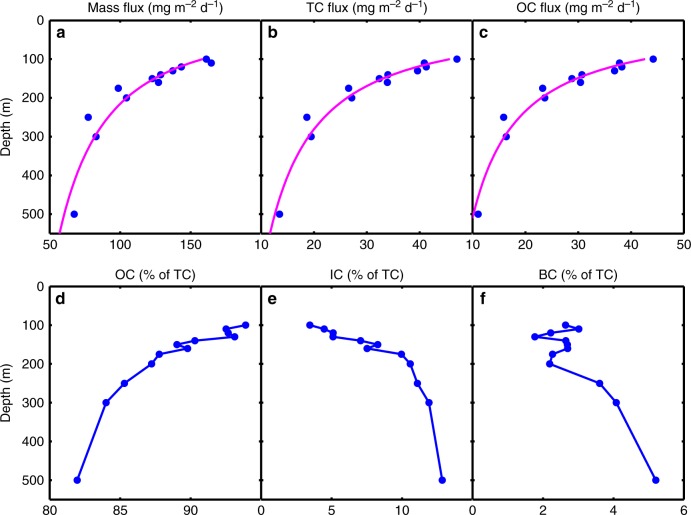
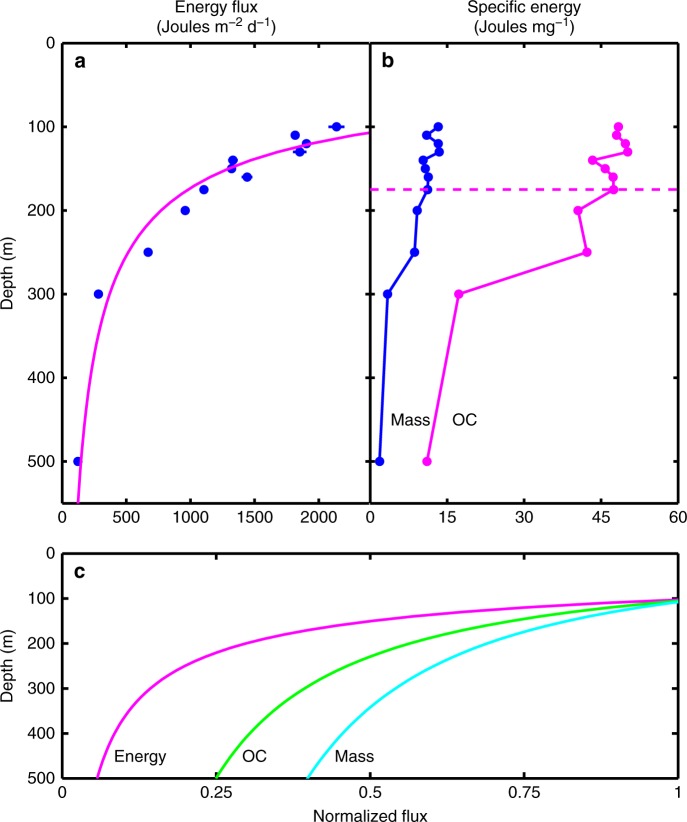
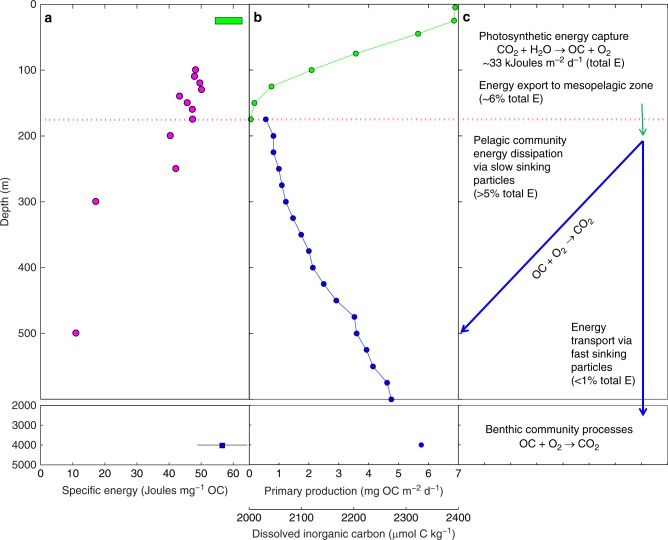
The major biogeochemical cycles of marine ecosystems are driven by solar energy. Energy that is initially captured through photosynthesis is transformed and transported to great ocean depths via complex, yet poorly understood, energy flow networks. Herein we show that the chemical composition and specific energy (Joules per unit mass or organic carbon) of sinking particulate matter collected in the North Pacific Subtropical Gyre reveal dramatic changes in the upper 500 m of the water column as particles sink and age. In contrast to these upper water column processes, particles reaching the deep sea (4000 m) are energy-replete with organic carbon-specific energy values similar to surface phytoplankton. These enigmatic results suggest that the particles collected in the abyssal zone must be transported by rapid sinking processes. These fast-sinking particles control the pace of deep-sea benthic communities that live a feast-or-famine existence in an otherwise energy-depleted habitat.
Conflict of interest statement
The authors declare no competing interests.
Figures
References
-
- Volk, T. & Hoffert, M. I. In The Carbon Cycle and Atmospheric CO2: Natural Variations Archaean to Present (eds. Sundquist, E. T. & Broecker, W. S.) 99–110 (American Geophysical Union, Washington, D.C., 1985).
-
- Karl David M. Solar energy capture and transformation in the sea. Elementa: Science of the Anthropocene. 2014;2:000021.
-
- Falkowski, P. G. & Raven, J. A. Aquatic Photosynthesis, 2nd ed. (Princeton University Press, New Jersey, 2007).
-
- Quay PD, Peacock C, Björkman K, Karl DM. Measuring primary production rates in the ocean: Enigmatic results between incubation and non-incubation methods at Station ALOHA. Glob. Biogeochem. Cycles. 2010;24:GB3014. doi: 10.1029/2009GB003665. - DOI
-
- Ferrón S, et al. Application of membrane inlet mass spectrometry to measure aquatic gross primary production by the ‘18O in vitro method. Limnol. Oceanogr. Methods. 2016;14:610–622. doi: 10.1002/lom3.10116. - DOI
Publication types
Grants and funding
LinkOut - more resources
Full Text Sources
