. 2019 Jun:94:103185.
doi: 10.1016/j.jbi.2019.103185. Epub 2019 Apr 25.

Machine learning for phenotyping opioid overdose events

Affiliations

Machine learning for phenotyping opioid overdose events

Jonathan Badger et al. J Biomed Inform. 2019 Jun.

Abstract

Objective: To develop machine learning models for classifying the severity of opioid overdose events from clinical data.

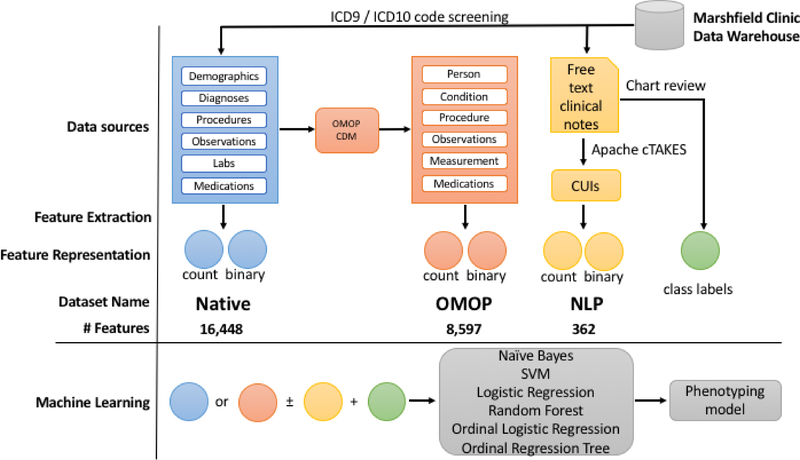
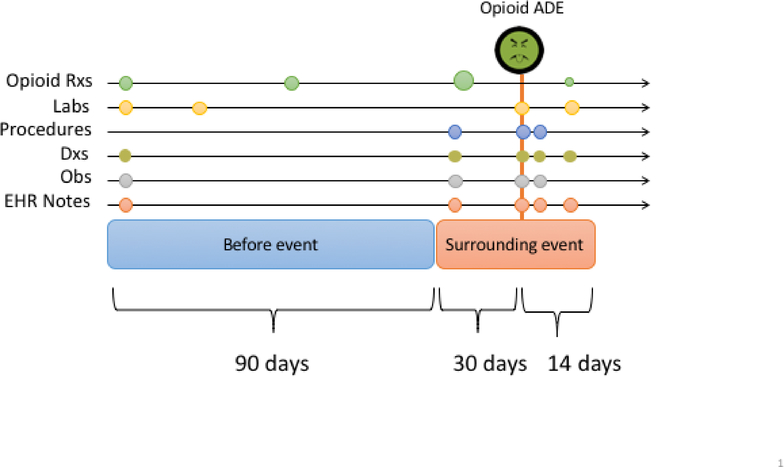
Materials and methods: Opioid overdoses were identified by diagnoses codes from the Marshfield Clinic population and assigned a severity score via chart review to form a gold standard set of labels. Three primary feature sets were constructed from disparate data sources surrounding each event and used to train machine learning models for phenotyping.

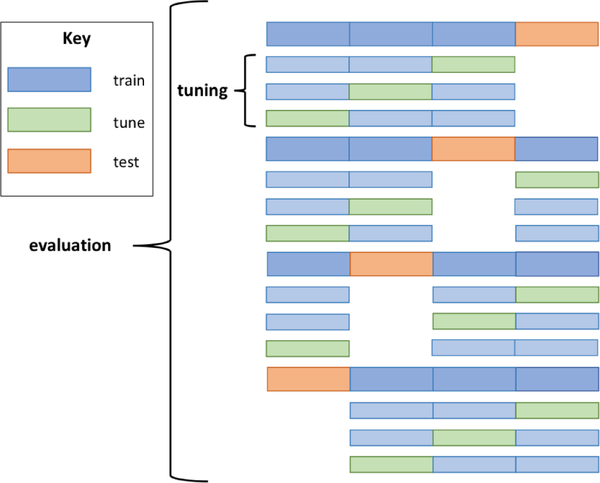
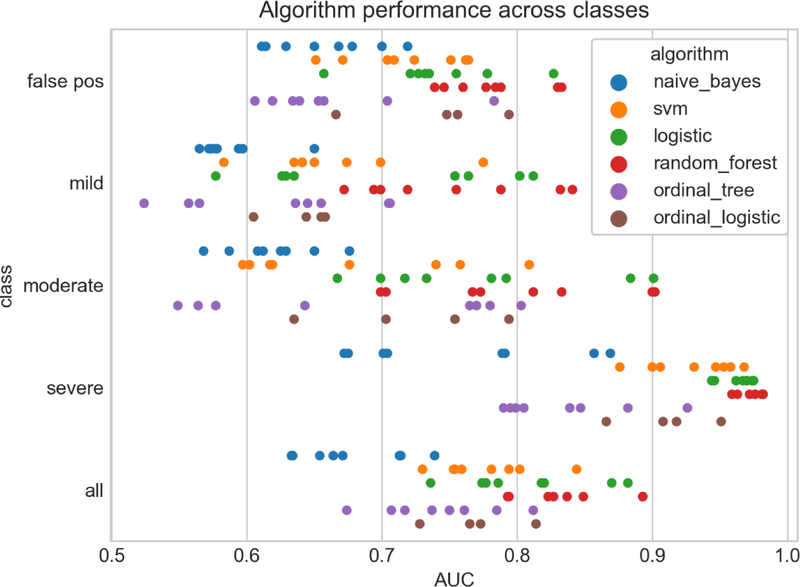
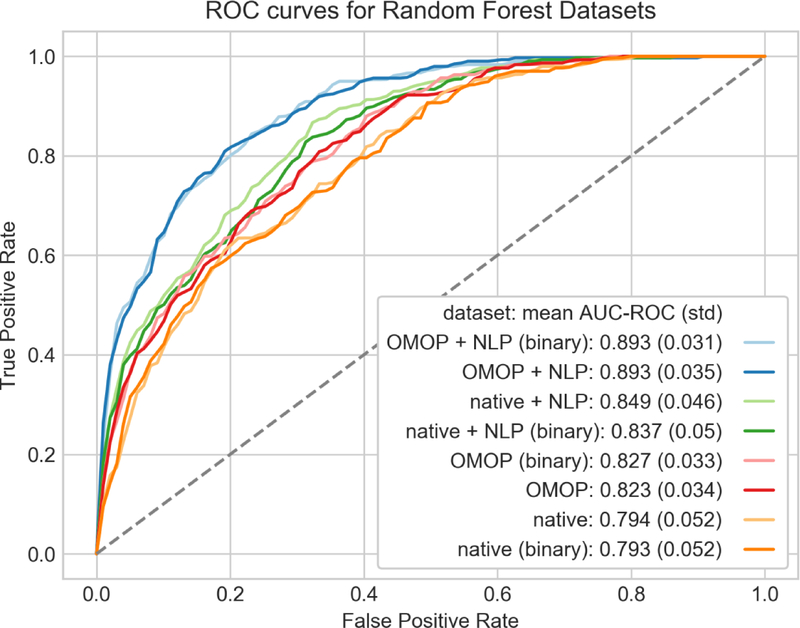
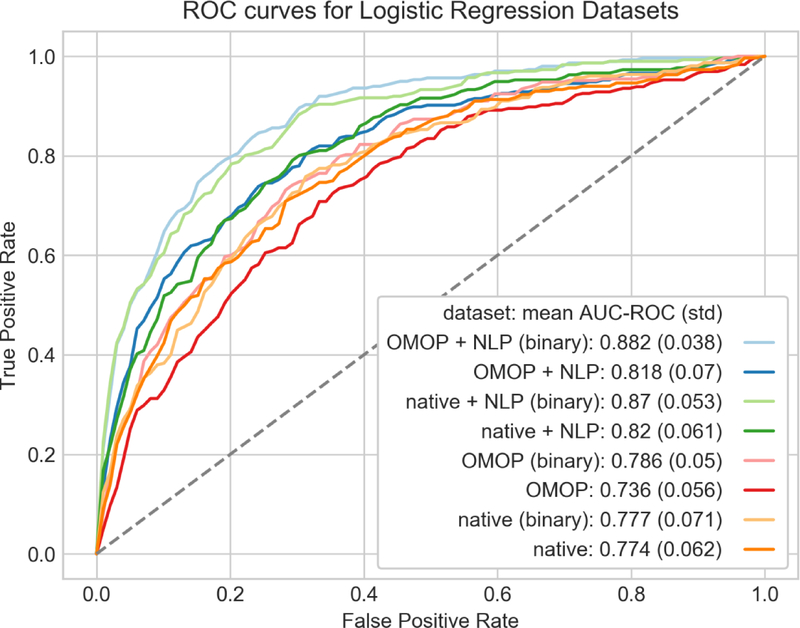
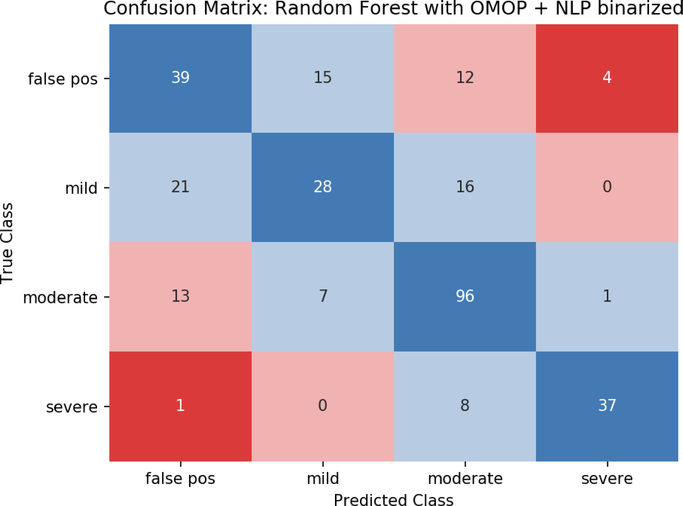
Results: Random forest and penalized logistic regression models gave the best performance with cross-validated mean areas under the ROC curves (AUCs) for all severity classes of 0.893 and 0.882 respectively. Features derived from a common data model outperformed features collected from disparate data sources for the same cohort of patients (AUCs 0.893 versus 0.837, p value = 0.002). The addition of features extracted from free text to machine learning models also increased AUCs from 0.827 to 0.893 (p value < 0.0001). Key word features extracted using natural language processing (NLP) such as 'Narcan' and 'Endotracheal Tube' are important for classifying overdose event severity.

Conclusion: Random forest models using features derived from a common data model and free text can be effective for classifying opioid overdose events.

Keywords: Electronic health record; Machine learning; Opioid; Overdose; Phenotype.


Figures

Fig. 1.
Fig. 1.
Phenotyping pipeline. Features for each dataset are labeled as native, OMOP, and NLP (blue, salmon, and yellow respectively). For machine learning models, native or OMOP datasets were used with or without NLP and using either counts or binary features for each algorithm tested.
Fig. 2.
Fig. 2.
Feature construction. For each overdose event, counts for feature were collected in two intervals. A 90 day interval preceding the overdose event, and in a 44 day period surrounding the event date.
Fig. 3
Fig. 3
Example of nested cross-validation. Data are split into 4 folds and colored as train data (blue) and held out data (green and orange). Inner cross-validation loops are used for hyperparameter tuning (light blue and light green). The optimal hyperparameter setting(s) from each inner loop is supplied to a model trained in the outer loop (blue) and evaluated on a held-out test set (orange). Expected performance of the method is measured by averaging over all four folds. This procedure is the current methodological gold standard for tuning and evaluation in the field of machine learning.
Fig. 4
Fig. 4
Visualization of SVM classification. Support vectors are used to form the margin and define the decision boundary. The hyperparameter C is used to balance a tradeoff between the size of the margin and number of misclassified examples (ξ1 and ξ2).
Fig. 5.
Fig. 5.
Strip plot of algorithm performance across classes. Each point represents the mean AUC after 10-fold cross validation for a given overdose class, algorithm, combination of features, and feature representation. Class ‘all’ is the micro-averaged mean AUC across all classes.
Fig. 6.
Fig. 6.
ROC curves of random forest models using combinations of features and feature representation. Each curve was generated using 10 fold-cross validation with micro-averaging across the four severity classes. Feature representations (binary or counts) are paired by color and ordered from lowest to highest mean AUC in the legend.
Fig. 7.
Fig. 7.
ROC curves of penalized logistic regression models using combinations of features and feature representation. Each curve was generated using 10-fold cross-validation with micro-averaging across the four severity classes. Feature representations (binary or counts) are paired by color.
Fig. 8.
Fig. 8.
Confusion matrix using random forest with OMOP + NLP binary features. Perfect predictions lie along the diagonal(blue) with increasing errors in class assignment shown in light blue, pink, and red.

References

    1. Volkow ND, McLellan AT, Opioid Abuse in Chronic Pain — Misconceptions and Mitigation Strategies, N. Engl. J. Med 374 (2016) 1253–1263. doi:10.1056/NEJMra1507771. - DOI - PubMed
    1. Boyer EW, Management of Opioid Analgesic Overdose, N. Engl. J. Med 367 (2012) 146–155. doi:10.1056/NEJMra1202561. - DOI - PMC - PubMed
    1. Quinones S, Dreamland: the true tale of America’s opiate epidemic, Paperback edition, Bloomsbury Press, New York, 2016.
    1. Cobaugh DJ, Gainor C, Gaston CL, Kwong TC, Magnani B, McPherson ML, Painter JT, Krenzelok EP, The opioid abuse and misuse epidemic: Implications for pharmacists in hospitals and health systems, Am. J. Health. Syst. Pharm 71 (2014) 1539–1554. doi:10.2146/ajhp140157. - DOI - PubMed
    1. Manchikanti L, Helm S, Fellows B, Janata JW, Pampati V, Grider JS, Boswell MV, Opioid epidemic in the United States, Pain Physician. 15 (2012) ES9–38. - PubMed

Publication types

Substances

LinkOut - more resources