. 2019 Aug;27(8):1174-1184.
doi: 10.1016/j.joca.2019.04.007. Epub 2019 Apr 25.

Characterization of synovial fluid metabolomic phenotypes of cartilage morphological changes associated with osteoarthritis

Affiliations

Characterization of synovial fluid metabolomic phenotypes of cartilage morphological changes associated with osteoarthritis

A K Carlson et al. Osteoarthritis Cartilage. 2019 Aug.

Abstract

Objective: Osteoarthritis (OA) is a multifactorial disease with etiological heterogeneity. The objective of this study was to classify OA subgroups by generating metabolomic phenotypes from human synovial fluid.

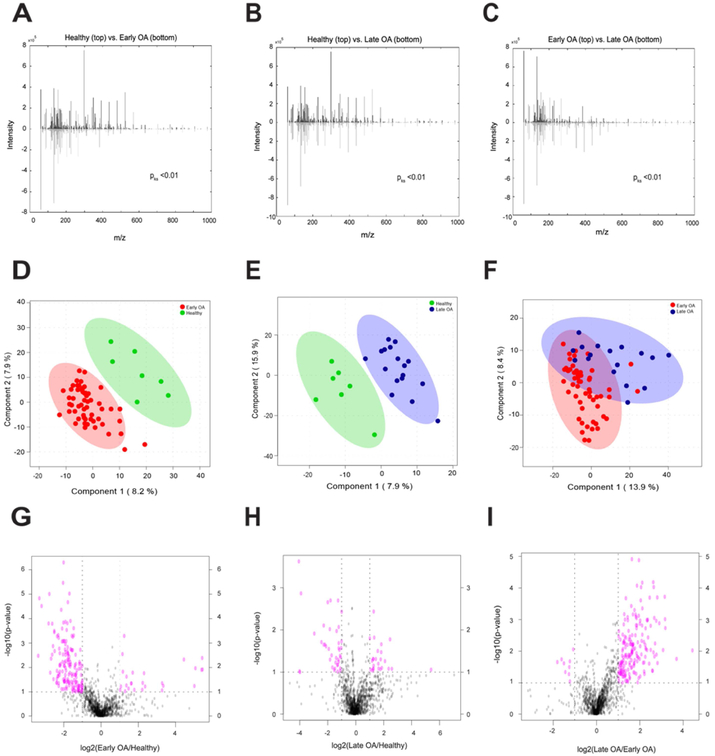
Design: Post mortem synovial fluids (n = 75) were analyzed by high performance-liquid chromatography mass spectrometry (LC-MS) to measure changes in the global metabolome. Comparisons of healthy (grade 0), early OA (grades I-II), and late OA (grades III-IV) donor populations were considered to reveal phenotypes throughout disease progression.

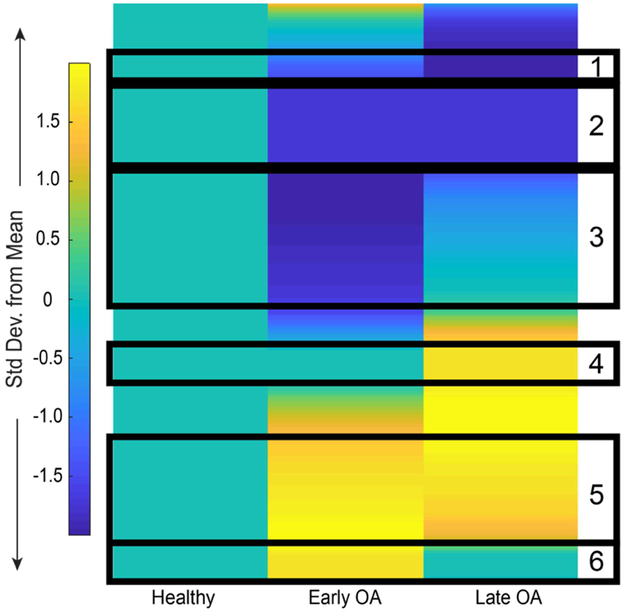
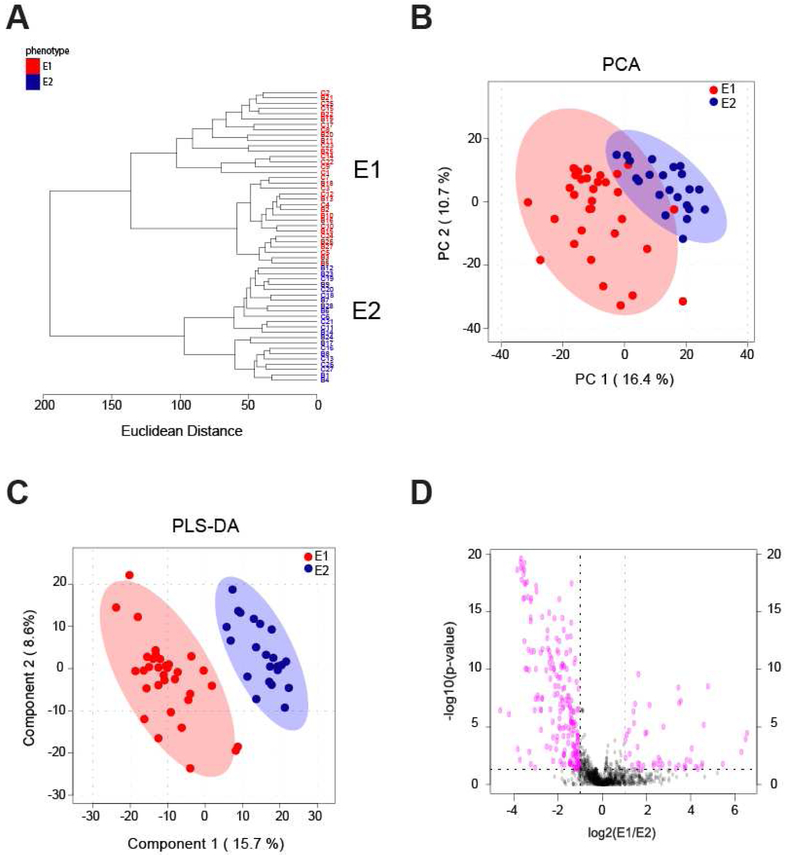
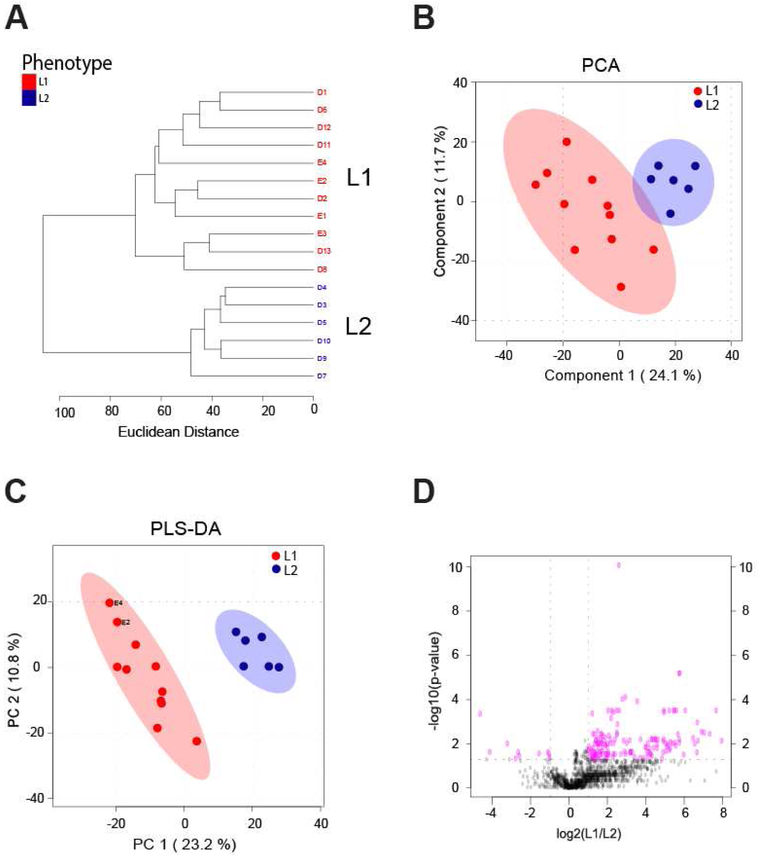
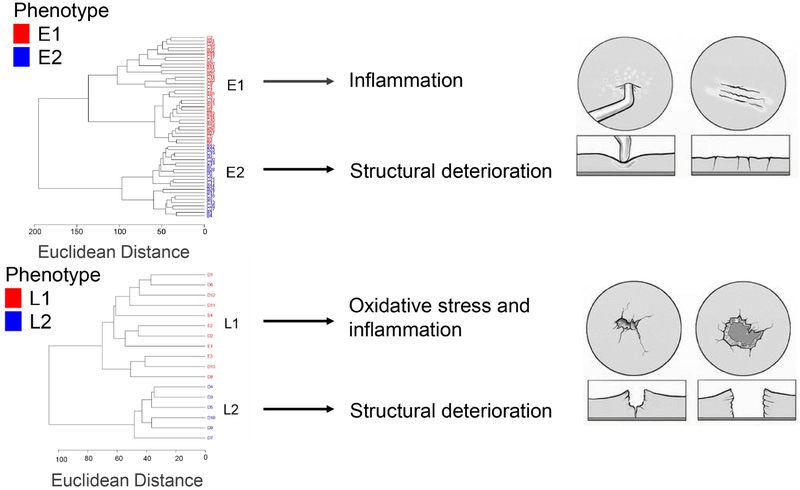
Results: Global metabolomic profiles in synovial fluid were distinct between healthy, early OA, and late OA donors. Pathways differentially activated among these groups included structural deterioration, glycerophospholipid metabolism, inflammation, central energy metabolism, oxidative stress, and vitamin metabolism. Within disease states (early and late OA), subgroups of donors revealed distinct phenotypes. Synovial fluid metabolomic phenotypes exhibited increased inflammation (early and late OA), oxidative stress (late OA), or structural deterioration (early and late OA) in the synovial fluid.

Conclusion: These results revealed distinct metabolic phenotypes in human synovial fluid, provide insight into pathogenesis, represent novel biomarkers, and can move toward developing personalized interventions for subgroups of OA patients.

Keywords: Biomarkers; Mass spectrometry; Metabolomics; Osteoarthritis; Synovial fluid; Systems biology.


Conflict of interest statement

Conflict of Interest

RKJ owns stock in Beartooth Biotech, which was not involved in this study.

Figures

Figure 1.
Figure 1.
Global metabolomes are distinct between cohorts. (A-C) The cumulative distribution of metabolites between groups were distinct from one another. KS-tests comparing the median metabolite intensity distributions between groups revealed significantly (pks<0.01) different metabolomic profiles. Mirrored metabolite distributions display differences between groups. (D-F) PLS-DA displayed differences in metabolomic profiles of between groups, revealing clear separation between healthy and OA donors and some separation between early and late OA donors. The first two components are plotted against one another with their contribution to the overall variance. 95% confidence ellipses illustrate class separation. (G-I) Volcano plot analysis between groups reveal metabolite features upregulated and downregulated by p-value and fold change analysis. Dashed lines indicate the p-value threshold of 0.05 (horizontal) and fold change threshold of 2 (vertical). The upper right and left quadrants contain significant (p<0.05) upregulated and downregulated features with a fold change greater than twofold. Metabolite features in the upper right and left quadrants were assessed for enriched pathways reported in Supplemental Table 2.
Figure 2.
Figure 2.
Metabolic changes in SF during early and late stage OA. Clustergram of median global metabolomic profiles of early and late OA SF normalized to healthy SF display patterns of metabolite expression with disease. Arbitrarily selected clusters of co-regulated metabolite features are boxed in black and enriched for relevant pathways in Supplemental Table 3.
Figure 3.
Figure 3.
Phenotypes in early OA synovial fluid. (A) Unsupervised HCA of all early OA donors. Two clusters of donors were identified and labeled as phenotype E1 (red) and phenotype E2 (blue). E1 contained 33 donors and E2 contained 22. Line length represents Euclidean distances between donors and clusters. (B) Unsupervised PCA of all early OA donors reveals separation of early OA phenotypes. The first two components are associated with 27.1% of the variation between phenotypes. (E1=red; E2=blue). (C) Supervised PLS-DA further illustrated the separation between phenotypes (E1=red; E2=blue) with PC1 and PC2 accounting for 24.3% of the variance. (D) Volcano plot visualization of differentially regulated metabolite features by Student’s t-test significance and fold change analysis (E1:E2). The p-value threshold is represented by the horizontal dashed line (FDR-corrected p<0.05), and the vertical lines represent the fold change threshold (greater than twofold change). Metabolite features in the upper right and left quadrants (p<0.05 and greater than twofold change) were enriched for relevant pathways reported in Table 3, with the full list of perturbed pathways in Supplemental Table 2.
Figure 4.
Figure 4.
Phenotypes in late OA synovial fluid. (A) Unsupervised HCA of all late OA donors. Two clusters of donors were identified and labeled as phenotype L1 (red) and phenotype L2 (blue). L1 contained 11 donors, and L2 contained 6 donors. Line length represents Euclidean distances between donors and clusters. (B) Unsupervised PCA of all early OA donors reveals separation of early OA phenotypes. The first two PCs are associated with 35.8% of the variation between phenotypes. (L1=red; L2=blue). (C) Supervised PLS-DA further illustrated the separation between phenotypes (L1=red; L2=blue), with component 1 and component 2 accounting for 34% of the overall variance. (D) Volcano plot visualization of differentially regulated metabolite features by Student’s t-test significance and fold change analysis (L1:L2). The p-value threshold is represented by the horizontal dashed line (FDR-corrected p<0.05) and the vertical lines represent the fold change threshold (greater than twofold change). Metabolite features in the upper right and left quadrants were assessed for enriched pathways reported in Supplemental Table 2.
Figure 5
Figure 5
Metabolomic phenotypes of osteoarthritis. Cluster analysis of our data revealed distinct metabolic phenotypes (n=75). Within Outerbridge grades I and II (early OA), metabolite features clustered into an E1 phenotype associated with inflammatory pathways and an E2 phenotype associated with structural degradation pathways. Within Outerbridge grades III and IV, metabolites clustered into an L1 phenotype associated with oxidative stress and inflammation and an L2 phenotype associated with structural degradation. These data emphasize the heterogeneity of OA. Sketch of cartilage defects adapted with permission from Lasanianos and Kanakaris Traumatic and Orthopaedic Classifications 2014.

References

    1. Disease GBD, Injury I, Prevalence C. Global, regional, and national incidence, prevalence, and years lived with disability for 328 diseases and injuries for 195 countries, 1990-2016: a systematic analysis for the Global Burden of Disease Study 2016. Lancet 2017; 390: 1211–1259. - PMC - PubMed
    1. Hunter DJ, Nevitt M, Losina E, Kraus V. Biomarkers for osteoarthritis: current position and steps towards further validation. Best Pract Res Clin Rheumatol 2014; 28: 61–71. - PMC - PubMed
    1. Loeser RF, Goldring SR, Scanzello CR, Goldring MB. Osteoarthritis: a disease of the joint as an organ. Arthritis Rheum 2012; 64: 1697–1707. - PMC - PubMed
    1. Kulkarni K, Karssiens T, Kumar V, Pandit H. Obesity and osteoarthritis. Maturitas 2016; 89: 22–28. - PubMed
    1. Guilak F. Biomechanical factors in osteoarthritis. Best Pract Res Clin Rheumatol 2011; 25: 815–823. - PMC - PubMed

Publication types