. 2019 Jun 5;102(5):1037-1052.e7.
doi: 10.1016/j.neuron.2019.03.037. Epub 2019 Apr 24.

Central Amygdala Prepronociceptin-Expressing Neurons Mediate Palatable Food Consumption and Reward

Affiliations

Central Amygdala Prepronociceptin-Expressing Neurons Mediate Palatable Food Consumption and Reward

J Andrew Hardaway et al. Neuron. .

Erratum in

  • Central Amygdala Prepronociceptin-Expressing Neurons Mediate Palatable Food Consumption and Reward.
    Hardaway JA, Halladay LR, Mazzone CM, Pati D, Bloodgood DW, Kim M, Jensen J, DiBerto JF, Boyt KM, Shiddapur A, Erfani A, Hon OJ, Neira S, Stanhope CM, Sugam JA, Saddoris MP, Tipton G, McElligott Z, Jhou TC, Stuber GD, Bruchas MR, Bulik CM, Holmes A, Kash TL. Hardaway JA, et al. Neuron. 2019 Jun 5;102(5):1088. doi: 10.1016/j.neuron.2019.04.036. Neuron. 2019. PMID: 31170393 Free PMC article. No abstract available.

Abstract

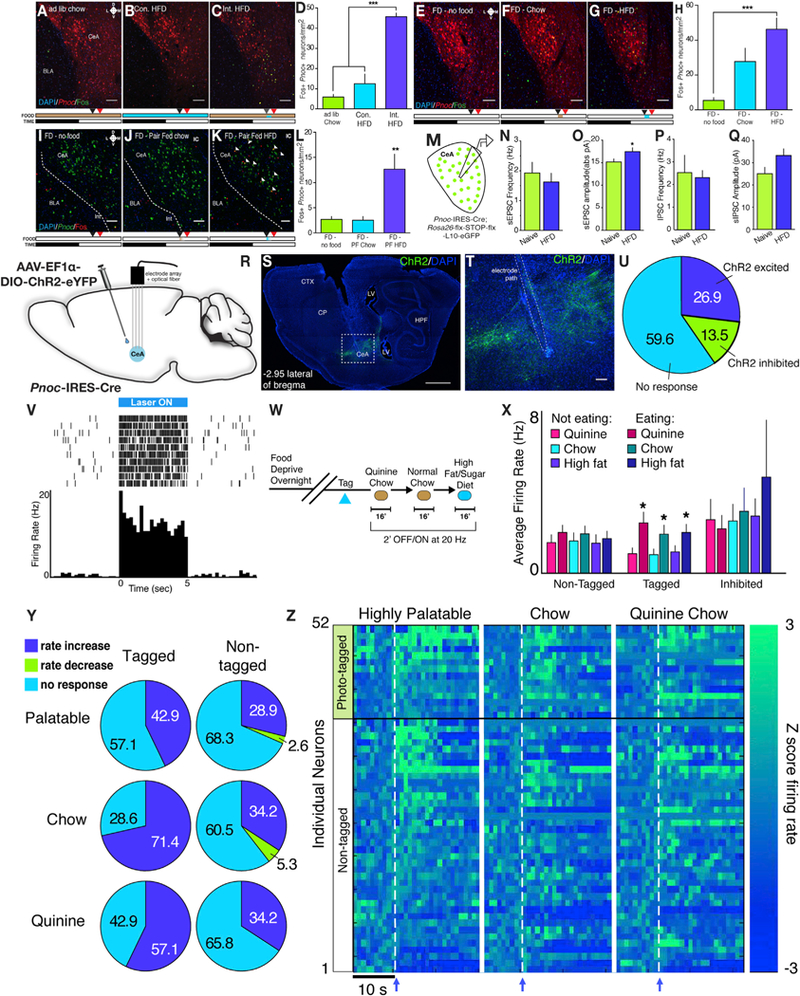
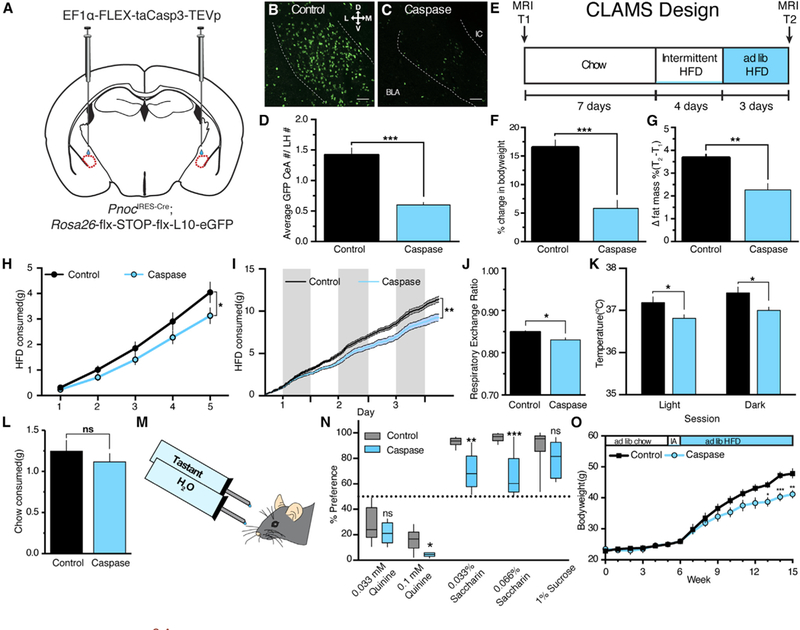
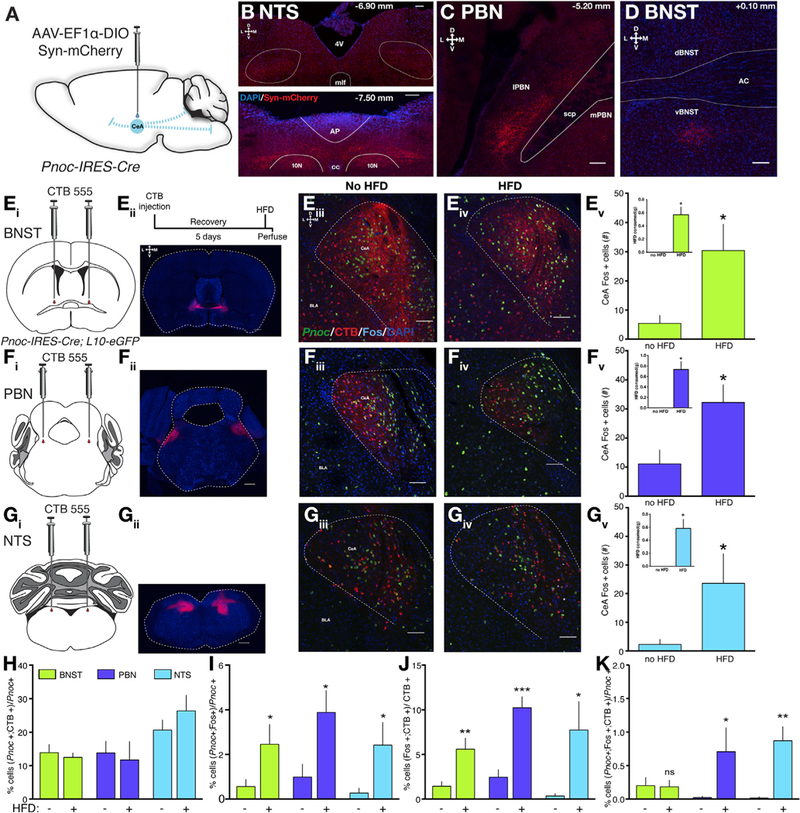
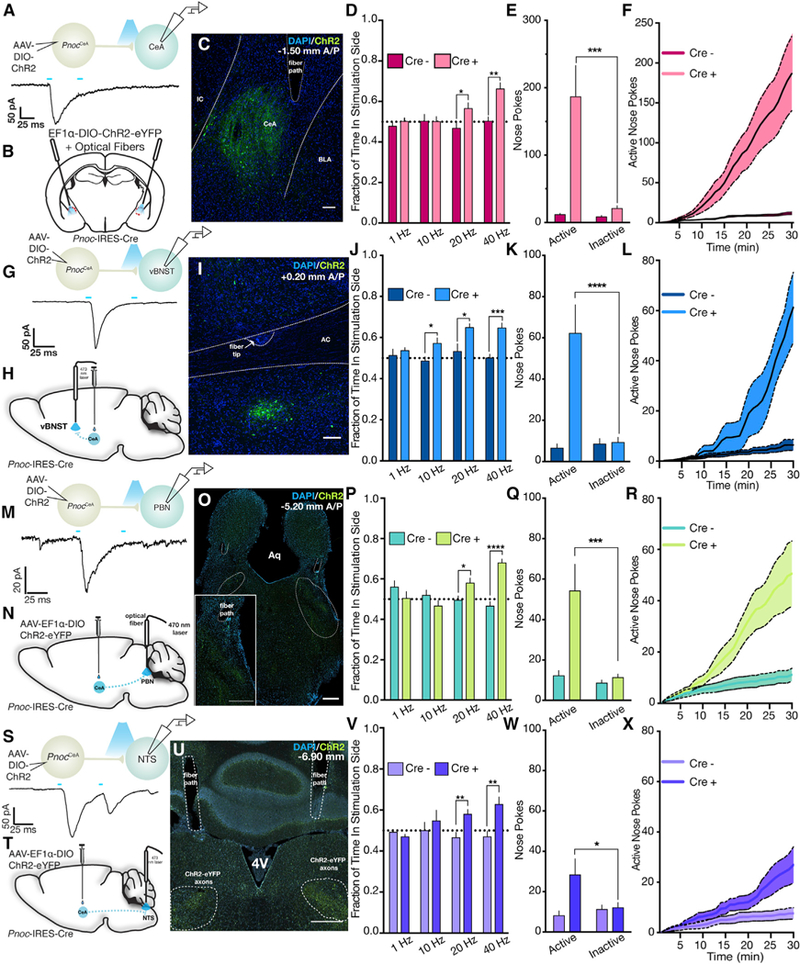
Food palatability is one of many factors that drives food consumption, and the hedonic drive to feed is a key contributor to obesity and binge eating. In this study, we identified a population of prepronociceptin-expressing cells in the central amygdala (PnocCeA) that are activated by palatable food consumption. Ablation or chemogenetic inhibition of these cells reduces palatable food consumption. Additionally, ablation of PnocCeA cells reduces high-fat-diet-driven increases in bodyweight and adiposity. PnocCeA neurons project to the ventral bed nucleus of the stria terminalis (vBNST), parabrachial nucleus (PBN), and nucleus of the solitary tract (NTS), and activation of cell bodies in the central amygdala (CeA) or axons in the vBNST, PBN, and NTS produces reward behavior but did not promote feeding of palatable food. These data suggest that the PnocCeA network is necessary for promoting the reinforcing and rewarding properties of palatable food, but activation of this network itself is not sufficient to promote feeding.

Keywords: binge eating; central amygdala; nociceptin; nucleus of the solitary tract; obesity; parabrachial nucleus; reward.


Figures

Figure 1.
Figure 1.. PnocCeA Neurons Are Activated following Palatable, Calorically Dense Food Consumption.
(A)Schematic of targeting of IRES-Cre cassette into the endogenous Prepronociceptin gene. (B)Sagittal section of PnocIRES-Cre; Rosa26-flx-stop-fIx-TdTomato (AI9) mice. (C–E) Example images of Pnoc (C; red), Cre (D; green), and merge (E) mRNA expression in the CeA. Scale bars represent 50 μM. (F)Quantification of Pnoc, Cre, and double-positive cell counts across all CeA images. (G)Schematic of tissue clearing, IDISCO+, light sheet microscopy, and ClearMap workflow in PnocIRES-Cre; AI9 mice. (H)Quantification of Pnoc+ cells across the A-P axis following extraction of segmented Pnoc cell coordinates after ClearMap. (I)Schematic of ex vivo recordings of Pnoc-GFP reporter mice. (J) Average membrane capacitance (Cm) of Pnoc neurons. (K) Average membrane resistance (Rm) of Pnoc neurons. (L) Hyperpolarization-activated inward (Ih) currents in Pnoc neurons. (M) Example low-threshold bursting in response to depolarizing current step. For (J) and (K), n = 13 cells from 3 mice.
Figure 2.
Figure 2.. PnocCeA Neurons Are Activated during Feeding.
(A–D) Example images and quantification of Fos immunoreactivity in the CeA from Ai9 (TdTomato) mice being fed under ad lib chow conditions(A), continuous(B), or intermittent (C) access to high-fat diet (Int. HFD). The timeline of the experiment for each group is depicted below the image where beige denotes chow, blue denotes HFD, black arrow denotes the start of the experiment, and red denotes the time of perfusion (100 min following start). (D)Quantification of Fos from different feeding conditions (n = 3/group; one-way ANOVA with Tukey’s multiple comparisons test F(2,6)) = 49.17; p < 0.001). (E-H) Example images and quantification of Fos immunoreactivity in the CeA from reporter mice that were food deprived overnight and then provided with either no food (E), ad lib chow (F), or ad lib HFD (G). Timeline of the experiment is below. n = 4/group. (H)Quantification of Fos from refeeding experiment (n = 4/group; one-way ANOVA with Tukey’s multiple comparisons test F(2,9)) = 12.20; p = 0.0027). (I–L) Example images and quantification of Fos immunoreactivity in the CeA from Pnoc-GFP mice that were food deprived overnight and then provided with no food (I) or a nonsatiating isocaloric amount of either chow (J) or HFD (K). Arrowheads denote colabeled Fos+/Pnoc+ cells. Timeline of experiment is identical to(E)–(H).n = 5/group. (L) Quantification of Fos from refeeding experiment (n = 5/group; one-way ANOVA with Tukey’s multiple comparisons test F(2,12) = 10.20; p = 0.0026). Scale bars represent 50 μM. (M) Schematic of electrophysiological recordings from Pnoc-GFP mice. (N–Q) Synaptic transmission measurements from PnocCeA neurons in either naive or HFD-fed PnocIRES-Cre; Rosa26-flx-stop-flx-L10-GFP mice. (N) sEPSC frequency (n = 14 cells from 5 mice for naive control group and n = 29 cells from 7 mice for HFD group; unpaired Student’s t test; p = 0.5232). (O) sEPSC amplitude (n = 14 cells from 5 mice for naive control group and n = 29 cells from 7 mice for HFD group; unpaired Student’s t test; p = 0.0456). (P) sIPSC frequency (n = 9 cells from 5 mice for naive control group and n = 27 cells from 7 mice for HFD group; unpaired Student’s t test; p = 0.7966). (Q) sIPSC amplitude (n = 9 cells from 5 mice for naive control group and n = 27 cells from 7 mice for HFD group; unpaired Student’s t test; p = 0.0583). (R) Schematic of AAV-ChR2 injection and unilateral multielectrode array placement in PnocIRES-Cre mice. (S) Example sagittal image showing electrode path and viral transduction. CP, caudate putamen; CTX, cortex; HPF, hippocampal formation; LV, lateral ventricle; scale bars represent 1 mm. (T) Enlarged view of (S) showing electrode path and damage from electrolytic lesions. (U) Distribution of neurons according to responses during 10 5’ blue light pulses tagging session. (V) Raster plot and spike histogram of an example optically tagged neuron. (W) Schematic of three food exposures following optical tagging of PnocCeA neurons. (X) Raw average firing rates across non-eating and eating epochs from non-tagged, tagged, and inhibited neuron populations during laser off blocks. n = 28 non-tagged neurons, fourteen tagged neurons, and seven inhibited neurons. Data were analyzed using a 3 × 2 repeated-measures ANOVA comparing the effect of eating across each food type. (Y) Pie charts showing percent of neurons that responded to each food type in the non-tagged and tagged neuron groups using Z score changes > 2.56. (Z) Heatmaps of individual neuron responses to food consumption across three food types. Arrow and dashed line indicates the onset of chewing.
Figure 3.
Figure 3.. Ablation of PnocCeA Neurons Reduces HFD Consumption and Promotes Resistance to HFD-Induced Obesity.
(A)Schematic of CeA injection of viral Cre-dependent caspase complex in Pnoc-GFP reporter mice. (B–D) Example images and quantification of PnocCeA density in control (B) and caspase (C)-expressing animals. Scale bars represent 50 μM. (D)Data are presented normalized to counts in the uninjected and neighboring zona incerta or lateral hypothalamus from the same section. See STAR Methods for details (n = 8 caspase and 7 control mice, unpaired Student’s t test; p < 0.0001). (E)Timeline of experiment in comprehensive lab animal monitoring system (CLAMS) cages. See Figure S3 for full dataset. (F)Percent change in bodyweight from T1 to T2 in CLAMS experiment (n = 8 caspase and 7 control mice; unpaired Student’s t test; p < 0.0001). (G)Percent change in fat mass from T1 toT2 in CLAMS experiment (n = 8 caspase and 7 control mice; unpaired Student’s t test; p < 0.01). See Figure S3 forfull dataset. (H)Cumulative binge HFD intake during 4 days of intermittent access and 1st hour of access during continuous HFD period (5 intermittent access HFD sessions; n = 8 caspase and 7 control mice; two-way repeated-measures ANOVA with Sidak’s multiple comparisons test; session x group interaction; F(4,25)) = 2.928; p = 0.0294). (I)Cumulative HFD intake for continuous HFD period. Shaded columns indicate lights off (n = 8 caspase and 7 control mice; two-way repeated-measures ANOVA with Sidak’s multiple comparisons test; time x group interaction; F(137,1,781)) = 1 1.42; p < 0.0001). (J) Average respiratory exchange during the continuous HFD period (n = 8 caspase and 7 control mice; unpaired Student’s t test; p = 0.0109). (K) Core body temperatures after 3 days of continuous HFD access in the home cage (n = 8 caspase and 7 control mice; two-way ANOVA with Sidak’s multiple comparisons test; group effect; F(1,24) = 13.12; p = 0.0014). (L) Chow consumption following overnight food deprivation in control and caspase mice (n = 8 caspase and 7 control mice; unpaired Student’s t test; p = 0.4379). (M) 24-h two-bottle choice design. (N) 2-bottle choice preference for quinine, saccharin, and sucrose (n = 5 caspase and 8 control mice; unpaired Student’s t test for each tastant; p = 0.6190 [0.033 mM quinine]; p = 0.01 [0.1 mM quinine]; p = 0.001 [0.033% saccharin]; p = 0.0005 [0.066% saccharin]; p = 0.2591[1% sucrose]). For all experiments, *p < 0.05, **p < 0.01, and ***p < 0.001. (O) Average weekly bodyweights of a separate caspase and control cohort after 5 weeks of chow access, 1 week of intermittent HFD access, and 9 weeks of ad libitum HFD access. See Figure S2R for validation of this cohort (n = 7 caspase and 6 control mice; two-way repeated-measures ANOVA with Sidak’s multiple comparisons test; time x group interaction; F(15,165) = 5.672; p < 0.0001).
Figure 4.
Figure 4.. Chemogenetic Inhibition of PnocCeA Neurons Reduces Palatable, Calorically Dense Food Intake.
(A)Schematic of CeA injection of viral Cre-dependent hM4D-mCherry receptor in PnocIRES-Cre mice. (B)Representative coronal section showing CeA-specific mCherry expression. Scale bar represents 1,000 μM. (C)Ex vivo slice electrophysiological validation of hM4D function. Top: representative cell response to CNO bath application in current clamp mode is shown. Middle: representative cell response in current clamp mode to gradually increasing depolarizing current injection (rheobase) prior to and after CNO bath application is shown. Bottom: representative cell response in current clamp mode to increasing current steps is shown. (D)1-h HFD consumption in home cage during first exposure to HFD following 3 mg/kg intraperitoneal (IP) CNO injection 30 min before. p = 0.0258. Timeline of experiment depicted above where numbers indicate hours is shown. Bar graphs are from 1 h (highlighted time point). (E)Later exposure to HFD in combination with cage bedding change. p = 0.0310. (F)1-h chow consumption following food deprivation and IP CNO. p = 0.7356. (G)Fruit loop consumption during post-test home cage portion of novelty-induced suppression of feeding assay. p = 0.0089. For (D)–(G), data were analyzed using an unpaired Student’s t test, where *p < 0.05 and ** p <0.01. For all panels, n = 10 Cre+ and 11 Cre– animals.
Figure 5.
Figure 5.. PnocCeA Neurons Project to the vBNST, PBN, and NTS, and PBN/NTS-Projecting Cells Are Activated following HFD Consumption,
(A)Scheme of injection of Cre-dependent Synaptophysin-mCherry anterograde tracer in PnocIRES-Cre mice. (B)Synaptophysin-mCherry immunostaining in anterior and posterior segments of the NTS. (C)Synaptophysin-mCherry immunostaining in the ventrolateral portion of the PBN. (D)Synaptophysin-mCherry immunostaining in the ventral BNST. (Ei_iv) Schematics and example images for CTB injection into the BNST. Top right inset depicts the experimental timeline. (Ev) HFD consumption from BNST- injected animals (inset, p = 0.0006) and overall CeA Fos counts (p = 0.0148). (Fi_iv) Schematics and example images for CTB injection into the PBN. (Fv) HFD consumption from PBN-injected animals (inset, p = 0.0005) and overall CeA Fos counts (p = 0.0140). (Gi-iv) Schematics and example images for CTB injection into the NTS. (Gv) HFD consumption from NTS-injected animals (inset, p = 0.0027) and overall CeA Fos counts (p = 0.04404). (H)Percent of Pnoc cells that are colabeled with retrograde CTB. (I)Percent of Pnoc cells colabeled with Fos in naive versus HFD-fed animals. p = 0.0393, 0.0152, and 0.0414 for BNST, PBN, and NTS-injected cohort. (J) Percent of CTB cells colabeled with Fos in naive versus HFD-fed animals. p = 0.007, 0.0005, and 0.03 for BNST, PBN, and NTS-injected cohorts. (K) Percent of Pnoc cells colabeled with CTB and Fos. p = 0.4604, 0.0329, and 0.0034 for BNST, PBN, and NTS-injected cohorts, respectively. For (Ev), (Fv), (Gv), and (H)–(K), data were analyzed using a one-tailed Student’s t test between no HFD and HFD conditions within a group of animals with BNST, PBN, or NTS injections where *p < 0.05, **p < 0.01, and ***p < 0.001. For (B)–(D), (Eiii), (Eiv), (Fiii), (Fiv), (Giii), and (Giv), scale bars equal 100 μM and 50 μM, respectively. For (Eii), (Fii), and (Gii), scale bars equal 500 μM. Group n’s are BNST (HFD: 5; no HFD: 5); PBN (HFD: 4; no HFD: 5); and NTS (HFD: 4; no HFD: 4)
Figure 6.
Figure 6.. Activation of PnocCeA Networks Is Reinforcing.
(A)Top: schematic of ex vivo electrophysiological recordings in the CeA. Bottom: example trace from non-ChR2-expressing cell in the CeA shows a light-evoked (5 ms paired pulse) iPSC. (B)Schematic showing viral injection and optical fiber placement over the CeA in PnocIRES-Cre mice. (C)Example image showing ChR2-eYFP expression and optical fiber path in the CeA of PnocIRES-Cre mice. See Figure S5DDD for complete optical fiber placements. (D)CeA real-time place-preference behavior over increasing stimulation frequencies (n = 8 Cre– mice and 11 Cre+ mice; unpaired Student’s t test; p = 0.3606, 0.9657, 0.037, and 0.0011 at 1, 10, 20, and 40 Hz, respectively). (E)Total active or inactive port nose pokes during optogenetic self-stimulation sessions at 40 Hz(n = 8 Cre– mice and 11 Cre+ mice; two-way repeated-measures ANOVA with Sidak’s multiple comparisons test; group x port interaction; F(1,17) = 8.035; p = 0.0114). (F)Cumulative active port nose pokes across the 40-Hz self-stimulation session (n = 8 Cre– mice and 11 Cre+ mice; two-way repeated-measures ANOVA with Sidak’s multiple comparisons test; group x time interaction; F(29,493) = 9.056; p < 0.0001). (G)Top: schematic of ex vivo electrophysiological recordings in the vBNST. Bottom: example trace from non-ChR2-expressing cell in the vBNST shows a light evoked (5-ms paired pulse) iPSC. (H)Schematic showing viral injection and optical fiber placement over the vBNST in PnocIRES-Cre mice. (I)Example image showing ChR2-eYFP expression and optical fiber path in the vBNST of PnocIRES-Cre mice. See Figure S5EEE for complete optical fiber placements. (J)vBNST real-time place-preference behavior over increasing stimulation frequencies (n = 11 Cre– mice and 9 Cre+ mice; unpaired Student’s t test; p = 0.5133, 0.0191, 0.0174, and 0.0002 at 1, 10, 20, and 40 Hz, respectively). (K)Total active or inactive port nose pokes during optogenetic self-stimulation sessions at 40 Hz(n = 11 Cre– miceand9Cre+ mice; two-way repeated-measures ANOVA with Sidak’s multiple comparisons test; group x port interaction; F(1,18) = 24.19; p = 0.0001). (L)Cumulative active port nose pokes across the 40-Hz self-stimulation session (n = 11 Cre– mice and 9 Cre+ mice; two-way repeated-measures ANOVA with Sidak’s multiple comparisons test; group x time interaction; F(29,522) = 12.10; p < 0.0001). (M) Top: schematic of ex vivo electrophysiological recordings in the PBN. Bottom: example trace from non-ChR2-expressing cell in the PBN shows a light-evoked (5-ms paired pulse) iPSC. (N) Schematic showing viral injection and optical fiber placement over the PBN in PnocIRES-Cre mice. (O) Example image showing ChR2-eYFP expression and optical fiber path in the PBN of PnocIRES-Cre mice. See Figure S5FFF for complete optical fiber placements. (P) PBN real-time place-preference behavior over increasing stimulation frequencies (n = 11 Cre– mice and 12 Cre+ mice; unpaired Student’s t test; p = 0.1396, 0.1731, 0.0262, and <0.0001 at 1, 10, 20, and 40 Hz, respectively). (Q) Total active or inactive port nose pokes during optogenetic self-stimulation sessions at 40 Hz (n = 11 Cre– mice and 12 Cre+ mice; two-way repeated- measures ANOVA with Sidak’s multiple comparisons test; group x port interaction; F(1,21) = 7.849; p = 0.0107). (R) Cumulative active port nose pokes across the 40-Hz self-stimulation session (n = 11 Cre– mice and 12Cre+ mice; two-way repeated-measures ANOVA with Sidak’s multiple comparisons test; group x time interaction; F(29,609) = 8.066; p < 0.0001). (S) Top: schematic of ex vivo electrophysiological recordings in the NTS. Bottom: example race from non-ChR2-expressing cell in the NTS shows a light evoked (5-ms paired pulse) iPSC. (T) Schematic showing viral injection and optical fiber placement over the NTS in PnocIRES-Cre mice. (U) Example image showing ChR2-eYFP expression and optical fiber path in the NTS of PnocIRES-Cre mice. See Figure S5GGG for complete optical fiber placements. (V) NTS real-time place-preference behavior over increasing stimulation frequencies (n = 9 Cre– mice and 12 Cre+ mice; unpaired Student’s t test; p = 0.2327, 5079, 0.0044, and 0.0043 at 1, 10, 20, and 40 Hz, respectively). (W) Total active or inactive port nose pokes during optogenetic self-stimulation sessions at 40 Hz (n = 9 Cre–mice and 12 Cre+ mice; two-way repeated- measures ANOVA with Sidak’s multiple comparisons test; group x port interaction; F(1,19) = 6.327; p = 0.0211). (X) Cumulative active port nose pokes across the 40-Hz self-stimulation session (n = 9 Cre– mice and 12 Cre+ mice; two-way repeated-measures ANOVA with Sidak’s multiple comparisons test; group x time interaction; F(29,551) = 8.066; p < 0.0001).

References

    1. Amano T, Amir A, Goswami S, and Paré D (2012). Morphology, PKCSδ expression, and synaptic responsiveness of different types of rat centra l lateral amygdala neurons. J. Neurophysiol. 108, 3196–205. - PMC - PubMed
    1. Armbruster BN, Li X, Pausch MH, Herlitze S, and Roth BL (2007). Evolving the lock to fit the key to create a family of G protein-coupled receptors potently activated by an inert ligand. Proc. Natl. Acad. Sci. USA 104, 5163–5168. - PMC - PubMed
    1. Berthoud HR, Lenard NR, and Shin AC (2011). Food reward, hyperphagia, and obesity. Am. J. Physiol. Regul. Integr. Comp. Physiol. 300, R1266–R1277. - PMC - PubMed
    1. Burnett CJ, Li C, Webber E, Tsaousidou E, Xue SY, Brϋning JC, and Krashes MJ (2016). Hunger-driven motivational state competition. Neuron 92, 187–201. - PMC - PubMed
    1. Cai H, Haubensak W, Anthony TE, and Anderson DJ (2014). Central amygdala PKC- δ (+) neurons mediate the influence of multiple anorexigenic signals. Nat. Neurosci. 17, 1240–1248. - PMC - PubMed

Publication types

MeSH terms