. 2019 Jul:54:222-231.
doi: 10.1016/j.ymben.2019.04.010. Epub 2019 Apr 25.

Cyanobacterial carboxysome mutant analysis reveals the influence of enzyme compartmentalization on cellular metabolism and metabolic network rigidity

Affiliations

Cyanobacterial carboxysome mutant analysis reveals the influence of enzyme compartmentalization on cellular metabolism and metabolic network rigidity

Mary H Abernathy et al. Metab Eng. 2019 Jul.

Abstract

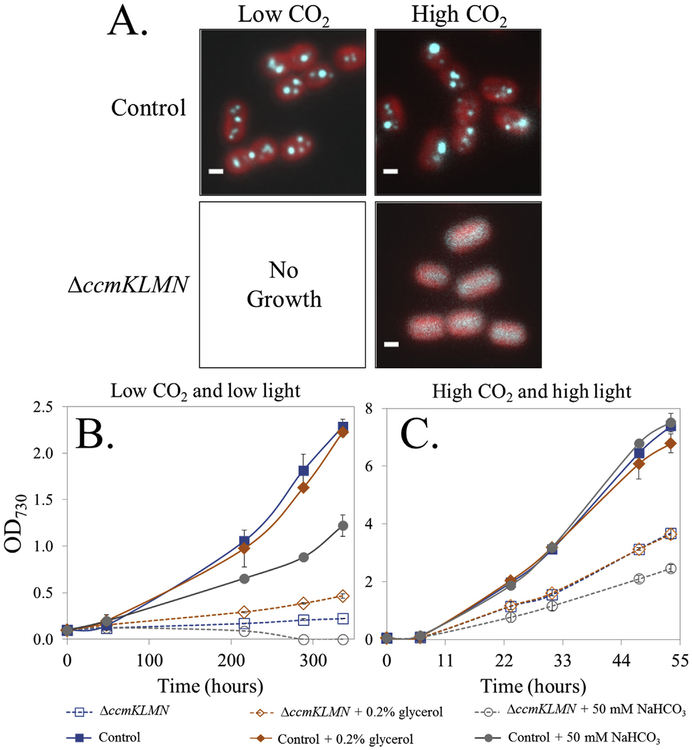
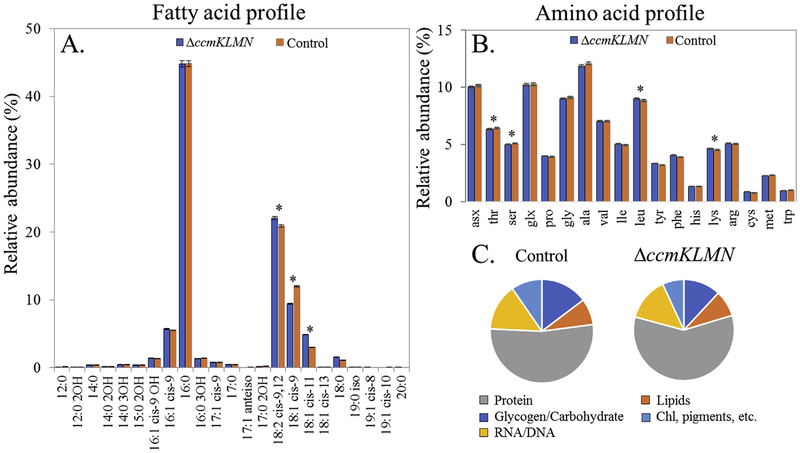
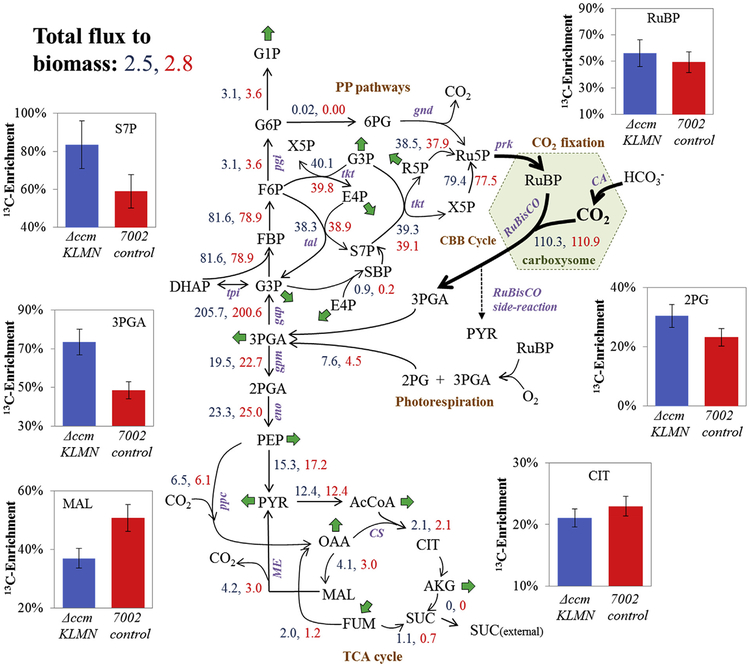
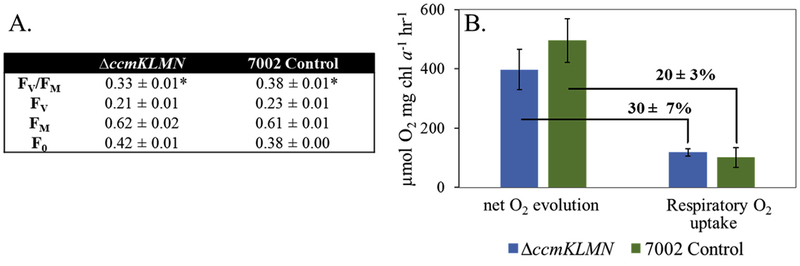
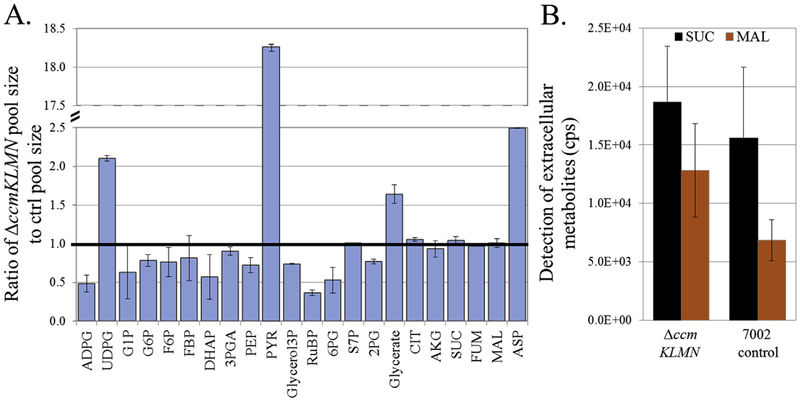
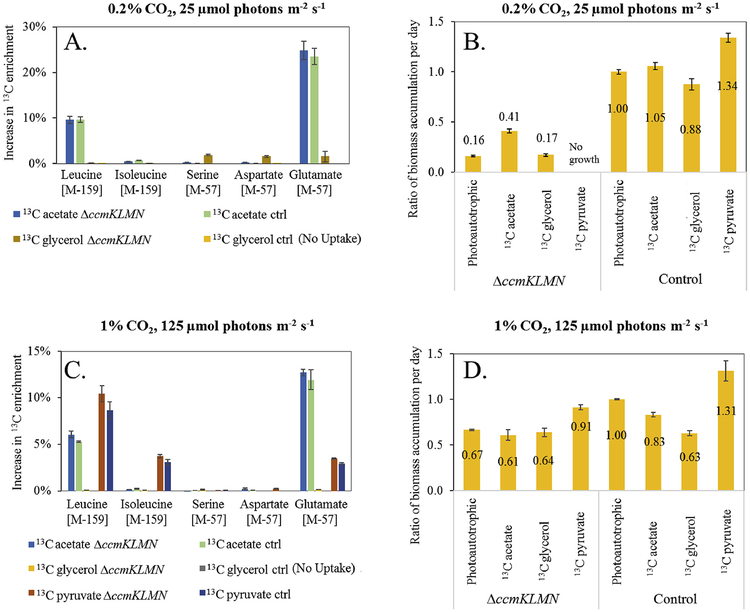
Cyanobacterial carboxysomes encapsulate carbonic anhydrase and ribulose-1,5-bisphosphate carboxylase/oxygenase (RuBisCO). Genetic deletion of the major structural proteins encoded within the ccm operon in Synechococcus sp. PCC 7002 (ΔccmKLMN) disrupts carboxysome formation and significantly affects cellular physiology. Here we employed both metabolite pool size analysis and isotopically nonstationary metabolic flux analysis (INST-MFA) to examine metabolic regulation in cells lacking carboxysomes. Under high CO2 environments (1%), the ΔccmKLMN mutant could recover growth and had a similar central flux distribution as the control strain, with the exceptions of moderately decreased photosynthesis and elevated biomass protein content and photorespiration activity. Metabolite analyses indicated that the ΔccmKLMN strain had significantly larger pool sizes of pyruvate (>18 folds), UDPG (uridine diphosphate glucose), and aspartate as well as higher levels of secreted organic acids (e.g., malate and succinate). These results suggest that the ΔccmKLMN mutant is able to largely maintain a fluxome similar to the control strain by changing in intracellular metabolite concentrations and metabolite overflows under optimal growth conditions. When CO2 was insufficient (0.2%), provision of acetate moderately promoted mutant growth. Interestingly, the removal of microcompartments may loosen the flux network and promote RuBisCO side-reactions, facilitating redirection of central metabolites to competing pathways (i.e., pyruvate to heterologous lactate production). This study provides important insights into metabolic regulation via enzyme compartmentation and cyanobacterial compensatory responses.

Keywords: Compensatory response; INST-MFA; Microcompartment; Mixotrophic; Photorespiration; RuBisCO.


Figures

Fig. 1.
Fig. 1.. Strain physiology under high and low CO2 and light conditions.
(A) Representative fluorescence images of the Synechococcus PCC 7002 control and ΔccmKLMN. Chlorophyll fluorescence is red, and GFP-labeled RuBisCO is cyan. Scale bars are 1 μm. (B) Growth under 0.2% CO2 and 25 μmol m−2•s−1. (C) Growth under 1% CO2 and 125 μmol m−2•s−1. Glycerol at a concentration of 0.2% (w/w) or sodium bicarbonate (NaHCO3) at a concentration of 50 mM were added to cultures to investigate photo-mixotrophic growth rates.
Fig. 2.
Fig. 2.. Biomass compositional analysis of Synechococcus PCC 7002 control and ΔccmKLMN mutant.
(A) Fatty acid profile found in each strain as a relative abundance of the total fatty acid content. (B) Amino acid profile found in each strain as the relative mole percentage. asx: aspartate and asparagine; glx: glutamate and glutamine. (C) Macromolecule biomass composition as a percentage of dry cell weight. * indicates a significant difference (p value < 0.05). Both control and mutant strains were cultivated in high CO2/light conditions.
Fig. 3.
Fig. 3.. Synechococcus PCC 7002 control and ΔccmKLMN flux maps as determined by INCA (under high CO2/light conditions.
Net fluxes are normalized to a CO2 uptake of 100 mmol and reported as mmol/gDCW/h. ΔccmKLMN flux values are reported in blue, and PCC 7002 control flux values in red. Green arrows represent biomass synthesis reactions. Percentages of total 13C enrichment at steady state of key metabolites are represented by bar graphs. Total 13C enrichment was calculated at isotopic steady state. Standard deviations are based off biological replicates (n = 2). The complete metabolic network and full flux results can be found in Tables S2–S4.
Fig. 4.
Fig. 4.. Comparison of photosynthetic efficiency in PCC 7002 control and ΔccmKLMN mutants.
(A): PSII activities (FV/FM). (B): O2 evolution and uptake. F0: initial fluorescence; Fv: variable fluorescence; FM: maximum fluorescence. Technical (n = 2) and biological replicates (n = 3) were used for standard deviations. *p < 0.001. Percentages represent the respiratory O2 uptake (as measured in the dark) as a fraction of the total net O2 evolution.
Fig. 5.
Fig. 5.. Comparison of metabolite pool size between Synechococcus PCC 7002 control and ΔccmKLMN.
(A) Relative pool size comparisons between the two strains. A y-axis of 1 represents equal metabolite concentrations while a y-axis > 1 indicates the factor of pool size in ΔccmKLMN greater than PCC 7002 control. The relative pool size was normalized using a13C-labeled internal standard and cell density. (B) Succinate and malate in the culture supernatant were detected by LC-MS, and the peak intensity (counts per second, cps) was proportional to their concentrations. Exact succinate concentration was further quantified using an enzyme kit (Table S1).
Fig. 6.
Fig. 6.. Steady-state proteinogenic amino acid labeling from labeled glycerol, acetate and pyruvate to monitor photomixotrophic growth of PCC 7002 control (ctrl) and ΔccmKLMN.
GC-MS data for proteinogenic amino acids under photomixotrophic conditions with 25 mM labeled carbon. Standard deviations are estimated based on two biological replicates (n = 2). Percent 13C increase is graphed (i.e., evidence of organic carbon utilization). (A) Labeling of amino acids and (B) Ratio of biomass accumulation under mixotrophic and low light/CO2 conditions. (C) Labeling of amino acids and (D) Ratio of biomass accumulation under mixotrophic and high light/CO2 conditions. Note: “ratio of biomass accumulation per day” is defined as: Maximal OD730 increase over time (with organic carbon)Maximal OD730 increase over time (photoautotrophic).

References

    1. Abernathy MH, Yu J, Fa M, Liberton M, Ungerer J, Hollinshead WD, Gopalakrishnan S, He L, Maranas CD, Pakrasi HB, Allen DK, Tang YJ, 2017a. Deciphering cyanobacterial phenotypes for fast photoautotrophic growth via isotopically nonstationary metabolic flux analysis. Biotechnol. Biofuels 10, 273. - PMC - PubMed
    1. Abernathy MH, He L, Tang Y, 2017b. Channeling in native microbial pathways: implications and challenges for metabolic engineering. Biotechnol. Adv 35 (6). - PubMed
    1. Abernathy MH, Zhang Y, Hollinshead WD, Wang G, Baidoo EEK, Liu T, Tang YJ, 2019. Comparative studies of glycolytic pathways and channeling under in vitro and in vivo modes. AIChE J 65, 483–490.
    1. Agarwal R, Ortleb S, Sainis JK, Melzer M, 2009. Immunoelectron microscopy for locating Calvin cycle enzymes in the thylakoids of Synechocystis 6803. Mol. Plant 2(1), 32–42. - PMC - PubMed
    1. Allahverdiyeva Y, Ermakova M, Eisenhut M, Zhange P, Pichaud P, Hagemann M, Cournac L, Aro EM, 2011. Interplay between flavodiiron proteins and photorespiration in Synechocystis sp. PCC 6803. J. Biol. Chem 286, 24007–24014. - PMC - PubMed

Publication types

MeSH terms

Substances

LinkOut - more resources