Review
. 2020 Jan;139(1):23-41.
doi: 10.1007/s00439-019-02014-8. Epub 2019 Apr 27.

Is population structure in the genetic biobank era irrelevant, a challenge, or an opportunity?

Affiliations
Review

Is population structure in the genetic biobank era irrelevant, a challenge, or an opportunity?

Daniel John Lawson et al. Hum Genet. 2020 Jan.

Erratum in

Abstract

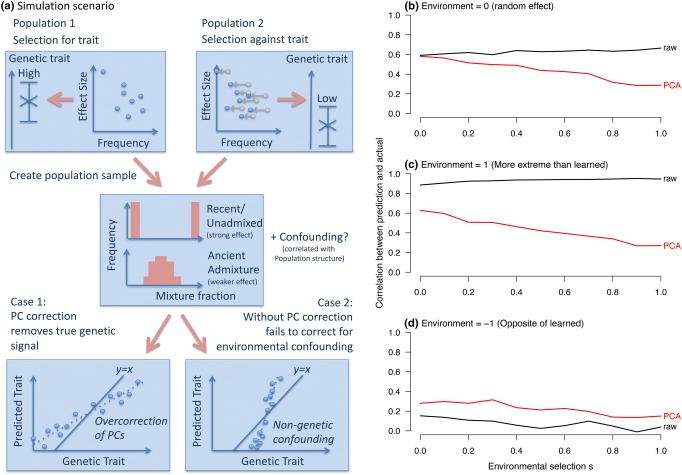
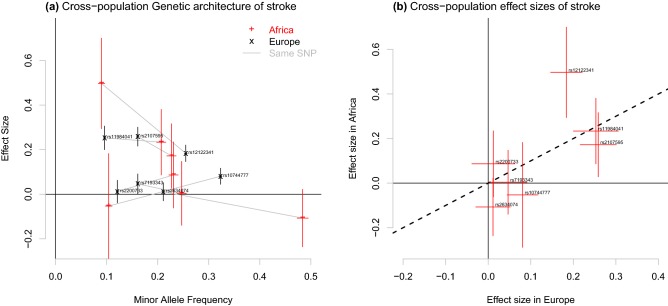
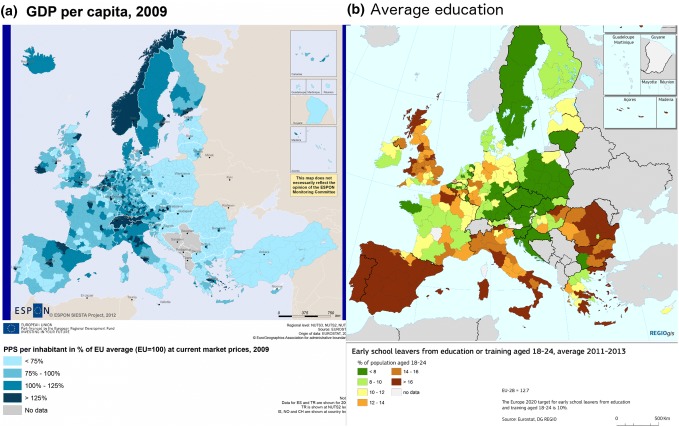
Replicable genetic association signals have consistently been found through genome-wide association studies in recent years. The recent dramatic expansion of study sizes improves power of estimation of effect sizes, genomic prediction, causal inference, and polygenic selection, but it simultaneously increases susceptibility of these methods to bias due to subtle population structure. Standard methods using genetic principal components to correct for structure might not always be appropriate and we use a simulation study to illustrate when correction might be ineffective for avoiding biases. New methods such as trans-ethnic modeling and chromosome painting allow for a richer understanding of the relationship between traits and population structure. We illustrate the arguments using real examples (stroke and educational attainment) and provide a more nuanced understanding of population structure, which is set to be revisited as a critical aspect of future analyses in genetic epidemiology. We also make simple recommendations for how problems can be avoided in the future. Our results have particular importance for the implementation of GWAS meta-analysis, for prediction of traits, and for causal inference.


Conflict of interest statement

DJL is a director of GENSCI Ltd. On behalf of all authors, the corresponding author states that there is no other conflict of interest.

Figures

Fig. 1
Fig. 1
Causal models including ancestry for the effect of a SNP (G) on a trait (T). a Correction for structure will be accurate when ancestry (A) is confounding T. b Correction for structure may give biased inference when ancestry is associated with the causal pathway (TA, which may not be measured) by which the SNP acts. For example, T = skin cancer is associated with TA = skin tone. c Correction for structure will be incomplete when ancestry is associated with the environment (E) due to shared history and geography (H), for example T = BMI with E = diet choice. d Correction for structure when using causal inference is robust to complexity, provided the assumptions of Mendelian randomization (see text) are met; particularly all remaining effects of ancestry go through the trait (T) so there is no direct effect of ancestry (A) on the outcome (O)
Fig. 2
Fig. 2
When should we use PCA correction? a In simulation settings (see “Methods”) it is straightforward to construct scenarios where correction helps or hinders prediction of traits. Top: two populations are produced with different genetic phenotype, either by drift or selection. Middle: these are mixed to make modern populations. Bottom: in Case 1 the phenotype is associated with true population structure, which can be overcorrected. In Case 2 confounding non-genetic association is included in the prediction. bd Show results for this simulation. b Correcting for confounding using PCA reduces prediction accuracy when traits are genetically associated with population structure. c Genetic structure can predict non-genetic confounding leading to apparently good performance on similarly biased populations. d PC correction can protect against this confounding at the cost of reduced performance
Fig. 3
Fig. 3
Population structure can be detected in ALSPAC using the external UK reference dataset PoBI and chromosome painting (see “Methods”). This structure is associated with phenotype, and is not found using regular PCA. a Inferred (see “Methods”) education level of people migrating from different regions of the UK into the ALSPAC cohort based in Bristol; scale is 1 = no education, 2 = vocational, 3 = GSCEs (age 16), 4 = further education (age 18), 5 = degree (reproduced from Haworth et al. 2018). Participants with ancestry further from Bristol have considerably higher education, suggesting differential migration by education. b Variance explained in education by chromosome painting PCs (8%) and regular PCA (0.8%). c The chromosome painting PC locations of individuals and populations for chromosome painting PC 3 and 5, which have the largest associations with education. PoBI mean label locations are shown, along with ALSPAC individuals (white dots) and a kernel smoothing of education
Fig. 4
Fig. 4
Genetic architecture of significant stroke SNPs, from the GWAS meta-analysis of data from Pulit et al. (2016). a Compares minor allele frequency against inferred effect size for Africans and Europeans (larger sample size). b Compares the effect sizes only. Effect SNPs are chosen to ensure that the effect directions in the meta-analysis are positive
Fig. 5
Fig. 5
Maps of measures of educational attainment correlate with GDP, both within and across countries in Europe. There are large differences between North and South Europe, and this is plausibly associated with genetic ancestry. This may confound inference by generating genetic associations with education that are not biologically causal but are instead driven by access to education. Data source: Eurostat http://ec.europa.eu

References

    1. 1000 Genomes Consortium A global reference for human genetic variation. Nature. 2015;526:68–74. doi: 10.1038/nature15393. - DOI - PMC - PubMed
    1. Adhikari K, Fontanil T, Cal S, Mendoza-Revilla J, Fuentes-Guajardo M, Chacón-Duque J-C, Al-Saadi F, Johansson JA, Quinto-Sanchez M, Acuña-Alonzo V, Jaramillo C, Arias W, Lozano RB, Pérez GM, Gómez-Valdés J, Villamil-Ramírez H, Hunemeier T, Ramallo V, de Cerqueira CCS, Hurtado M, Villegas V, Granja V, Gallo C, Poletti G, Schuler-Faccini L, Salzano FM, Bortolini M-C, Canizales-Quinteros S, Rothhammer F, Bedoya G, Gonzalez-José R, Headon D, López-Otín C, Tobin DJ, Balding D, Ruiz-Linares A. A genome-wide association scan in admixed Latin Americans identifies loci influencing facial and scalp hair features. Nat Commun. 2016;7:10815. doi: 10.1038/ncomms10815. - DOI - PMC - PubMed
    1. Barton N, Hermisson J, Nordborg M. Why structure matters. eLife. 2019;8:e45380. doi: 10.7554/eLife.45380. - DOI - PMC - PubMed
    1. Battram T, Hoskins L, Hughes DA, Kettunen J, Ring SM, Davey Smith G, Timpson NJ. Coronary artery disease, genetic risk and the metabolome in young individuals. Wellcome Open Res. 2018;3:114. doi: 10.12688/wellcomeopenres.14788.1. - DOI - PMC - PubMed
    1. Berg JJ, Harpak A, Sinnott-Armstrong N, Joergensen AM, Mostafavi H, Field Y, Boyle EA, Zhang X, Racimo F, Pritchard JK, Coop G. Reduced signal for polygenic adaptation of height in UK Biobank. bioRxiv. 2018 doi: 10.1101/354951. - DOI - PMC - PubMed

MeSH terms

LinkOut - more resources