Review
. 2020 Mar;41(1):71-89.
doi: 10.1007/s10974-019-09513-1. Epub 2019 Apr 27.

Troponin structure and function: a view of recent progress

Affiliations
Review

Troponin structure and function: a view of recent progress

Steven Marston et al. J Muscle Res Cell Motil. 2020 Mar.

Abstract

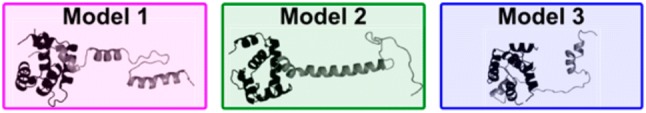
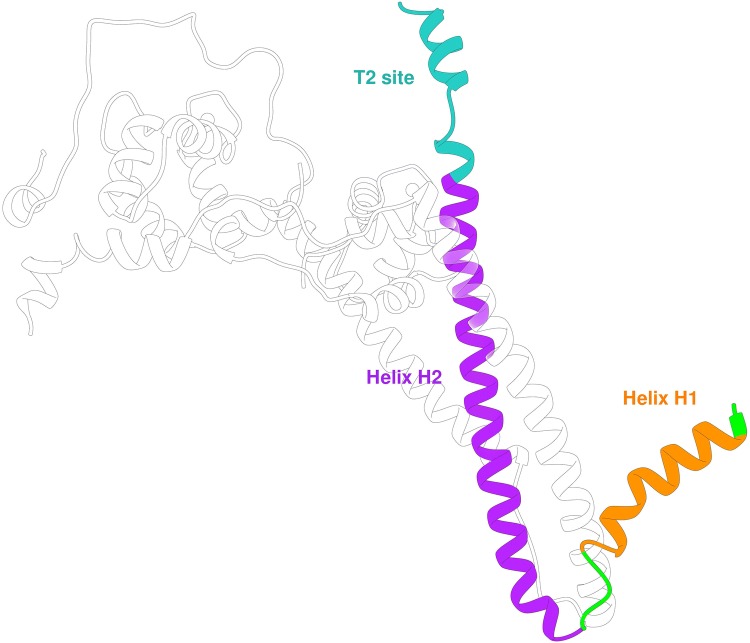
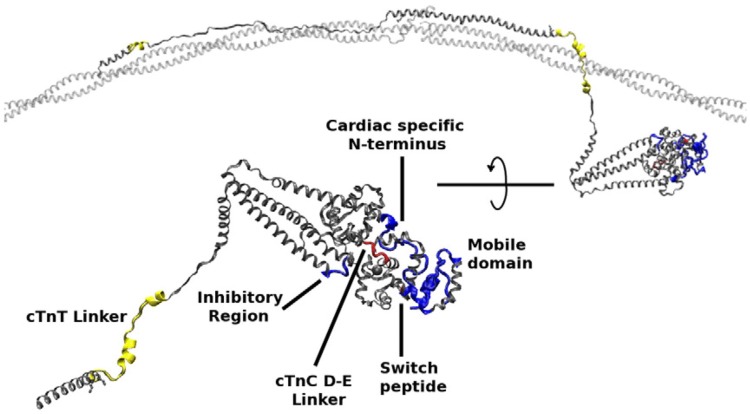
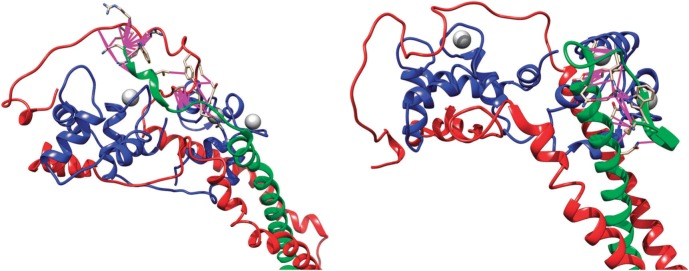
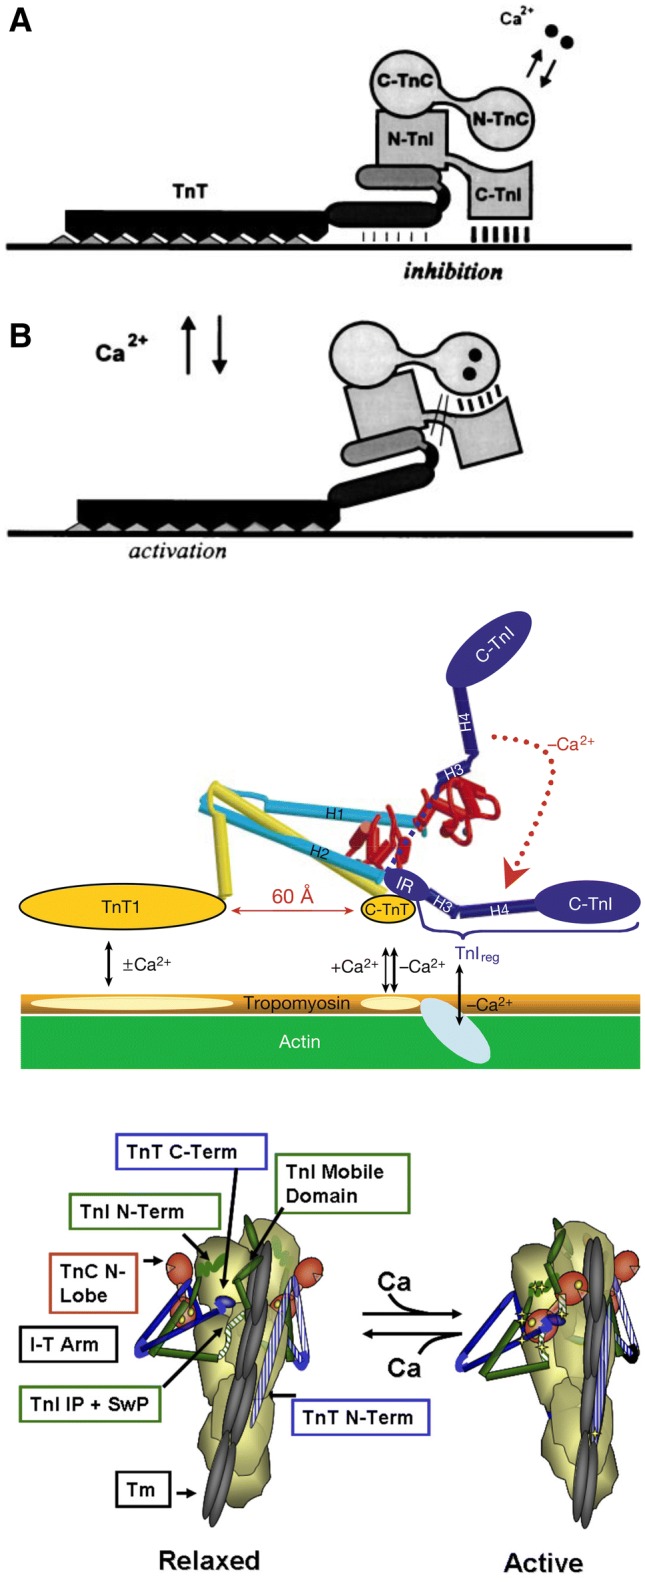
The molecular mechanism by which Ca2+ binding and phosphorylation regulate muscle contraction through Troponin is not yet fully understood. Revealing the differences between the relaxed and active structure of cTn, as well as the conformational changes that follow phosphorylation has remained a challenge for structural biologists over the years. Here we review the current understanding of how Ca2+, phosphorylation and disease-causing mutations affect the structure and dynamics of troponin to regulate the thin filament based on electron microscopy, X-ray diffraction, NMR and molecular dynamics methodologies.

Keywords: Ca2+; Muscle regulation; Mutation; Phosphorylation; Thin filaments; Troponin.


Figures

Fig. 1
Fig. 1
Model of the muscle thin filament based on the coordinates published by Pirani et al. (2006) showing the likely arrangement of actin (white), tropomyosin (red) and troponin (TnC pink, TnI magenta, TnT yellow), based on electron microscopy and X-ray diffraction. The barbed end (Z- band end) of the actin filament is on the left of the figure. (Color figure online)
Fig. 2
Fig. 2
Front and back view of the 46 kDa core domain of human cardiac Troponin in the Ca2+-activated form. TnC is depicted in blue, TnT in green and TnI in red. PDB accession code 1J1D (Takeda et al. 2003). (Color figure online)
Fig. 3
Fig. 3
The three most populated structures of human cardiac troponin determined by molecular dynamics simulations overlaid over the Takeda et al. structure of hcTn (pale structure) TnC is depicted in blue, TnT in green and TnI in red (Zamora 2019). (Color figure online)
Fig. 4
Fig. 4
The cTnC molecule with its nine helices highlighted. Subunits cTnI and cTnT are transparent for clarity. The troponin structure is the original Takeda structure with the disordered segments of TnI and TnT modelled (Zamora et al. 2016)
Fig. 5
Fig. 5
Sequence and secondary structure of cTnC N-terminal domain. Numbering is for human cardiac troponin C (P63316)
Fig. 6
Fig. 6
Ca2+ dependent changes in the structure of the N-terminal lobe of skeletal troponin C. These images are from the X-ray structure of whole skeletal muscle troponin (1ytz and 1yv0) (Vinogradova et al. 2005) with TnI and TnT edited out for clarity. Thin blue lines are putative hydrogen bonds. Thin red lines are the residues of the hydrophobic patch. a Ribbon diagram of (left) the Ca2+-saturated sTnC and (right) Ca2+-free TnC, viewed from above the short beta sheet formed by amino acids just preceding helices B and D. This structure is disrupted, the two EF hands (AB and CD) move away from each other and the angle between helix A and B changes from 135° to 81° in the absence of Ca2+. b Hydrophobicity surface rendering of sTnC, viewed from the underneath. Maximum hydrophobicity is brown and minimum is blue. In the Ca2+ bound state an extensive hydrophobic surface is presented to the TnI switch peptide (see Fig. 8) (left) that is closed off in the absence of Ca2+ (right). (Color figure online)
Fig. 7
Fig. 7
The cTnI molecule with its relevant structural regions highlighted. Subunits cTnC and cTnT are transparent for clarity. The switch peptide corresponds to Helix H3. Residues 172 to 210 of cTnI are not present in this structure (Zamora et al. 2016)
Fig. 8
Fig. 8
The binding of the skeletal muscle TnI switch peptide, helix3 (green), to the hydrophobic patch of skTnC- Ca2+ (red). The switch peptide is an amphipathic helix with hydrophobic residue on the face interacting with TnC (Ala118, Met121, Leu122, Leu125, Leu126). Rendered from Vinogradova’s X-ray structure 1ytz with segments of TnI C-terminal to Helix 3 and TnT are removed for clarity. (Color figure online)
Fig. 9
Fig. 9
Three models of the structure of the TnI C-terminal domain with the preceding switch peptide docked on TnC Ca2+ (left). Model 1 is (Murakami et al. 2005) (NMR, NOE), model 2 is (Blumenschein et al. 2006) (NMR, CSI) and model 3 is (Takeda et al. 2003). From (Metskas and Rhoades 2015), with permission
Fig. 10
Fig. 10
The cTnT2 domain with its relevant structural regions highlighted. Subunits cTnC and cTnI are transparent for clarity. Residues 1 to 201 of cTnT are not present in this structure
Fig. 11
Fig. 11
Model of troponin T and its interaction with tropomyosin and troponin I. WT average structure (grey) with regions that are structurally sensitive to TNT1 mutations highlighted. The highlighted regions are colored as a function of their subunit: yellow, cTnT; blue, cTnI; and red, cTnC. From (Manning et al. 2012) with permission. (Color figure online)
Fig. 12
Fig. 12
The two most probable conformations of the C-terminus of troponin T determined by molecular dynamics simulations (Zamora et al. 2016). Left is the more common configuration. TnT is in green, magenta bars represent hydrogen bonding between TnT and TnI or TnC. (Color figure online)
Fig. 13
Fig. 13
Troponin rendering onto the thin filament. The thin filament is represented by two coiled-coil tropomyosin monomers shown in cyan and blue over a core of actin monomers shown in ribbon view in magenta. The calculated troponin electron density is represented in gold. The image data was kindly supplied by Dr William Lehman (Boston University, MA, USA) based on Yang et al. (2014). Image modified from Papadaki and Marston (2016) with permission
Fig. 14
Fig. 14
The barbed end (Z- band end) of the actin filament is on the left of the figure. Difference density maps calculated by subtracting docked F-actin (grey) and tropomyosin (orange) models from the single particle reconstructions leaving density attributable only to troponin (blue). Filament shown in two orientations rotated by 90°. The lower orientation approximates to the orientation in Figs. 1, 13 and 16. From (Paul et al. 2017) with permission. (Color figure online)
Fig. 15
Fig. 15
Troponin orientation on actin determined from fluorescence polarization measurements. The three metastable positions of the N-terminal domain are superimposed: green, A1, light purple, A2 and magenta, A3. The arrow indicates the transition from relaxed to active (+Ca2+) contraction (Sevrieva et al. 2014) with permission. (Color figure online)
Fig. 16
Fig. 16
Model of the thin filament built by Williams et al. based on computational chemistry. (Williams et al. 2016) in grey. The shorter model of Gould and Zamora is coloured. (Color figure online)
Fig. 17
Fig. 17
Structural models describing Ca2+ regulation of thin filaments by troponin
Fig. 18
Fig. 18
Schematic of the energetic landscape of N-cTnC activation. N-cTnC is shown as a cartoon. Ca2+ is a blue circle, and the TnI switch peptide is represented as a red ellipse. Lower energy states are more favourable. The orange arrows represent the resistance to the conformational change caused by the hydrophobic cleft. The blue arrows indicate conformational strain introduced by Ca2+ binding. The Ca2+-bound, open conformation relieves the conformational strain while occluding the hydrophobic cleft and is therefore the most favourable conformation. From (Stevens et al. 2017), with permission. The line represents the range of the system accessed by phosphorylation and mutations. (Color figure online)
Fig. 19
Fig. 19
Effect of dephosphorylation on mouse myofibril contractility. a The Ca2+-sensitivity curve of isometric force for unphosphorylated myofibrils (open circles, dashed line) is shifted to the left of the phosphorylated myofibrils (solid circles, solid line. b Kinetic parameter kREL at maximally activating Ca2+ and SL 2.17 µm. From Vikhorev et al. (2014)
Fig. 20
Fig. 20
The three macrostates of troponin located in their average positions on the landscape formed by the first two time-structure Independent Components Analysis. a WT unphosphorylated macrostates and the MFPTs of transition between them. b WT Phosphorylated macrostates and the MFPTs of transition between them. The node sizes reflect the relative stability of the macrostates, the arrow labels indicate the Mean First Passage Times of transition in μs (Zamora 2019)
Fig. 21
Fig. 21
The two backbone hydrogen bonds that can be formed between cTnC I36 and V72 in the open state and that are modulated by phosphorylation
Fig. 22
Fig. 22
a Frequency histogram of increase in Ca2+ sensitivity for 71 measurements of HCM mutations compared with wild-type. The plot includes results obtained with 4 measurement methods with 44 mutations in 6 genes. The mean increase in Ca2+ -sensitivity is 1.87 ± 0.07 fold (sem). From (Marston 2016). b Uncoupling of the relationship between cTnI phosphorylation and myofilament Ca2+ -sensitivity. The ratio of EC50 phosphorylated: Unphosphorylated is 2.4. In wild-type, but 1.0 for the HCM and DCM mutations shown on the x-axis, indicating uncoupling. From (Sheehan et al. 2018)

References

    1. Al-Hillawi E, Bhandari DG, Trayer HR, Trayer IP. The effects of phosphorylation of cardiac troponin-I on its interactions with actin and troponin-C. Eur J Biochem. 1995;228:962–970. doi: 10.1111/j.1432-1033.1995.tb20347.x. - DOI - PubMed
    1. Anderson PAW, Malouf NN, Oakeley AE, Pagani ED, Allen PD. Troponin T isoform expression in humans. A comparison among normal and failing heart, fetal heart and adult and fetal skeletal muscle. Circ Res. 1991;69:1226–1233. doi: 10.1161/01.RES.69.5.1226. - DOI - PubMed
    1. Ayaz-Guner S, Zhang J, Li L, Walker JW, Ge Y. In vivo phosphorylation site mapping in mouse cardiac troponin i by high resolution top-down electron capture dissociation mass spectrometry: Ser22/23 are the only sites basally phosphorylated. Biochemistry. 2009;48:8161–8170. doi: 10.1021/bi900739f. - DOI - PMC - PubMed
    1. Baryshnikova OK, Li MX, Sykes BD. Modulation of cardiac troponin C function by the cardiac-specific N-terminus of troponin I: influence of PKA phosphorylation and involvement in cardiomyopathies. J Mol Biol. 2008;375:735–751. doi: 10.1016/j.jmb.2007.10.062. - DOI - PubMed
    1. Baryshnikova OK, Robertson IM, Mercier P, Sykes BD. The dilated cardiomyopathy G159D mutation in cardiac troponin C weakens the anchoring interaction with troponin I. Biochemistry. 2008;47:10950–10960. doi: 10.1021/bi801165c. - DOI - PubMed

Publication types

LinkOut - more resources