. 2019 May 7;8(9):e010090.
doi: 10.1161/JAHA.118.010090.

Role of Ryanodine Type 2 Receptors in Elementary Ca2+ Signaling in Arteries and Vascular Adaptive Responses

Affiliations

Role of Ryanodine Type 2 Receptors in Elementary Ca2+ Signaling in Arteries and Vascular Adaptive Responses

Mario Kaßmann et al. J Am Heart Assoc. .

Abstract

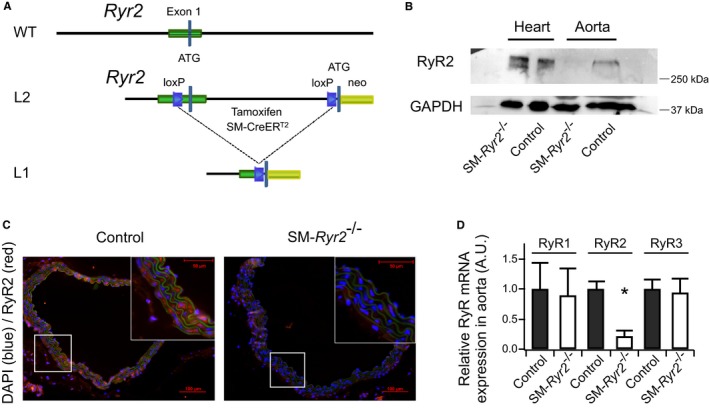
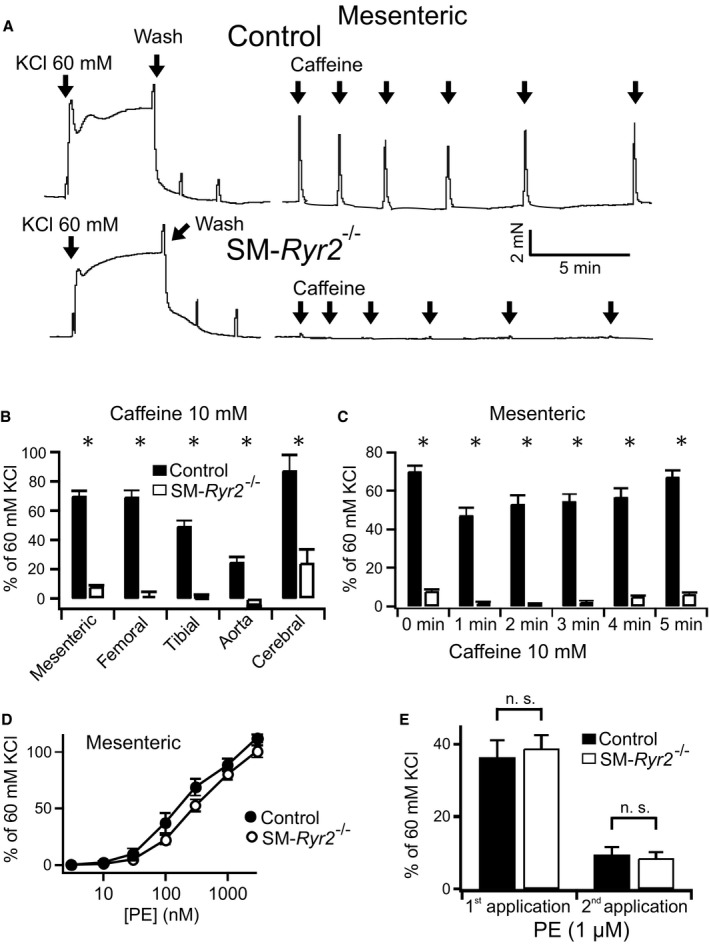
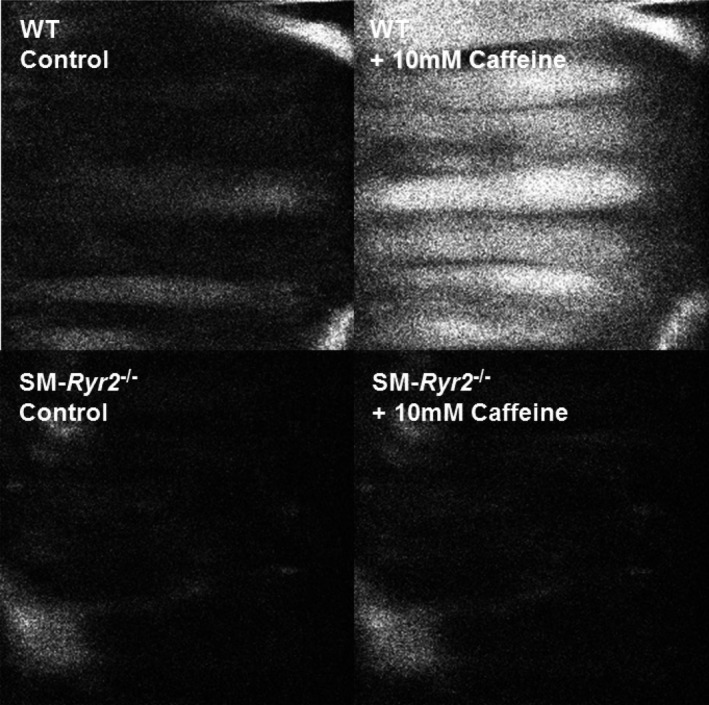
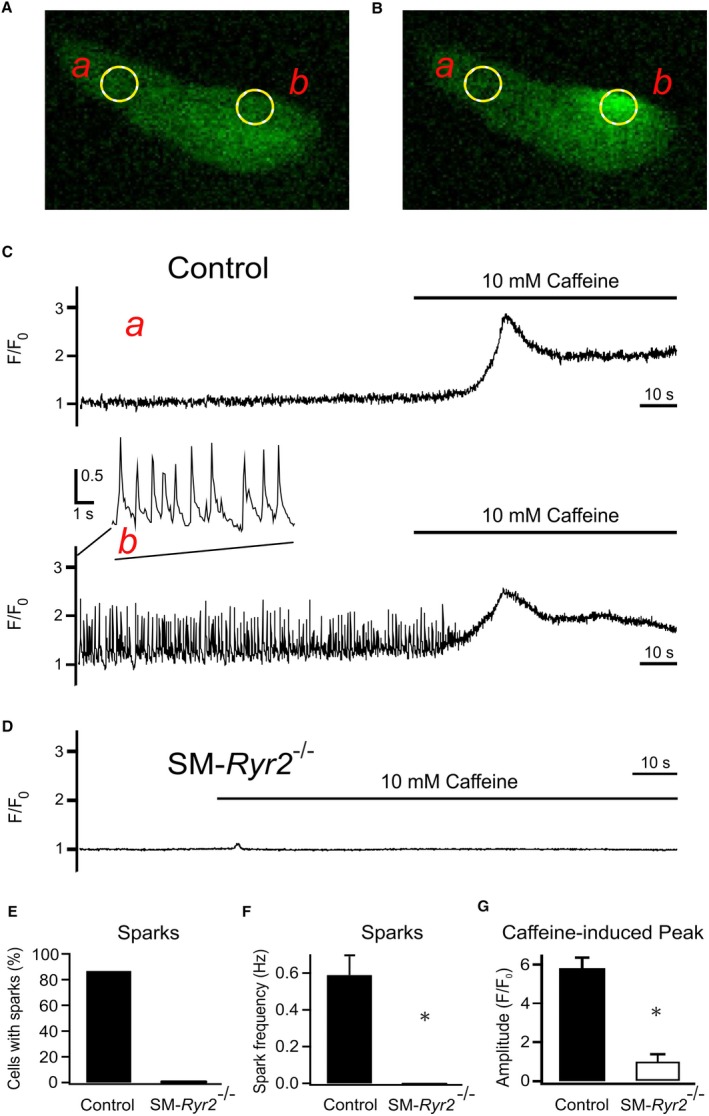
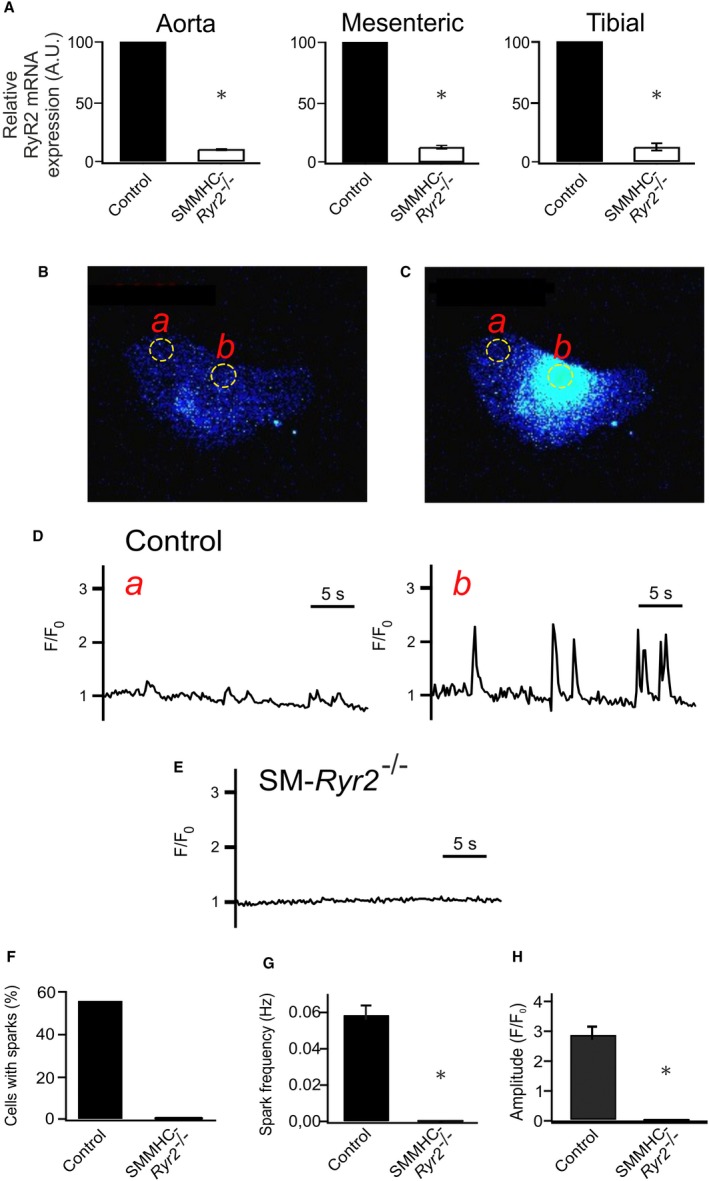
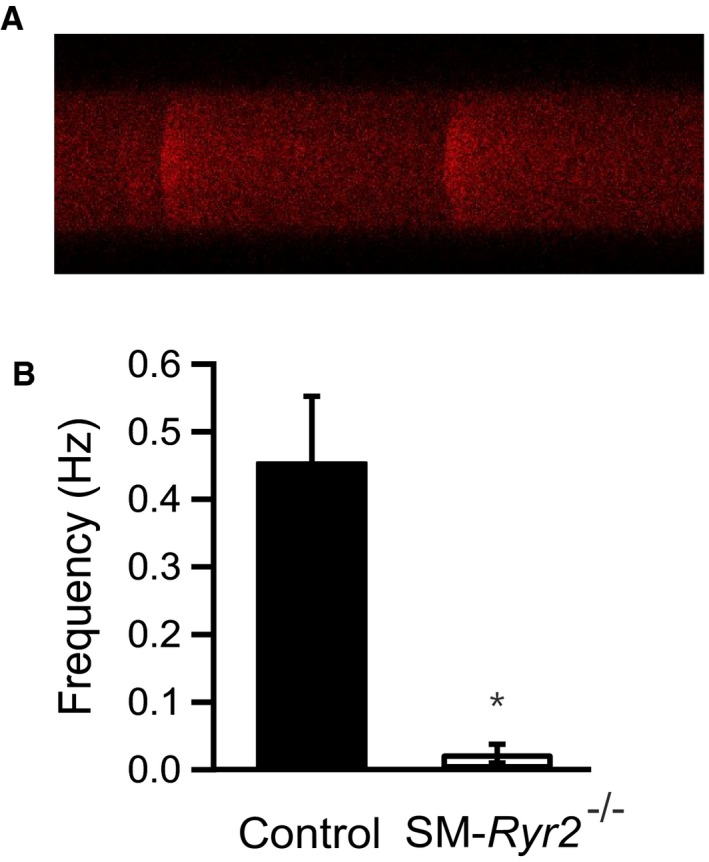
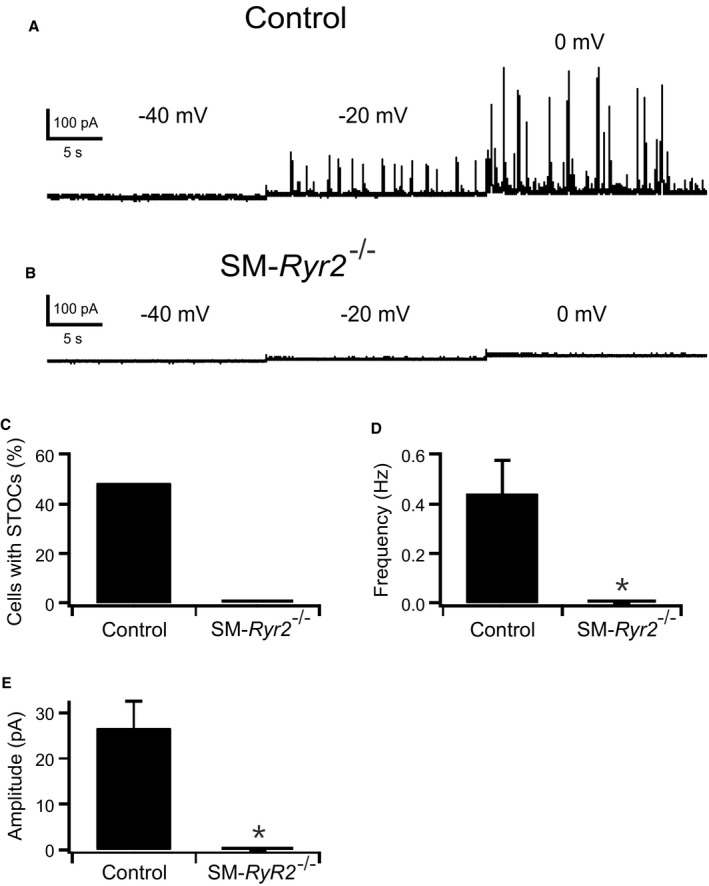
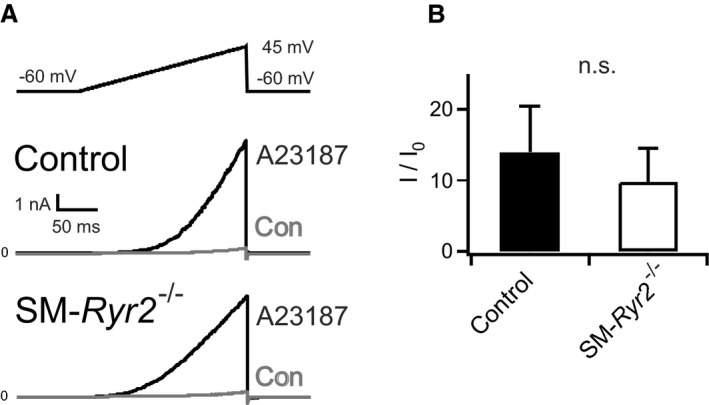
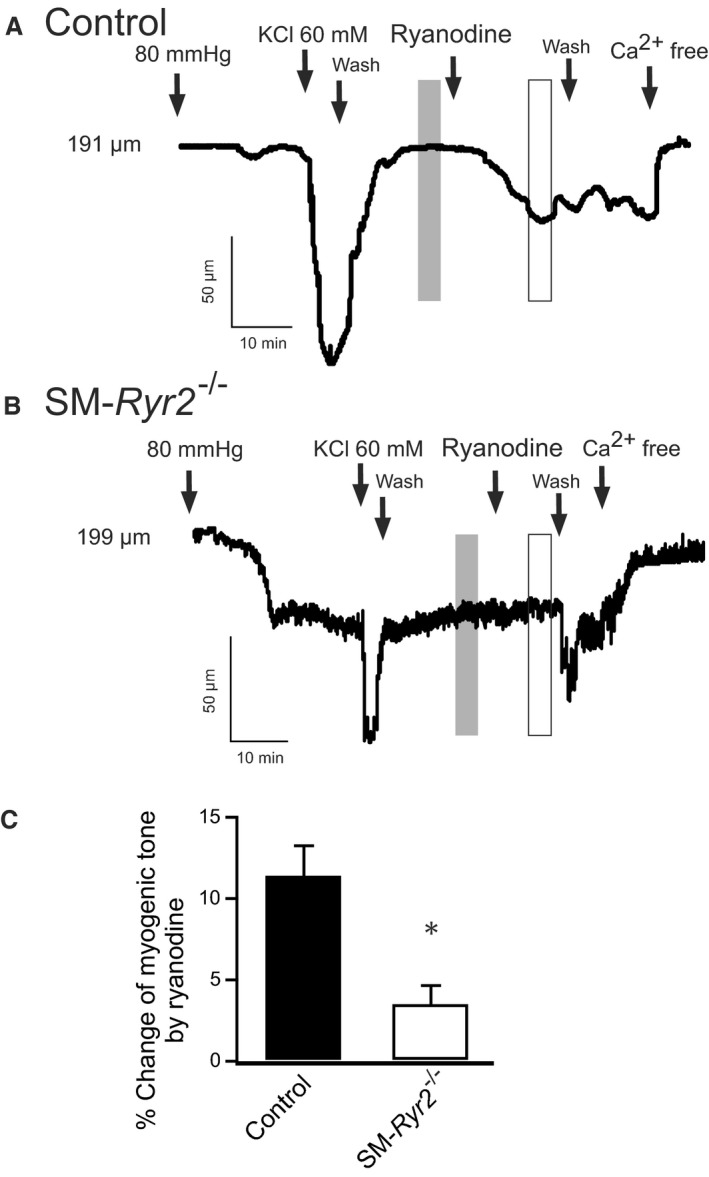
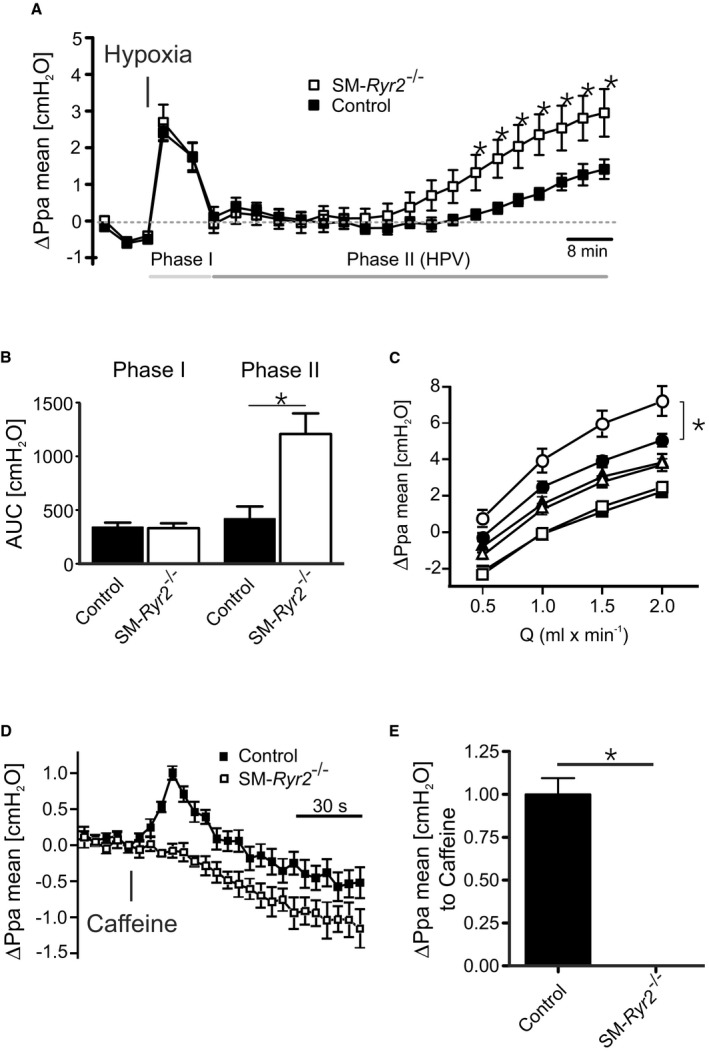
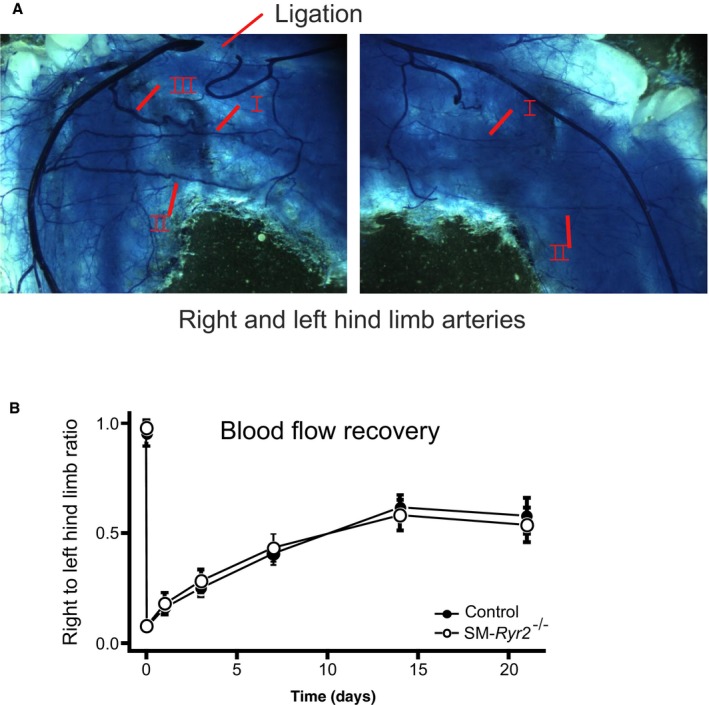
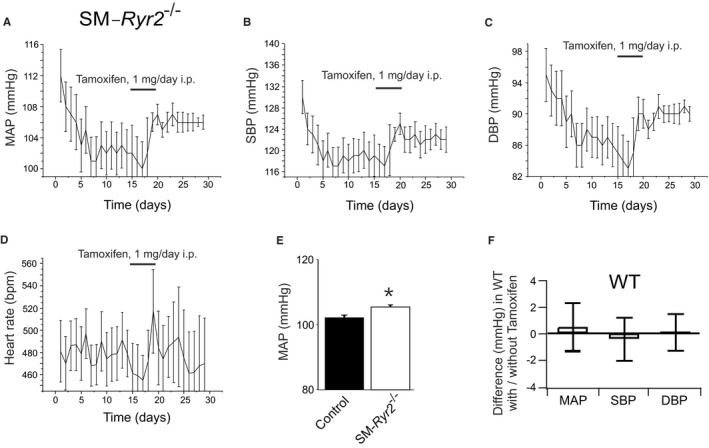
Background Hypertension is the major risk factor for cardiovascular disease, the most common cause of death worldwide. Resistance arteries are capable of adapting their diameter independently in response to pressure and flow-associated shear stress. Ryanodine receptors (RyRs) are major Ca2+-release channels in the sarcoplasmic reticulum membrane of myocytes that contribute to the regulation of contractility. Vascular smooth muscle cells exhibit 3 different RyR isoforms (RyR1, RyR2, and RyR3), but the impact of individual RyR isoforms on adaptive vascular responses is largely unknown. Herein, we generated tamoxifen-inducible smooth muscle cell-specific RyR2-deficient mice and tested the hypothesis that vascular smooth muscle cell RyR2s play a specific role in elementary Ca2+ signaling and adaptive vascular responses to vascular pressure and/or flow. Methods and Results Targeted deletion of the Ryr2 gene resulted in a complete loss of sarcoplasmic reticulum-mediated Ca2+-release events and associated Ca2+-activated, large-conductance K+ channel currents in peripheral arteries, leading to increased myogenic tone and systemic blood pressure. In the absence of RyR2, the pulmonary artery pressure response to sustained hypoxia was enhanced, but flow-dependent effects, including blood flow recovery in ischemic hind limbs, were unaffected. Conclusions Our results establish that RyR2-mediated Ca2+-release events in VSCM s specifically regulate myogenic tone (systemic circulation) and arterial adaptation in response to changes in pressure (hypoxic lung model), but not flow. They further suggest that vascular smooth muscle cell-expressed RyR2 deserves scrutiny as a therapeutic target for the treatment of vascular responses in hypertension and chronic vascular diseases.

Keywords: BKCa channel; Ca2+ sparks; blood pressure; hypoxia; isoforms; pulmonary hypertension; ryanodine receptors.


Figures

Figure 1
Figure 1
Conditional knockout of ryanodine receptor type 2 (RyR2) in vascular smooth muscle (SM) cells. A, Schematic representation of the RyR2 wild‐type (WT) allele, the allele containing loxP sequences (L2), and the floxed allele after the action of Cre recombinase (L1). B, Western blot analysis of RyR2 protein in aortic and heart tissues from control and SMRyr2 −/− mice; 40 μg aortic tissue and 10 μg heart tissue were loaded per lane. C, Immunohistochemical detection of WT (control) and SMRyr2 −/− aortae. Red indicates RyR2 staining; blue indicates stained nuclei (4’,6‐diamidino‐2‐phenylindole [DAPI]); green represents nonspecific autofluorescence. D, RyR1, RyR2, and RyR3 mRNA expression in aortic tissue. RyR1/2/3 mRNA levels were normalized against 18s mRNA. Mean mRNA expression value was arbitrarily set at 1 for WT control tissue, and relative expression was calculated for SMRyr2 −/− tissue (n=3 mice, RyR1 and RyR3 samples; n=6 mice, RyR2 WT; n=7 mice, RyR2 knockout). A.U. indicates arbitrary unit; SM‐CreERT2, SM–tamoxifen‐dependent Cre recombinase. *P<0.01 vs WT (unpaired t test).
Figure 2
Figure 2
Effects of caffeine on peripheral artery contraction. A, Original recordings of contractile force of mesenteric arteries from wild‐type (control) and smooth muscle (SM)Ryr2 −/− mice. Addition of caffeine (10 mmol/L) into the bath solution is indicated by arrows. B, Effects of caffeine on contractile force in various arteries from wild‐type mice (n=13 mesenteric arteries of 2 mice; n=4 femoral arteries of 2 mice; n=22 tibial arteries of 3 mice; n=12 aortae of 2 mice; n=10 cerebral arteries of 5 mice) and SMRyr2 −/− mice (n=16 mesenteric arteries of 2 mice; n=6 femoral arteries of 3 mice; n=24 tibial arteries of 4 mice; n=6 aortae and n=8 cerebral arteries of 5 mice). C, Contraction of mesenteric arteries with repeated applications of caffeine (10 mmol/L) at different time intervals (n=13 control rings; n=16 rings). D, Concentration‐response curves for the contractile effects of phenylephrine in mesenteric arteries of control and SMRyr2 −/− mice (n=24 rings). E, Contraction of mesenteric arteries in response to repeated applications of phenylephrine (1 μmol/L) in a Ca2+‐free bath solution (n=24 rings of 3 mice each in C through E). There were no differences between control and SMRyr2 −/− rings. n.s. indicates not significant. *P<0.05.
Figure 3
Figure 3
Changes in arterial wall intracellular Ca2+ concentration. Ca2+ fluorescence video microscopy images of mesenteric arteries from wild‐type (WT; upper) and smooth muscle (SM)Ryr2 −/− (lower) mice before (left) and after (right) application of caffeine.
Figure 4
Figure 4
Ca2+‐release events (Ca2+ sparks) in wild‐type and smooth muscle (SM)Ryr2 −/− vascular SM cells (VSMCs). A, Ca2+ fluorescence image of a Fluo‐4–loaded wild‐type (control) tibial artery SMC. B, Ca2+ fluorescence image of the same cell as in A during the occurrence of a Ca2+ spark. Two‐dimensional images were recorded at a rate of 20/s. C, Time course of Ca2+ fluorescence changes in cellular regions of interest (ROIs) without sparks (ROI a, upper) and with sparks (ROI b, lower). Presence of 10 mmol/L caffeine is indicated by horizontal lines. D, Time course of Ca2+ fluorescence changes in a ROI (similar size as in A) of an SMRyr2 −/− VSMC in the absence and presence of caffeine (10 mmol/L). E, Percentage of VSMCs with Ca2+ sparks. F, Ca2+ spark frequencies in n=15 wild‐type and n=11 SMRyr2 −/− VSMCs. G, Increases in peak Ca2+ fluorescence induced by 10 mmol/L caffeine in wild‐type (control) and SMRyr2 −/− VSMCs (n=14 cells and n=8 cells, respectively; 3 mice). F/F0, flurescence/background fluorescence. *P<0.05.
Figure 5
Figure 5
Ca2+‐release events (Ca2+ sparks) in wild‐type and smooth muscle myosin heavy chain (SMMHC)–Ryr2 −/− tibial artery smooth muscle cells (SMCs). A, Ryanodine receptor type 2 (RyR2) mRNA expression in aortic, mesenteric artery, and tibial artery tissues. mRNA levels for RyR2 were normalized against 18s mRNA. The mean mRNA expression value was arbitrarily set at 100 for wild‐type (control) tissue, and relative expression was calculated for SMMHCRyR2 −/− tissue (n=4 each). P value is given vs control (1‐sample t test). B, Ca2+ fluorescence image of a Fluo‐4‐AM–loaded control vascular SMC (VSMC). C, Ca2+ fluorescence image of the same cell as in A during the occurrence of a Ca2+ spark. Two‐dimensional images were recorded at a rate of 5/s. D, Time course of Ca2+ fluorescence changes in cellular regions of interest (ROIs) without sparks (ROI a, left) and with sparks (ROI b, right). E, Time course of Ca2+ fluorescence changes in an ROI (similar size as that in A) of an SMMHCRyr2 −/− VSMC. F, Percentage of VSMCs with Ca2+ sparks. G, Ca2+ spark frequencies in VSMCs from control and SMMHCRyr2 −/− mice. H, Amplitude of Ca2+ sparks (n=123 cells of 4 control mice; n=124 cells of 4 SMMHCRyr2 −/− mice). A.U. indicates arbitrary unit. F/F0, flurescence/background fluorescence. *P<0.05.
Figure 6
Figure 6
Line‐scan imaging of Ca2+‐release events (Ca2+ sparks) in wild‐type and smooth muscle (SM)Ryr2 −/− vascular SM cells (SMCs). A, Confocal line‐scan image of a Fluo‐3‐AM–loaded tibial artery wild‐type (control) cell showing the time course of Ca2+ sparks. The line‐scan image duration was 5 s, and each line was 4 ms. B, Ca2+ spark frequency in tibial artery SMCs from control (n=52) and SMRyr2 −/− (n=42) mice. *P<0.05.
Figure 7
Figure 7
Spontaneous transient outward currents (STOCs) caused by Ca2+‐release events. A and B, Original recordings of STOCs in tibial artery smooth muscle (SM) cells isolated from wild‐type (control) (A) and SMRyr2 −/− (B) mice. The holding potential was stepwise increased in 20‐mV increments from −40 to 0 mV. C through E, Comparison of STOC characteristics at −20 mV. Percentage of cells with STOCs (C), STOC frequencies (D), and mean STOC amplitudes (E). n=31 cells of 11 control mice; n=25 cells of 9 SMRyr2 −/− mice. *P<0.05.
Figure 8
Figure 8
Functional large‐conductance Ca2+‐sensitive K+ channels in wild‐type and smooth muscle (SM)Ryr2 −/− vascular SM cells (SMCs). A, Original current traces in wild‐type (control) and SMRyr2 −/− tibial artery SMCs before (control) and after application of 5 or 10 μmol/L A23187. B, Summary of the results (n=7 cells of 4 control mice; n=7 cells of 3 SMRyr2 −/− mice). I/I0, A23187‐induced current/basal current. n.s. indicates not significant.
Figure 9
Figure 9
Arterial constriction induced by inhibition of Ca2+‐release events with ryanodine in wild‐type and smooth muscle (SM)Ryr2 −/− peripheral arteries. A, Application of ryanodine (10 μmol/L) provoked a strong constriction of isolated wild‐type (control) mesenteric arteries. B, Ryanodine‐induced constriction was reduced in SMRyr2 −/− arteries. C, Summary of the results (n=6 cells of 4 control mice; n=6 cells of 5 SMRyr2 −/− mice). The vertical gray and white bars in A and B represent the time points for the analyzed myogenic tone values. *P<0.05.
Figure 10
Figure 10
Function of ryanodine receptor type 2 (RyR2) in hypoxic pulmonary vasoconstriction. A, Changes in mean pulmonary arterial pressure (ΔPpa mean) observed in isolated perfused and ventilated lungs from wild‐type (control; closed squares, n=7 mice) and smooth muscle (SM)Ryr2 −/− (open squares, n=7 mice) mice after induction of hypoxic (1% O2) ventilation. B, Pulmonary pressure response (area under the curve [AUC]) in control and SMRyr2 −/− lungs attributable to short‐term (left, phase 1) and long‐term (right, phase 2) phases of hypoxic pulmonary vasoconstriction. C, Flow‐induced Ppa increase in control (closed symbols) and SMRyr2 −/− (open symbols) lungs under normoxia (squares), acute hypoxia (triangles), and chronic hypoxia (circles). D, Pulmonary pressure response after application of caffeine (10 mmol/L) in control (closed symbols) and SMRyr2 −/− (open symbols) lungs. Similar effects were observed with 3 consecutive applications of caffeine. E, The peak increase in Ppa caused by the first application of caffeine is shown. HPV, hypoxic pulmonary vasoconstriction; Q, flow rate. *P<0.05.
Figure 11
Figure 11
Blood flow recovery after femoral artery ligation. A, Artery structure of right and left hind limbs of a wild‐type (control) mouse after polyurethane treatment. Left: Position of the femoral artery ligation is marked by an arrow. B, Recovery of right hind limb perfusion after femoral artery ligation in control (n=4–10) and smooth muscle (SM)Ryr2 −/− (n=3–8) mice relative to the left hind limb perfusion. P≥0.05 for all comparisons. Arrows mark native collateral arteries in the ligated and unligated hind limbs, revealing outward remodeling of arteries after femoral artery ligation. Native collateral arteries refer to collaterals I and II. Collateral III is newly developed within 1 to 3 weeks after the ligation.
Figure 12
Figure 12
Mean arterial blood pressure (MAP) in smooth muscle (SM)Ryr2 −/− mice. Time course of MAP (A), systolic blood pressure (SBP; B), diastolic blood pressure (DBP; C), and heart rate (implantation of the telemetric sensor at day 0; D) in SMRyr2 −/− mice. E, Summary of the results. Mean±SEM values were calculated for time intervals before (days 6–14) and after (days 21–29) tamoxifen administration (n=6 mice). Tamoxifen did not change these parameters in wild‐type (WT; control) mice (ΔMAP, −0.8 mm Hg; ΔSBP, −1.2 mm Hg; ΔDBP, 0.0 mm Hg; Δheart rate, 7.7 beats per minute [bpm]; no significant differences). F, MAP, SBP, and DBP did not change in WT mice before and after administration of tamoxifen (n=6 mice each).

Similar articles

Cited by

References

    1. Bevan JA, Garcia‐Roldan JL, Joyce EH. Resistance artery tone is influenced independently by pressure and by flow. Blood Vessels. 1990;27:202–207. - PubMed
    1. Moosmang S, Schulla V, Welling A, Feil R, Feil S, Wegener JW, Hofmann F, Klugbauer N. Dominant role of smooth muscle L‐type calcium channel Cav1.2 for blood pressure regulation. EMBO J. 2003;22:6027–6034. - PMC - PubMed
    1. Nelson MT, Patlak JB, Worley JF, Standen NB. Calcium channels, potassium channels, and voltage dependence of arterial smooth muscle tone. Am J Physiol. 1990;259:C3–C18. - PubMed
    1. Wang SQ, Wei C, Zhao G, Brochet DX, Shen J, Song LS, Wang W, Yang D, Cheng H. Imaging microdomain Ca2+ in muscle cells. Circ Res. 2004;94:1011–1022. - PubMed
    1. Jaggar JH, Wellman GC, Heppner TJ, Porter VA, Perez GJ, Gollasch M, Kleppisch T, Rubart M, Stevenson AS, Lederer WJ, Knot HJ, Bonev AD, Nelson MT. Ca2+ channels, ryanodine receptors and Ca(2+)‐activated K+ channels: a functional unit for regulating arterial tone. Acta Physiol Scand. 1998;164:577–587. - PubMed

Publication types

MeSH terms

Substances