

Past, present, and future of global health financing: a review of development assistance, government, out-of-pocket, and other private spending on health for 195 countries, 1995-2050
- PMID: 31030984
- PMCID: PMC6548764
- DOI: 10.1016/S0140-6736(19)30841-4
Past, present, and future of global health financing: a review of development assistance, government, out-of-pocket, and other private spending on health for 195 countries, 1995-2050
Erratum in
-
Department of Error.Lancet. 2021 Sep 11;398(10304):956. doi: 10.1016/S0140-6736(21)01806-7. Lancet. 2021. PMID: 34509230 Free PMC article. No abstract available.
Abstract
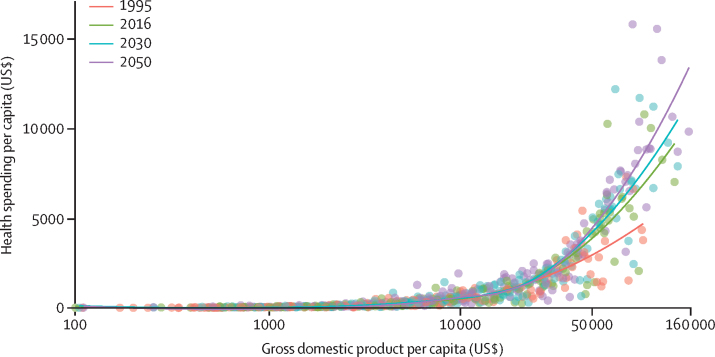
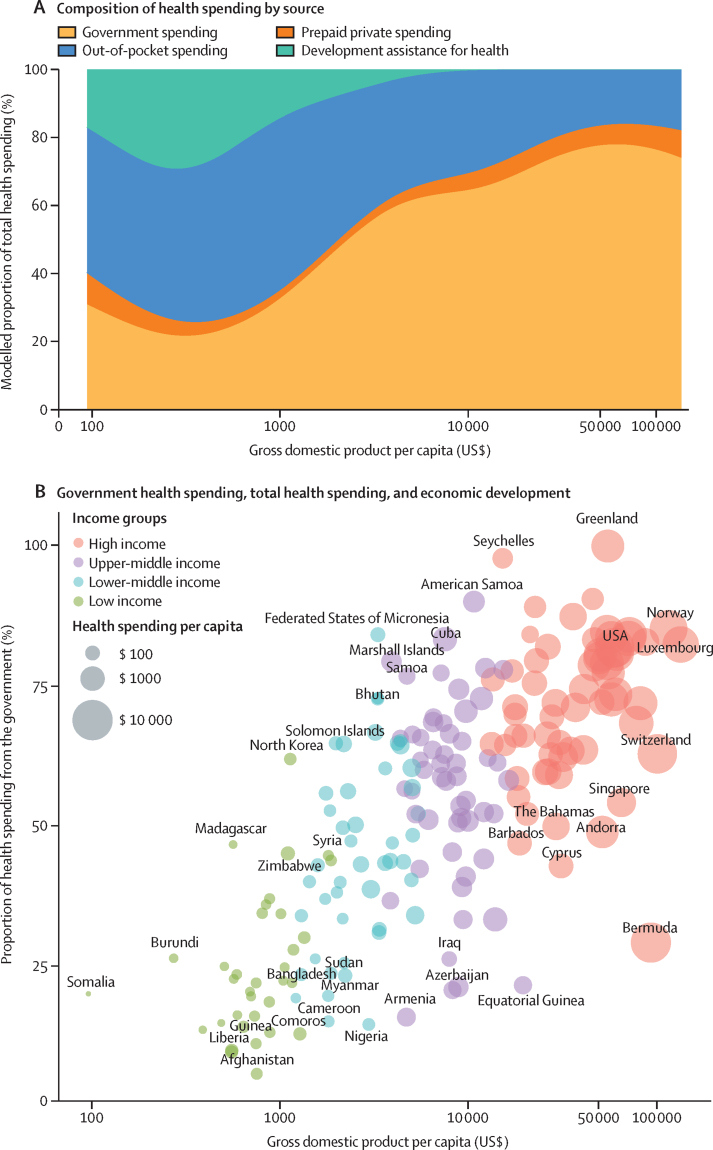
Background: Comprehensive and comparable estimates of health spending in each country are a key input for health policy and planning, and are necessary to support the achievement of national and international health goals. Previous studies have tracked past and projected future health spending until 2040 and shown that, with economic development, countries tend to spend more on health per capita, with a decreasing share of spending from development assistance and out-of-pocket sources. We aimed to characterise the past, present, and predicted future of global health spending, with an emphasis on equity in spending across countries.
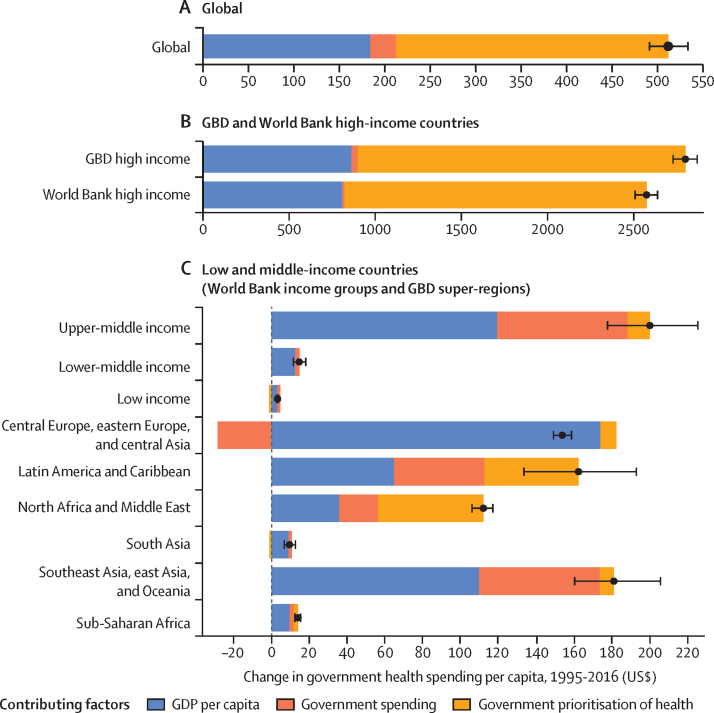
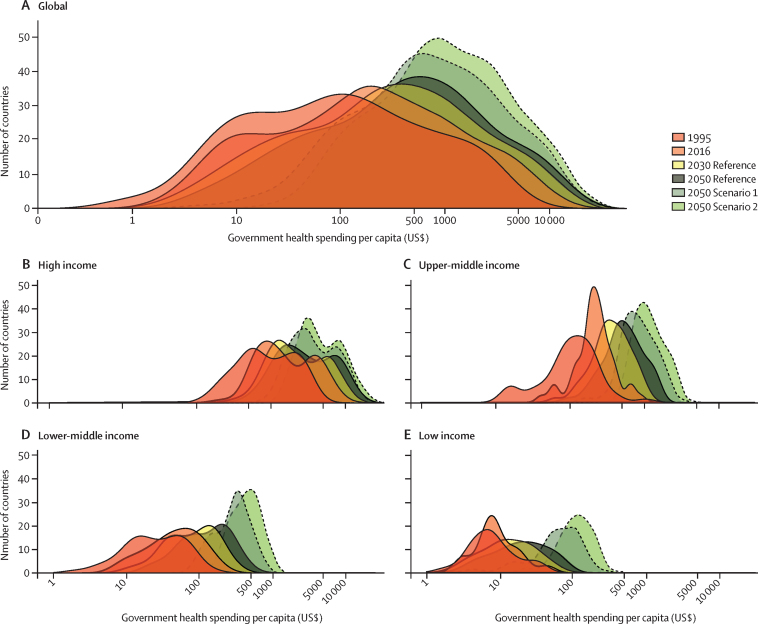
Methods: We estimated domestic health spending for 195 countries and territories from 1995 to 2016, split into three categories-government, out-of-pocket, and prepaid private health spending-and estimated development assistance for health (DAH) from 1990 to 2018. We estimated future scenarios of health spending using an ensemble of linear mixed-effects models with time series specifications to project domestic health spending from 2017 through 2050 and DAH from 2019 through 2050. Data were extracted from a broad set of sources tracking health spending and revenue, and were standardised and converted to inflation-adjusted 2018 US dollars. Incomplete or low-quality data were modelled and uncertainty was estimated, leading to a complete data series of total, government, prepaid private, and out-of-pocket health spending, and DAH. Estimates are reported in 2018 US dollars, 2018 purchasing-power parity-adjusted dollars, and as a percentage of gross domestic product. We used demographic decomposition methods to assess a set of factors associated with changes in government health spending between 1995 and 2016 and to examine evidence to support the theory of the health financing transition. We projected two alternative future scenarios based on higher government health spending to assess the potential ability of governments to generate more resources for health.
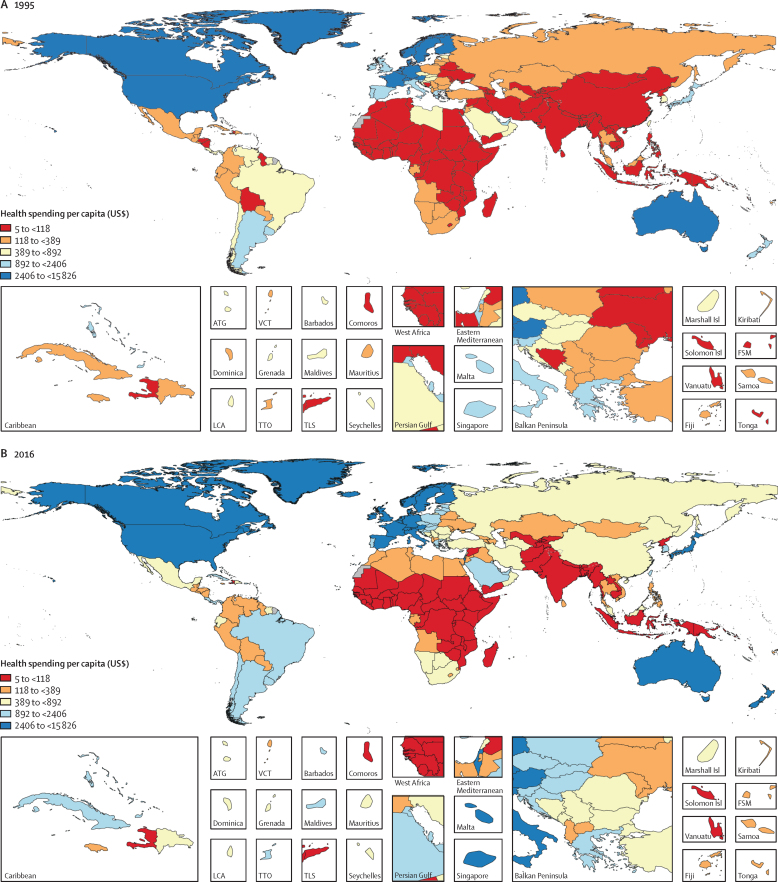
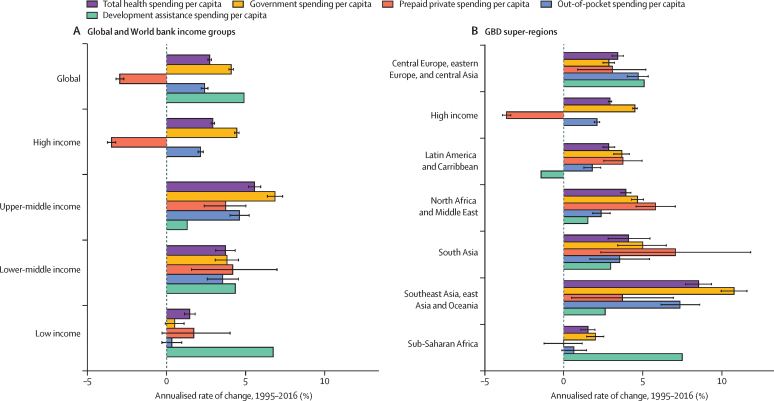
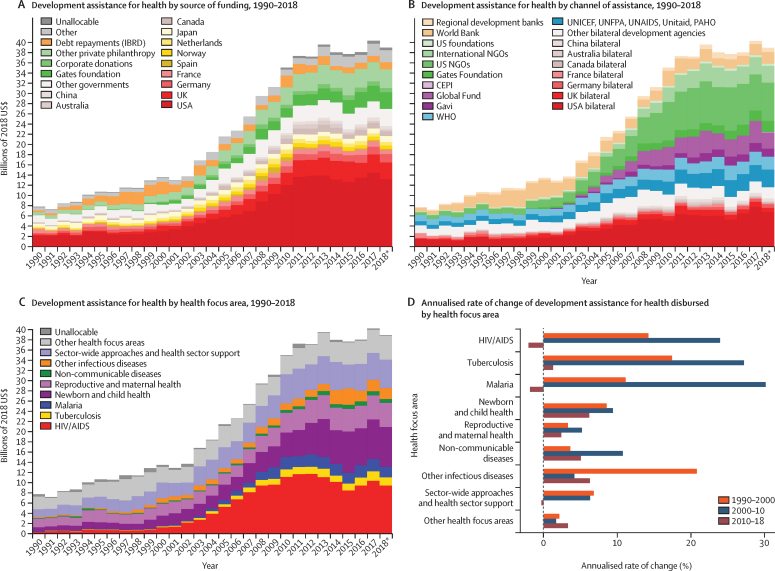
Findings: Between 1995 and 2016, health spending grew at a rate of 4·00% (95% uncertainty interval 3·89-4·12) annually, although it grew slower in per capita terms (2·72% [2·61-2·84]) and increased by less than $1 per capita over this period in 22 of 195 countries. The highest annual growth rates in per capita health spending were observed in upper-middle-income countries (5·55% [5·18-5·95]), mainly due to growth in government health spending, and in lower-middle-income countries (3·71% [3·10-4·34]), mainly from DAH. Health spending globally reached $8·0 trillion (7·8-8·1) in 2016 (comprising 8·6% [8·4-8·7] of the global economy and $10·3 trillion [10·1-10·6] in purchasing-power parity-adjusted dollars), with a per capita spending of US$5252 (5184-5319) in high-income countries, $491 (461-524) in upper-middle-income countries, $81 (74-89) in lower-middle-income countries, and $40 (38-43) in low-income countries. In 2016, 0·4% (0·3-0·4) of health spending globally was in low-income countries, despite these countries comprising 10·0% of the global population. In 2018, the largest proportion of DAH targeted HIV/AIDS ($9·5 billion, 24·3% of total DAH), although spending on other infectious diseases (excluding tuberculosis and malaria) grew fastest from 2010 to 2018 (6·27% per year). The leading sources of DAH were the USA and private philanthropy (excluding corporate donations and the Bill & Melinda Gates Foundation). For the first time, we included estimates of China's contribution to DAH ($644·7 million in 2018). Globally, health spending is projected to increase to $15·0 trillion (14·0-16·0) by 2050 (reaching 9·4% [7·6-11·3] of the global economy and $21·3 trillion [19·8-23·1] in purchasing-power parity-adjusted dollars), but at a lower growth rate of 1·84% (1·68-2·02) annually, and with continuing disparities in spending between countries. In 2050, we estimate that 0·6% (0·6-0·7) of health spending will occur in currently low-income countries, despite these countries comprising an estimated 15·7% of the global population by 2050. The ratio between per capita health spending in high-income and low-income countries was 130·2 (122·9-136·9) in 2016 and is projected to remain at similar levels in 2050 (125·9 [113·7-138·1]). The decomposition analysis identified governments' increased prioritisation of the health sector and economic development as the strongest factors associated with increases in government health spending globally. Future government health spending scenarios suggest that, with greater prioritisation of the health sector and increased government spending, health spending per capita could more than double, with greater impacts in countries that currently have the lowest levels of government health spending.
Interpretation: Financing for global health has increased steadily over the past two decades and is projected to continue increasing in the future, although at a slower pace of growth and with persistent disparities in per-capita health spending between countries. Out-of-pocket spending is projected to remain substantial outside of high-income countries. Many low-income countries are expected to remain dependent on development assistance, although with greater government spending, larger investments in health are feasible. In the absence of sustained new investments in health, increasing efficiency in health spending is essential to meet global health targets.
Funding: Bill & Melinda Gates Foundation.
Copyright © 2019 The Author(s). Published by Elsevier Ltd. This is an Open Access article under the CC BY 4.0 license. Published by Elsevier Ltd.. All rights reserved.
Figures

Comment in
-
Brazil's health-care system.Lancet. 2019 Nov 30;394(10213):1992. doi: 10.1016/S0140-6736(19)32630-3. Lancet. 2019. PMID: 31789219 No abstract available.
References
-
- WHO . WHO; 2010. World Health Report 2010—health systems financing: the path to universal coverage.https://www.who.int/whr/2010/en/ - PMC - PubMed
- WH, orld Health Report 2010—health systems financing: the path to universal coverag, e 201, 0 WH, ttps://www.who.int/whr/2010/en/
-
- Gottret P, Schieber G. The International Bank for Reconstruction and Development/The World Bank; Washington, DC: 2006. Health financing revisited: a practioner's guide.https://openknowledge.worldbank.org/handle/10986/7094
- P Gottret, G Schieber. Health financing revisited: a practioner's guid, e 200, 6 The International Bank for Reconstruction and Development/The World Ban, ashington, D, ttps://openknowledge.worldbank.org/handle/10986/7094
-
- Reeves A, Gourtsoyannis Y, Basu S, McCoy D, McKee M, Stuckler D. Financing universal health coverage—effects of alternative tax structures on public health systems: cross-national modelling in 89 low-income and middle-income countries. Lancet. 2015;386:274–280. - PMC - PubMed
- A Reeves, Y Gourtsoyannis, S Basu, D McCoy, M McKee, D Stuckler. Financing universal health coverage—effects of alternative tax structures on public health systems: cross-national modelling in 89 low-income and middle-income countries. Lancet, 386, 2015, 274–280 - PMC - PubMed
-
- Xu K, Evans DB, Kawabata K, Zeramdini R, Klavus J, Murray CJ. Household catastrophic health expenditure: a multicountry analysis. Lancet. 2003;362:111–117. - PubMed
- K Xu, DB Evans, K Kawabata, R Zeramdini, J Klavus, CJ Murray. Household catastrophic health expenditure: a multicountry analysis. Lancet, 362, 2003, 111–117 - PubMed
MeSH terms
LinkOut - more resources
Full Text Sources
Medical
Miscellaneous
