. 2019 May 2;177(4):896-909.e20.
doi: 10.1016/j.cell.2019.02.017. Epub 2019 Apr 25.

Insulin/IGF-1 Drives PERIOD Synthesis to Entrain Circadian Rhythms with Feeding Time

Affiliations

Insulin/IGF-1 Drives PERIOD Synthesis to Entrain Circadian Rhythms with Feeding Time

Priya Crosby et al. Cell. .

Abstract

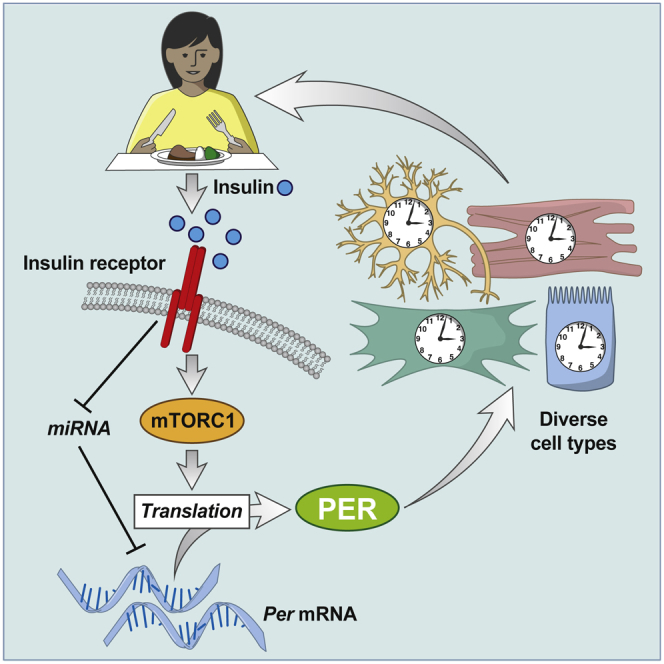
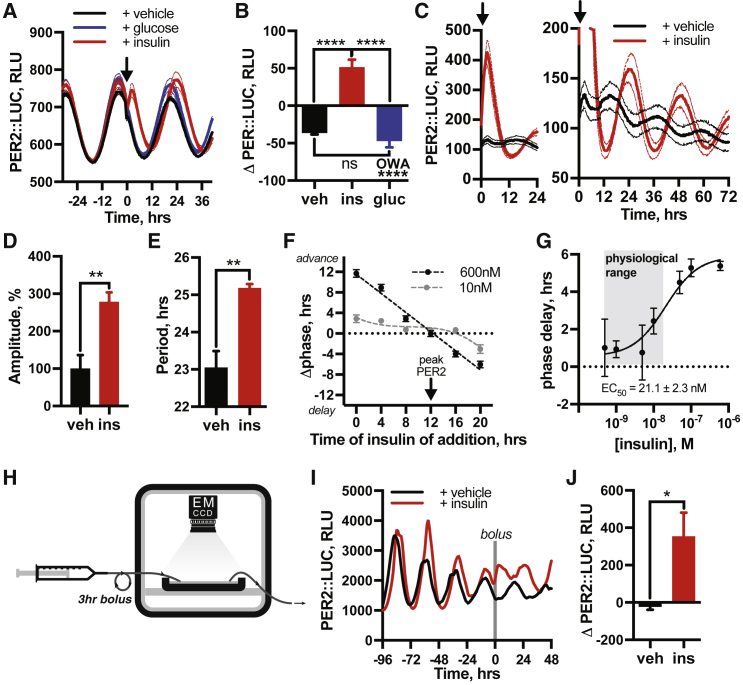
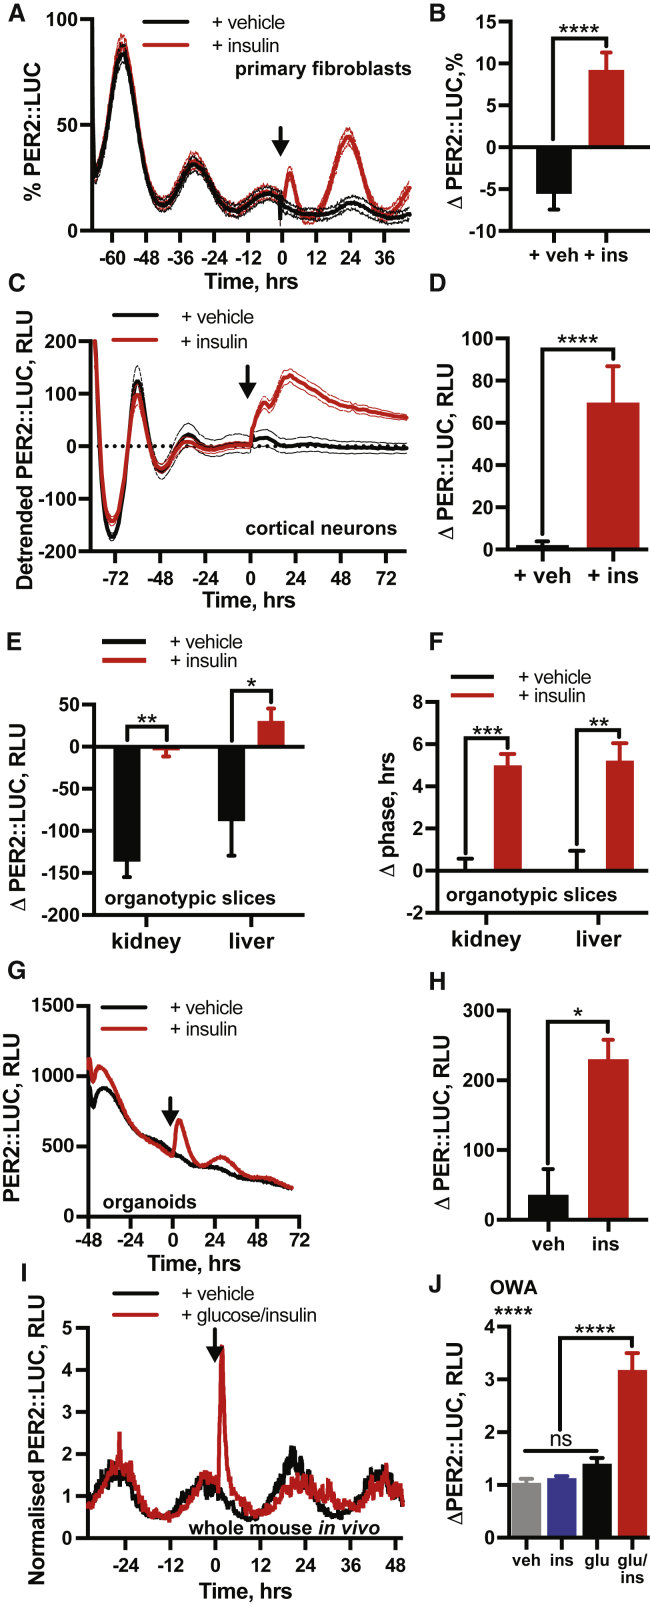
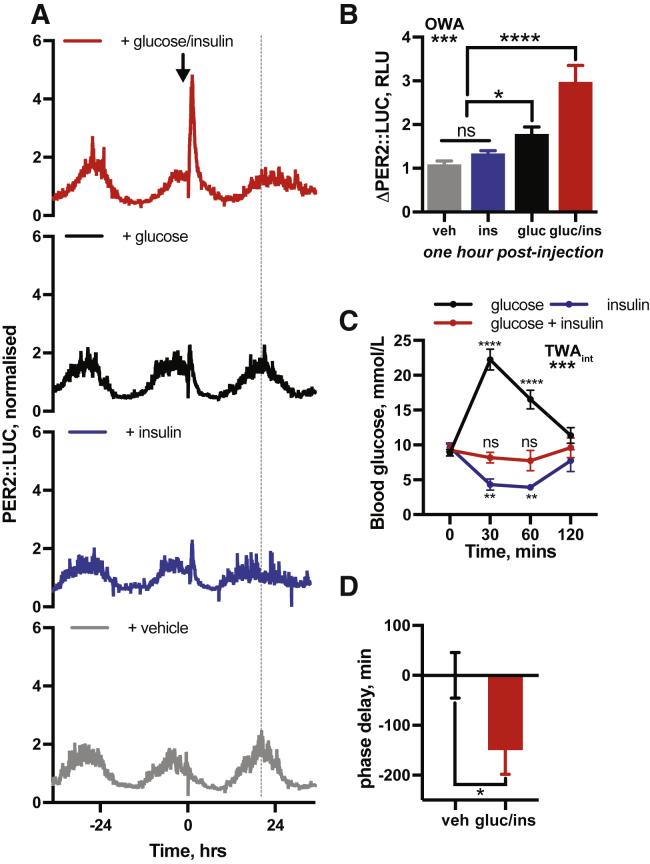
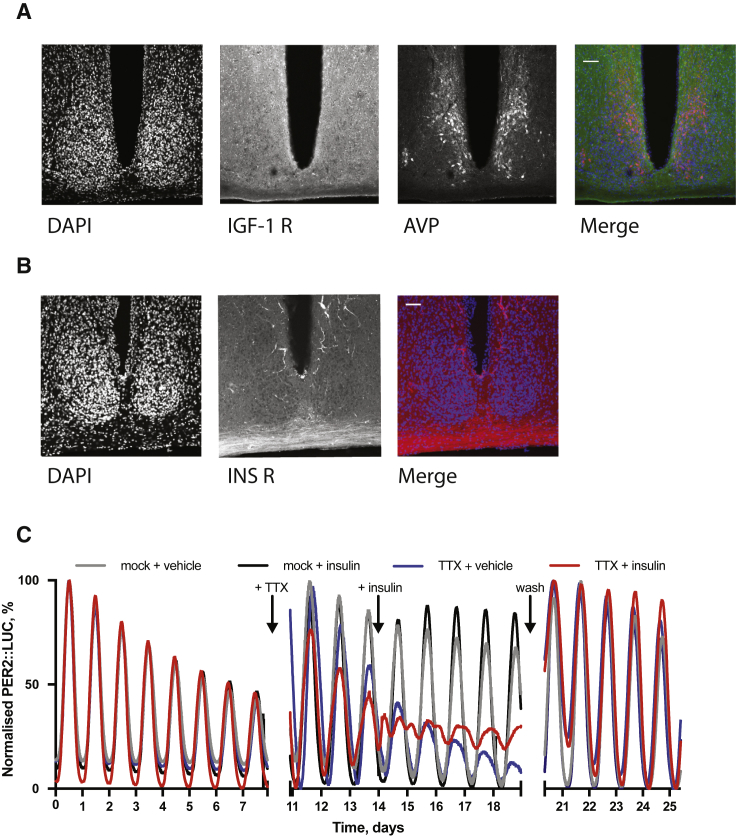
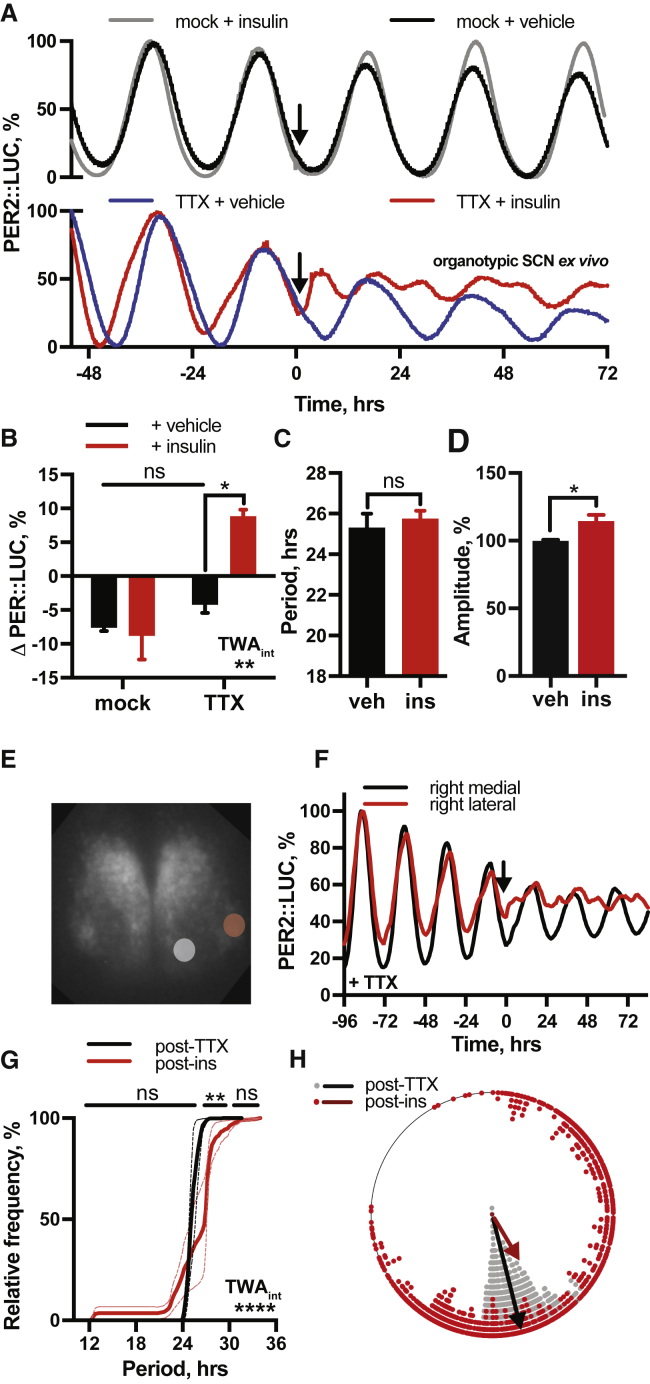
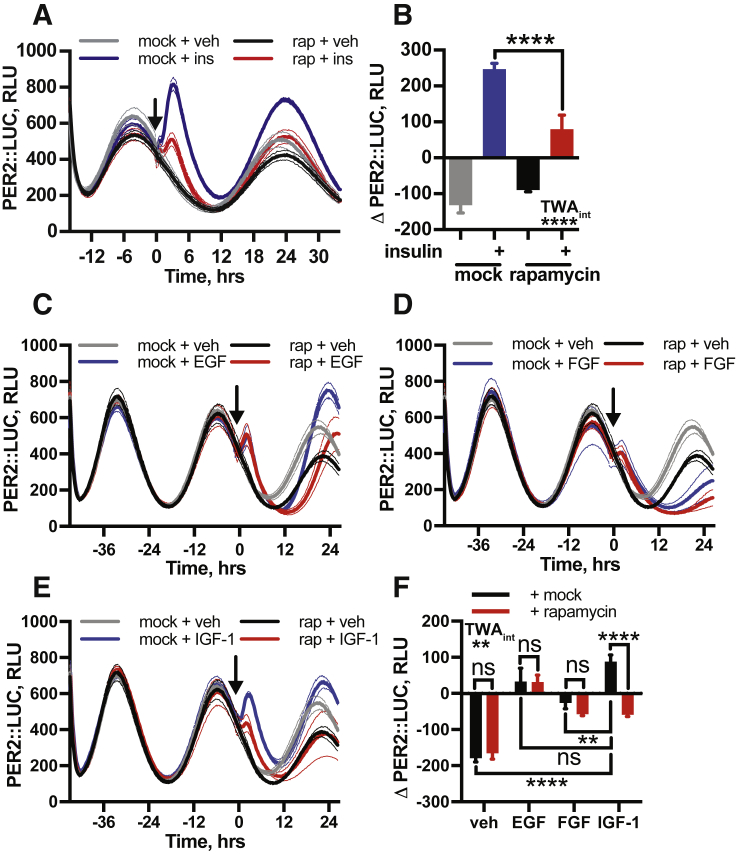
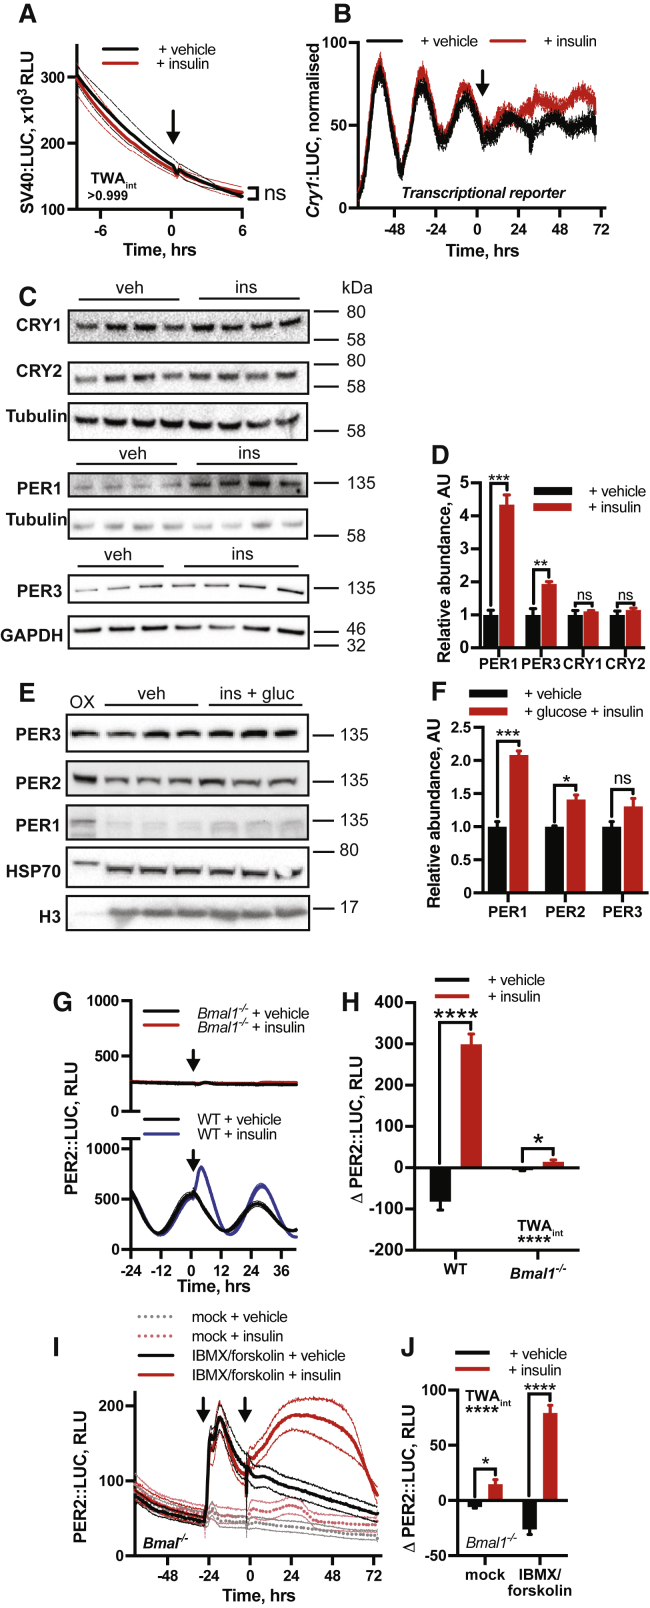
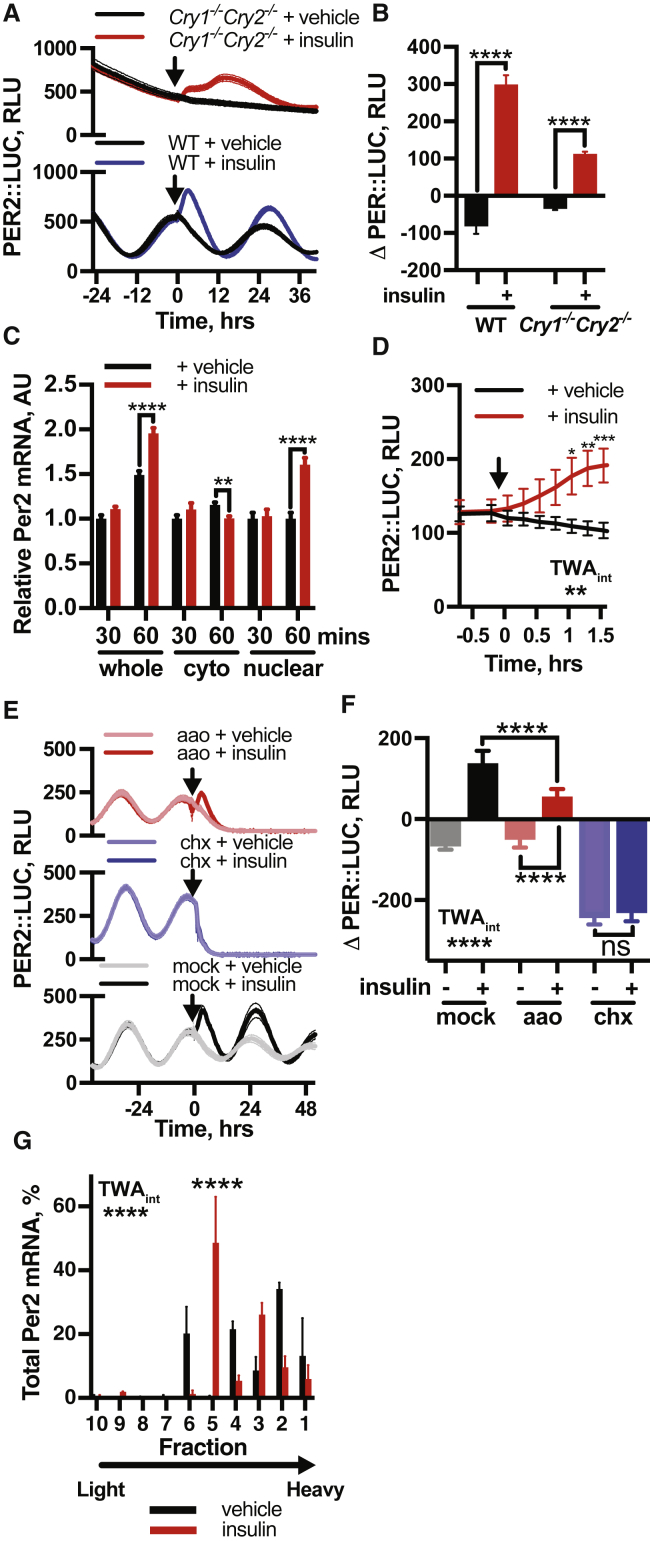
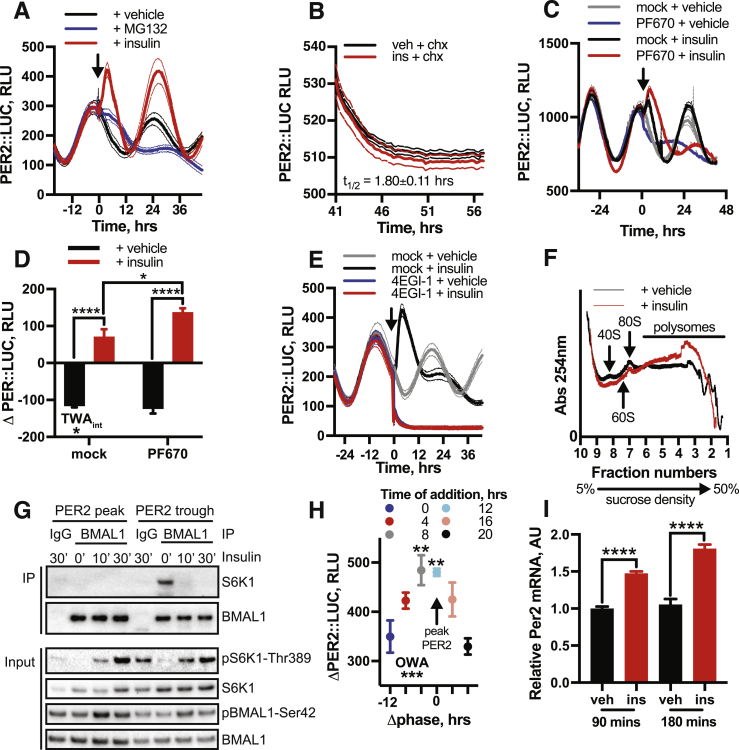
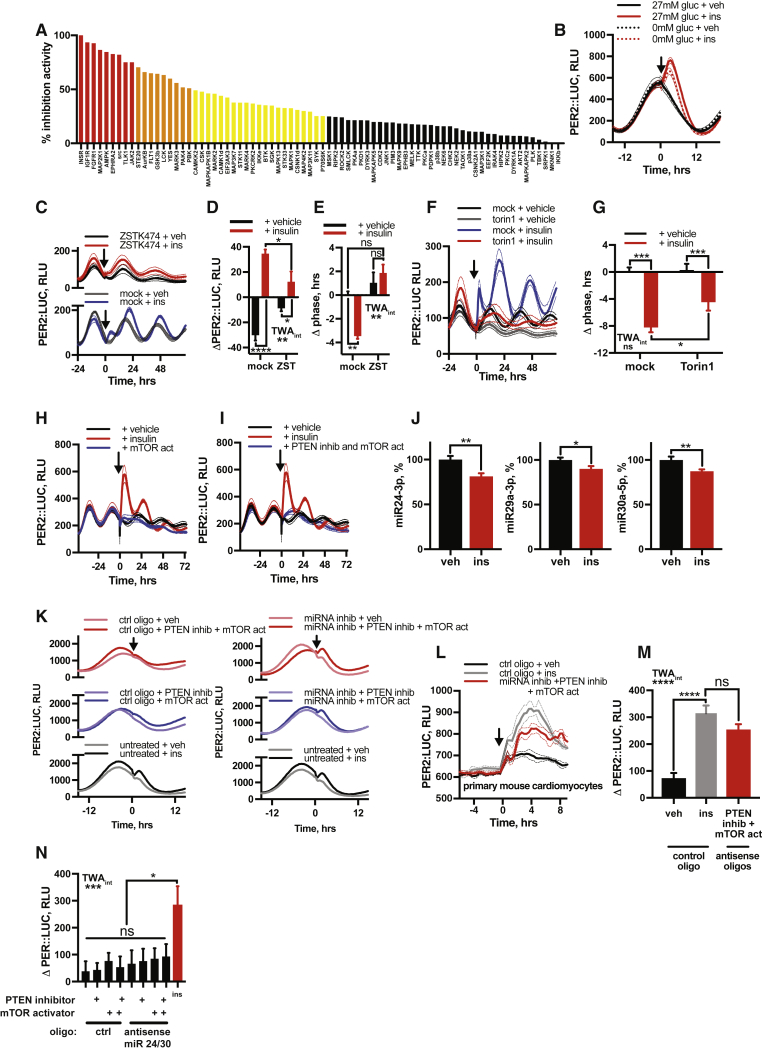
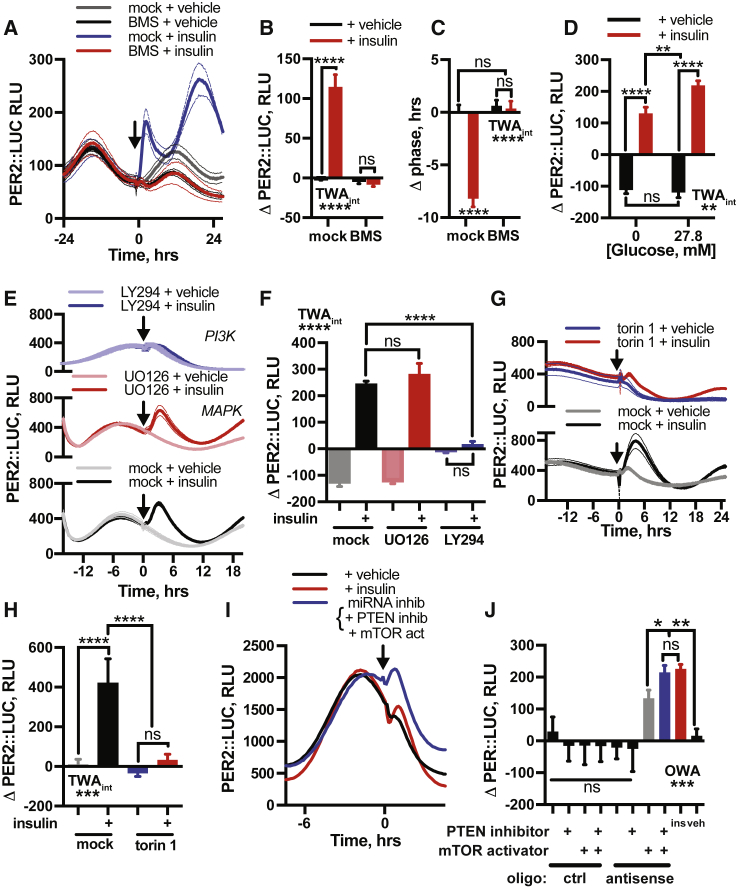
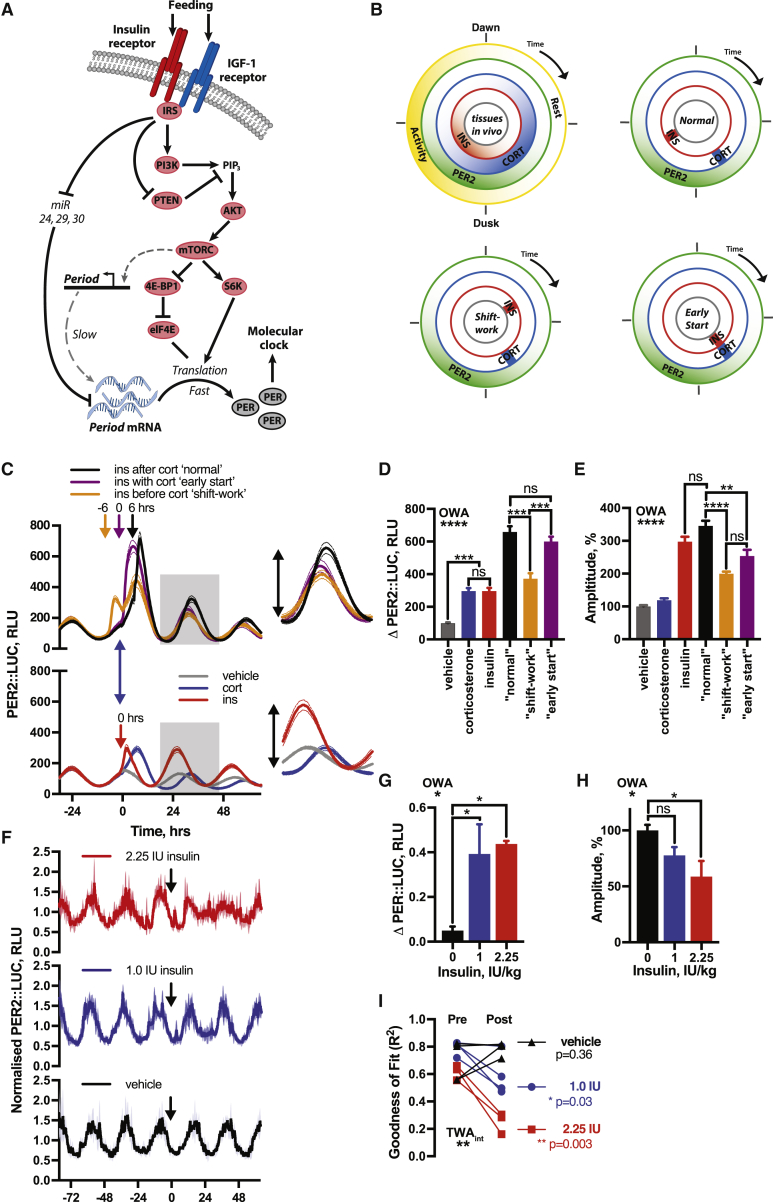
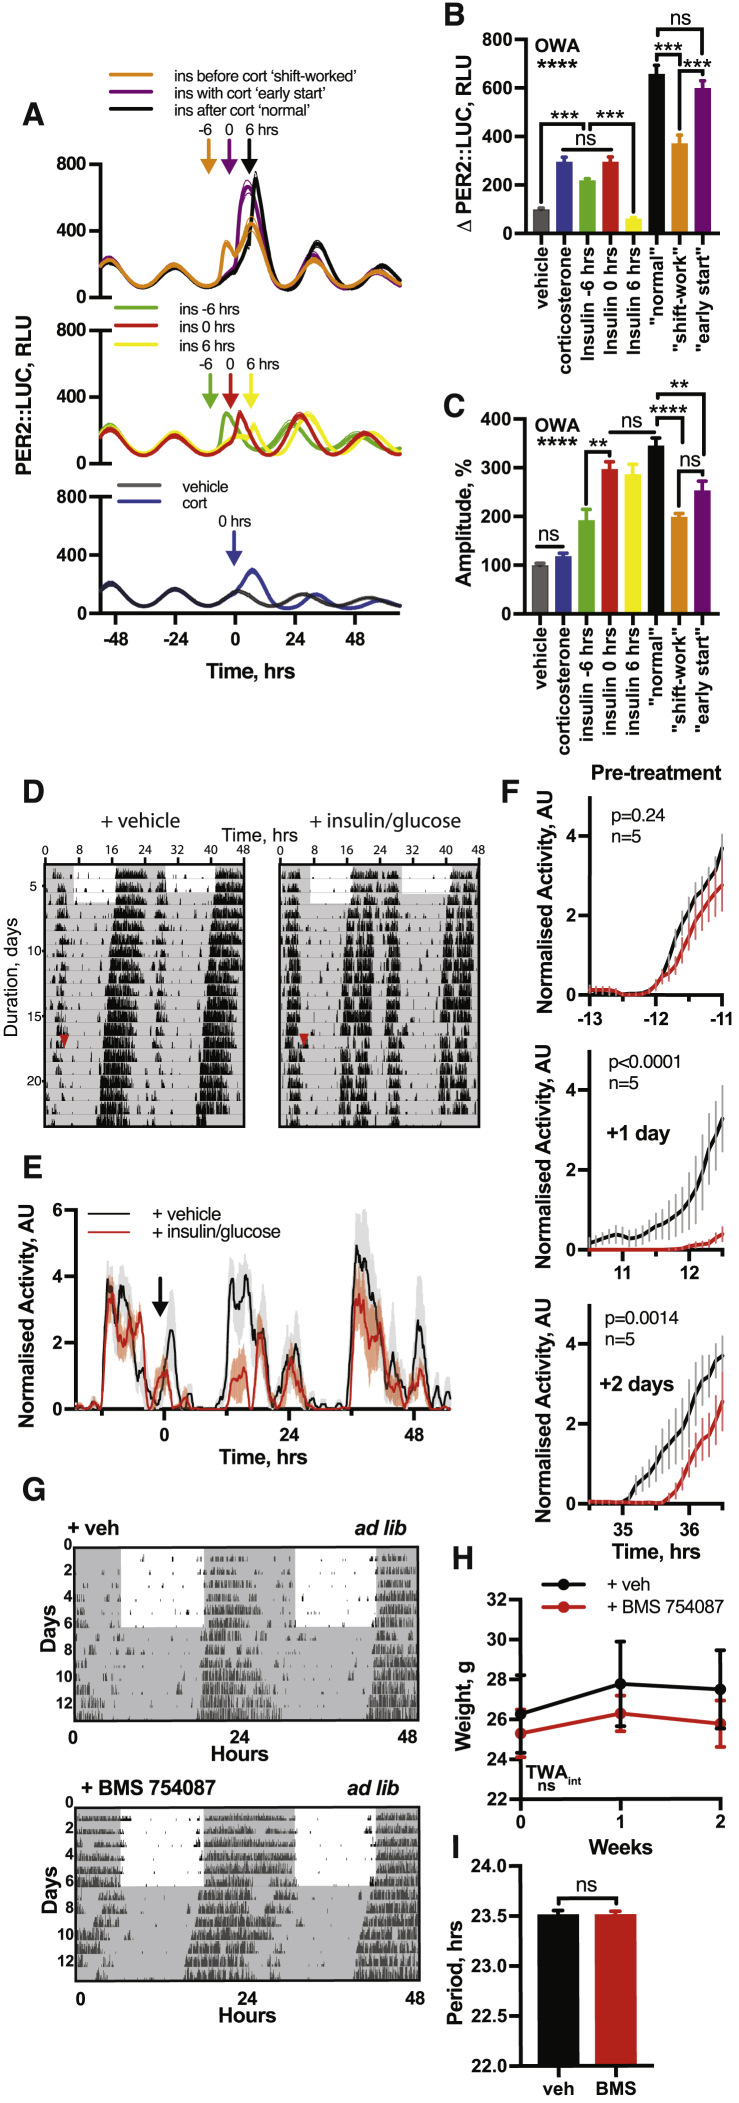
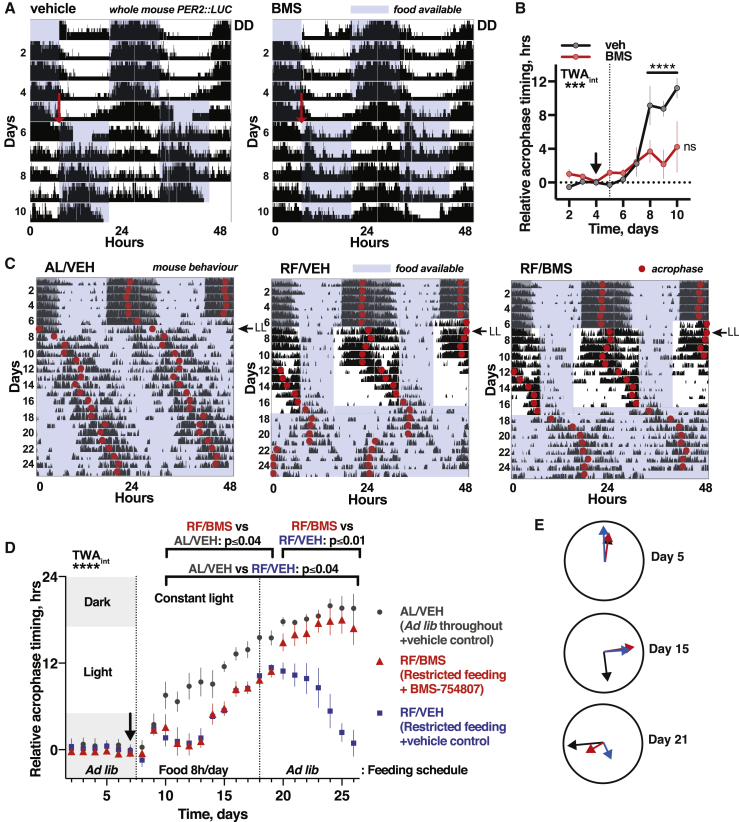
In mammals, endogenous circadian clocks sense and respond to daily feeding and lighting cues, adjusting internal ∼24 h rhythms to resonate with, and anticipate, external cycles of day and night. The mechanism underlying circadian entrainment to feeding time is critical for understanding why mistimed feeding, as occurs during shift work, disrupts circadian physiology, a state that is associated with increased incidence of chronic diseases such as type 2 (T2) diabetes. We show that feeding-regulated hormones insulin and insulin-like growth factor 1 (IGF-1) reset circadian clocks in vivo and in vitro by induction of PERIOD proteins, and mistimed insulin signaling disrupts circadian organization of mouse behavior and clock gene expression. Insulin and IGF-1 receptor signaling is sufficient to determine essential circadian parameters, principally via increased PERIOD protein synthesis. This requires coincident mechanistic target of rapamycin (mTOR) activation, increased phosphoinositide signaling, and microRNA downregulation. Besides its well-known homeostatic functions, we propose insulin and IGF-1 are primary signals of feeding time to cellular clocks throughout the body.

Keywords: IGF-1; PERIOD; circadian; food entrainment; insulin; mTORC1; miRNA.


Figures

None
Graphical abstract
Figure 1
Figure 1
Insulin Determines Circadian Phase, Period, and Amplitude In Vitro (A and B) Acute addition of 600 nM insulin, but not 5.5 mM glucose, acutely increases PER2::LUC bioluminescence (ΔPER2::LUC), measured in relative luminescence units (RLU), (n = 4, one-way ANOVA, OWA, Tukey’s multiple comparisons test [MCT]). (C–F) Insulin acutely induces PER2::LUC (C), and changes the (D) amplitude, (E) period (n ≥ 4, t test), and (F) phase of PER2 expression. Phase-response curve (PRC) and preferred fit (extra sum-of-squares F test) for fibroblasts treated with 600 nM (n = 4, p <0.0001, horizontal vs. straight line fit, type 0 PRC) or 10 nM insulin (n = 6, p = 0.025, straight line vs. cubic fit, type 1 PRC). (G) Dose-response curve showing phase shift in PER2::LUC rhythm versus final insulin concentration applied 5 h after PER2 peak (n = 4). (H and I) Perfusion culture (H) with 3 h insulin bolus (I) induces PER2::LUC in fibroblasts (n = 3, representative trace shown); only here was insulin removed after addition. (J) ΔPER2::LUC by insulin under perfusion (n = 3, t test). Mean ± SEM shown for all panels except (I).
Figure 2
Figure 2
Insulin Induces PER2 in Primary Cells, Tissues, and Organoids In Vitro and In Vivo (A and B) Insulin added to primary PER2::LUC fibroblasts (A) with quantification of induction (B) (n = 4, min-max normalized, t test). (C and D) Insulin induces PER2 in dissociated PER2::LUC cortical neurons (C) with quantification of induction (D) (n = 8, one-phase exponential detrended, t test). (E and F) PER2::LUC induction (E) and phase shift by insulin (F) in mouse kidney and liver explants (n ≥ 4, t test). (G and H) Insulin acutely increases PER2::LUC in small intestinal organoids (G; n = 3, representative), with quantification of induction (H; n = 3, t test). (I and J) Combined intraperitoneal injection of insulin (2.25 U/kg) and glucose (3 g/kg) significantly increases PER2 expression after 2 h (I) (n ≥ 4, full traces in Figure S1), quantified in (J) (OWA, Dunnett’s MCT). Mean ± SEM for all panels except (G).
Figure S1
Figure S1
Insulin Affects Circadian Gene Expression In Vivo, Related to Figure 2 (A) Bioluminescent recordings of PER2::LUC mice following i.p. injection of insulin (2.25 IU/kg) or glucose (3 g/kg) or insulin and glucose in combination. Arrow indicates timing of i.p. injection. Grey line indicates timing of PER2::LUC peak in the vehicle-treated group (n ≥ 4, representative). Glucose/insulin and vehicle traces repeated from Figure 2H. (B) Quantification of the change in PER2::LUC signal at 1 h following i.p. injection (n ≥ 4, 1-way ANOVA, Tukey’s multiple comparisons test). (C) Circulating blood glucose sampled from mouse-tail following i.p. injection as in Figure S1A (n = 4, mean ± SEM, 2-way ANOVA, Dunnett’s multiple comparisons test versus t = 0 reported). (D) Quantification of difference in phase of PER2::LUC expression in vivo between the vehicle and insulin/glucose injected groups, from Figure S1A (Welch’s t test, one tailed). Values are relative to the vehicle-treated group.
Figure S2
Figure S2
Insulin and IGF-1 Receptor Expression throughout the SCN, Related to Figure 3 (A) Immunohistochemistry for the IGF-1 receptor and (B) insulin receptor in the SCN (representative, n = 3). Scale bar represents 50 μm. (C) Addition of insulin to organotypic PER2::LUC SCN slices has no significant effect on the phase or period of oscillation. An effect on phase is observed when slices are pre-treated with tetrodotoxin (TTX) prior to insulin addition. Pre-recording 0-180 h, TTX added after 200 h, insulin added at 338 h, wash-off 490-620 h (n ≥ 3, representative, extended from Figure 3A).
Figure 3
Figure 3
The SCN Is Robust against Resetting by Insulin (A–D) Insulin added to SCN slices (A) (top) does not (B) induce PER2::LUC (n ≥ 3, representative) or (C) alter period, although (D) amplitude is modestly increased (n = 5, t test). SCN pre-treated with tetrodotoxin (TTX) (A) (bottom) do show (B) acute PER2 induction by insulin (n ≥ 3, representative, TWA, Tukey’s MCT). See also Figure S2. (E and F) Time-lapse analysis of TTX-treated SCN (E) shows lateral SCN (red circle) is more responsive to insulin (F) (n = 3, representative). (G) Pixel analysis of this region shows cells maintain ∼24 h period following insulin with no significant increase in ∼12 h periods (n = 3, TWA, Sidak MCT). (H) Broader distribution of phases; pre-insulin = 11.05 ± 0.03 h (n = 822 pixels across 3 slices), post-insulin = 9.49 ± 0.17 h, (n = 737 pixels across 3 slices), F test variance comparison of 29.8, p < 0.0001. Mean ± SEM shown where applicable. See also Figure S3.
Figure S3
Figure S3
Insulin and IGF-1 Induce PER Expression through Similar Mechanisms, Related to Figures 3 and 5 (A,B) Prior treatment with mTOR inhibitor rapamycin significantly attenuates the acute PER2::LUC induction following insulin addition (n = 4, mean ± SEM, 2-way ANOVA, Tukey’s multiple comparisons test). (C) EGF and (D) FGF elicit a modest but significant induction of PER2 that is not mTOR dependent. (E) IGF-1 phenocopies mTOR-dependent induction of PER2 by insulin, demonstrated by the attenuation of this response by rapamycin. (F) Quantification of the effect of these treatments upon acute PER2 expression (n ≥ 3, mean ± SEM, 2-way ANOVA, Tukey’s multiple comparisons test). All experiments were performed in PER2::LUC fibroblasts.
Figure S4
Figure S4
Insulin Selectively Increases PER Expression, Related to Figure 4 (A) No significant increase in luciferase expression is observed following insulin application to fibroblasts expressing luciferase constitutively under the control of the SV40 promoter (n = 3, mean ± SEM, 2-way ANOVA, Sidak’s multiple comparisons test). (B) Addition of insulin to cells expressing Cry1:LUC produces a phase shift but no acute induction (n = 4, mean ± SEM). (C) Western blotting on whole cell lysate from PER2::LUC fibroblasts shows a significant increase in the abundance of PER1 and PER3 following insulin treatment but no significant increase in the abundance of CRY1 or CRY2 (n ≥ 3). All samples were harvested 3 h after insulin addition. (D) Quantification of western blotting, normalized against relevant loading control (n ≥ 3, mean ± SEM, Welch’s t test). E, F Western blotting on mouse livers harvested 1 h following IP injection with glucose (3 g/kg) and insulin (2.25 IU/kg) shows a significant increase in both PER1 and PER2 abundance (n = 3, mean ± SEM, Welch’s t test), samples were normalized to histone H3 levels. Positive control (OX) in left-hand lane is extract from HEK cells transiently transfected with PER expression constructs. G,H Insulin addition to Bmal1−/− PER2::LUC fibroblasts elicits a modest but significant PER2::LUC induction (n ≥ 3, mean ± SEM, 2-way ANOVA, Tukey’s multiple comparisons test). WT traces repeated from Figure 4A. I,J Combined addition of phosphodiesterase inhibitor (IBMX) and adenylyl cyclase activator (forskolin) to Bmal1−/− PER2::LUC fibroblasts increases basal PER2::LUC transcription (first arrow), allowing the effect of acute insulin treatment (second arrow) to be readily observed (n = 4, mean ± SEM, 2-way ANOVA, Sidak’s multiple comparisons test).
Figure 4
Figure 4
Acute Induction of PER by Insulin Is Initially Post-transcriptional (A and B) Insulin induces PER2 in Cry1−/−Cry2−/− PER2::LUC fibroblasts (A), with quantification of induction (B) (n ≥ 3, t test). (C) qPCR on subcellular fractions of PER2::LUC fibroblasts post-insulin show no significant increase in Per2 mRNA at 30 mins and no increase in the cytoplasmic fraction at 60 min (n = 5, multiple t tests). (D) Increased PER2::LUC in fibroblasts within 1 h of insulin treatment (n = 4, TWA, Sidak MCT). (E and F) Inhibition of transcription (aao) attenuates PER2::LUC induction, whereas translational inhibition (chx) abolishes PER2::LUC induction by insulin (E), with quantification of induction (F) (n ≥ 3, TWA, Tukey’s MCT). (G) Polyribosome fractionation analyzed by qPCR shows altered distribution of Per2 mRNA 60 min after insulin addition (n = 3, TWA, MCT). See also Figure S5F. Mean ± SEM shown throughout. See also Figure S4.
Figure S5
Figure S5
Initial Induction of PER Occurs through Increased Translation of Existing mRNA, Related to Figure 4 (A) Inhibition of PER2 degradation with proteasomal inhibitor MG132 (n = 4, mean ± SEM) does not replicate the acute induction of PER2::LUC following insulin treatment (n = 4, mean ± SEM). (B) Pre-treatment with insulin does not influence PER2 degradation rate following cycloheximide, with both decay curves sharing the same half-life (n = 4, mean ± SEM, extra-sum-of-squares F test, p = 0.99), indicating that insulin does not increase PER2 levels by decreasing its rate of degradation. C, D Casein kinase 1 inhibitor PF-670462 also fails to replicate the PER2 induction following insulin (n = 4, mean ± SEM, 2-way ANOVA, Tukey’s multiple comparisons test). Consistent with insulin triggering an increase in PER2 synthesis however, we note that PF-670462 further potentiates the PER2::LUC induction following insulin treatment. (E) Inhibition of cap-dependent translation with 4EGI-1 abolishes the PER2 induction by insulin (n = 4, mean ± SEM). (F) Representative polysome profiles of absorbance at 254 nm at 60 min following treatment with vehicle or insulin (n = 3, representative). 40S, 60S and 80S peaks, and polysomes, are indicated. (G) Co-immunoprecipitation of S6K and BMAL1 at 10 and 30 min following insulin treatment shows a decrease in association of these proteins in response to insulin treatment, suggesting that BMAL1 association with translational machinery does not contribute to the acute increase in PER2 translation that follows insulin treatment. (H) Quantification of the magnitude of the PER2::LUC induction against shift in phase shows the largest induction when insulin is applied at the time when Per2 mRNA is most abundant (at 4 h before and around peak PER2::LUC), with significantly smaller inductions at the trough of PER expression, when Per2 mRNA is less abundant (n = 4, mean ± SEM, 1-way ANOVA, Dunnett’s multiple comparisons test, p-value versus the first group is shown). (I) An increase in whole-cell Per2 mRNA levels is observed at 90 and 180 min following insulin addition (n = 4, mean ± SEM, Welch’s t test). Taken together, these data suggest that, although increased PER2 transcription may contribute to some of the insulin-induced increase in PER2, increased PER translation from existing mRNA is primarily responsible for the acute increase in PER levels following insulin treatment, while the stability of PER is unaffected. All experiments were performed in PER2::LUC fibroblasts.
Figure S6
Figure S6
Selective PER Induction Requires Coincident Intracellular Signals, Related to Figure 5 (A) Kinase inhibition profile for BMS-754807 across a panel of protein kinases at 1 μM test concentration. Results are expressed as average percentage inhibition. Red bars indicate greater than 75% inhibition, orange greater than 50% and yellow greater than 25%. (B) Addition of insulin (600 nM) in the absence of extracellular glucose elicits a clear induction of PER2::LUC, which is potentiated by the presence of glucose extracellularly (n = 4, mean ± SEM). See Figure 5D for quantification. (C,D) Inhibition of PI3K (ZSTK474) abolishes both the acute induction of PER2 following insulin and (E) the subsequent shift in circadian phase (n = 4, mean ± SEM, 2-way ANOVA, Tukey’s multiple comparisons test). Please note that the effect of LY294002 on phase cannot be analyzed, since it abolishes PER2::LUC expression within 24 h of application. (F,G) Inhibition of mTOR with torin1 significantly attenuates the phase shift evoked by insulin (n = 4, mean ± SEM, 2-way ANOVA, Tukey’s multiple comparisons test). (H) mTOR activator MHY1485 does not induce PER2 expression comparably to insulin (n = 4, mean ± SEM), and nor does (I) simultaneous application of MHY1485 and PTEN inhibitor VO-OHpic (n = 4, mean ± SEM). (J) qPCR analysis shows levels of miR24-3p, miRNA29a-1 and miR30a-5p are all significantly reduced in PER2::LUC fibroblasts after 60 min of insulin treatment (n = 4, mean ± SEM, Welch’s t test). (K) Simultaneous inhibition of miRs 24-3p, 29a-1 and 30a-5p, pharmacological inhibition of PTEN and activation of mTOR in PER2::LUC fibroblasts recapitulates the PER2 induction by insulin, an effect not seen with any of these treatments alone or in dual combination (n = 4, representative). Extended from Figure 5I. (L,M) miRNA inhibition combined with PTEN inhibition and mTOR activation recapitulates the PER2 induction by insulin in PER2::LUC cardiomyocytes (n ≥ 4, mean ± SEM, 2-way ANOVA, Tukey’s multiple comparisons test). (N) In fibroblasts, silencing of only miR 24-3p and mIR 30a-5p, but not mIR 29a-1, combined with inhibition of PTEN and activation of mTOR does not induce PER2::LUC comparably with insulin (n = 4, mean ± SEM, 1-way ANOVA, Tukey’s multiple comparisons test).
Figure 5
Figure 5
Coincidence Detection Facilitates Selective PER Induction by Insulin (A–C) IR and IGF-1R antagonist (A) BMS-754807 abolishes PER2::LUC induction (B) and phase shift (C) by insulin in fibroblasts (n = 4, TWA, Tukey’s MCT). (D) Extracellular glucose potentiates, but is not required for, PER2::LUC induction by insulin (n = 4, TWA, Tukey’s MCT). See also Figure S6B. (E and F) Application of MAPK pathway inhibitor U0126 does not affect PER2 induction by insulin, while inhibition of PI3K (LY294002) abolishes it (E), with quantification of induction (F) (n ≥ 3, TWA, Tukey’s MCT). (G and H) Inhibition of mTOR (torin 1) attenuates PER2 induction by insulin (G), with quantification of induction (H) (n = 4, TWA, Tukey’s MCT). (I and J) Simultaneous inhibition of miR24-3p, miR29a-1, and miR30a-5p with PTEN inhibition and mTOR activation recapitulates PER2::LUC induction by insulin in fibroblasts (I) (n = 4, representative, see also Figure S6K), with quantification (J) (OWA, Tukey’s MCT). Mean ± SEM for all panels except (I). See also Figure S5.
Figure 6
Figure 6
Conflicting Temporal Cues Impair Circadian Fidelity In Vitro and In Vivo (A) Proposed mechanism by which insulin induces PER expression. (B) Temporal relationship between glucocorticoid (corticosterone) and insulin profiles in vivo compared to in vitro assays. (C–E) Insulin added 6 h before (orange), 6 h after (black), or at the same time as (purple) corticosterone (C) significantly affects (D) PER2 induction and (E) subsequent PER2::LUC amplitude (red: insulin alone, blue: cort alone). Grey boxes and inset in (C) show peak used for quantification (n ≥ 3, OWA, Tukey’s MCT, see also Figure S7). (F) Bioluminescence from PER2::LUC mice i.p. injected with insulin:glucose (1.0 IU/kg:1.3 g/kg or 2.25 IU/kg:3 g/kg) during the inactive phase (n ≥ 3). (G and H) Both doses increased PER2::LUC (G) (OWA, Dunnett’s MCT) and higher doses significantly decreased the amplitude of next circadian cycle (H). (OWA, Tukey’s MCT). (I) Both doses reduced the robustness of PER2::LUC rhythms after injection, assessed by cosinor goodness of fit, 36 h prior to and following treatment (R2 for replicates shown, TWA, Sidak MCT). Mean ± SEM shown.
Figure S7
Figure S7
Conflicting Entrainment Cues Impare Circadian Rhythmicity, Related to Figures 6 and 7 (A) Full PER2::LUC traces from Figure 6C (n = 4, mean ± SEM). (B) Quantified PER2::LUC induction of all conditions from Figure 6C (n = 4, mean ± SEM, one-way ANOVA, Tukey’s multiple comparisons test). (C) Quantified change in amplitude of all conditions from Figure 6C (n = 4, mean ± SEM, one-way ANOVA, Tukey’s multiple comparisons test). (D) Locomotor activity of mice in constant darkness receiving combined insulin (2.25 IU/kg) and glucose (3 g/kg) or vehicle by i.p. injection. i.p. was given at the beginning of the inactive phase (n = 5, representative, red arrow indicates time of injection). Activity was measured using a beam break detection floor grid. (E) Mean average behavior of both groups before and after insulin addition (mean ± SEM). Arrow indicates time of i.p injection. (F) Expanded view showing the onset of behavior in both groups highlights that mice receiving insulin/glucose at a biologically inappropriate time exhibit both a delay and a reduction in the amplitude of the onset of activity, at both one and two days following i.p. (2-way ANOVA, p-value of interaction is reported). (G) Mice continuously fed with either IR/IGF-1R antagonist BMS-754807 or a vehicle in the drinking water (n = 6) under both LD and DD conditions. Representative actograms show wheel-running activity double-plotted along x axis. (H) No significant difference in body weight was observed between the vehicle or BMS-754807 groups (n = 6, mean ± SEM, 2-way ANOVA, Sidak’s multiple comparisons test). (I) BMS-754807 had no significant effect on circadian period of rest-activity cycles when fed ad lib in constant conditions (n = 6, mean ± SEM, Welch’s t test).
Figure 7
Figure 7
IR and IGF-1R Inhibition Attenuates Entrainment of Circadian Rhythms to Feeding Time In Vivo (A) Representative PER2::LUC bioluminescence for restricted fed (RF) mice, with 12 h delay in feeding time from day 5 (red arrow). BMS-754807 or vehicle provided in drinking water throughout. (B) Shift in PER2::LUC acrophase following change in feeding schedule was significantly delayed for BMS-treated group, reported relative to acrophase on days 2–4 (n = 4, TWA, Tukey’s MCT). (C) Mean wheel-running activity for mice entrained to 12 h:12 h LD cycles, then released to constant light (LL). Restricted feeding (RF) groups (n = 6) were fed 8 h/day for 9 days before return to ad lib feeding, with one RF group receiving BMS-754807 in drinking water from day 7. Control group freely fed throughout (left: n = 6). (D) IR and IGF-1R inhibition attenuates temporal reorganization of daily rest-activity cycles after, not during, restricted feeding under LL (n = 6, TWA, Sidak MCT). Acrophase calculated relative to acrophase on final day of LD (black arrow). (E) Mean acrophase before, during, and after RF (days 5, 15, and 21). Arrow lengths are inversely proportional to SEM. See also Figure S7.

Comment in

  • Trained by feeding.
    Starling S. Starling S. Nat Rev Endocrinol. 2019 Jul;15(7):378. doi: 10.1038/s41574-019-0215-5. Nat Rev Endocrinol. 2019. PMID: 31086317 No abstract available.

References

    1. Abe H., Kida M., Tsuji K., Mano T. Feeding cycles entrain circadian rhythms of locomotor activity in CS mice but not in C57BL/6J mice. Physiol. Behav. 1989;45:397–401. - PubMed
    1. Anhê G.F., Caperuto L.C., Pereira-Da-Silva M., Souza L.C., Hirata A.E., Velloso L.A., Cipolla-Neto J., Carvalho C.R.O. In vivo activation of insulin receptor tyrosine kinase by melatonin in the rat hypothalamus. J. Neurochem. 2004;90:559–566. - PubMed
    1. Archer S.N., Laing E.E., Möller-Levet C.S., van der Veen D.R., Bucca G., Lazar A.S., Santhi N., Slak A., Kabiljo R., von Schantz M. Mistimed sleep disrupts circadian regulation of the human transcriptome. Proc. Natl. Acad. Sci. USA. 2014;111:E682–E691. - PMC - PubMed
    1. Aryal R.P., Kwak P.B., Tamayo A.G., Gebert M., Chiu P.L., Walz T., Weitz C.J. Macromolecular Assemblies of the Mammalian Circadian Clock. Mol. Cell. 2017;67:770–782.e6. - PMC - PubMed
    1. Bae K., Weaver D.R. Transient, light-induced rhythmicity in mPer-deficient mice. J. Biol. Rhythms. 2007;22:85–88. - PubMed

Publication types