. 2019 May 16;177(5):1109-1123.e14.
doi: 10.1016/j.cell.2019.03.040. Epub 2019 Apr 25.

Marine DNA Viral Macro- and Microdiversity from Pole to Pole

Collaborators, Affiliations

Marine DNA Viral Macro- and Microdiversity from Pole to Pole

Ann C Gregory et al. Cell. .

Abstract

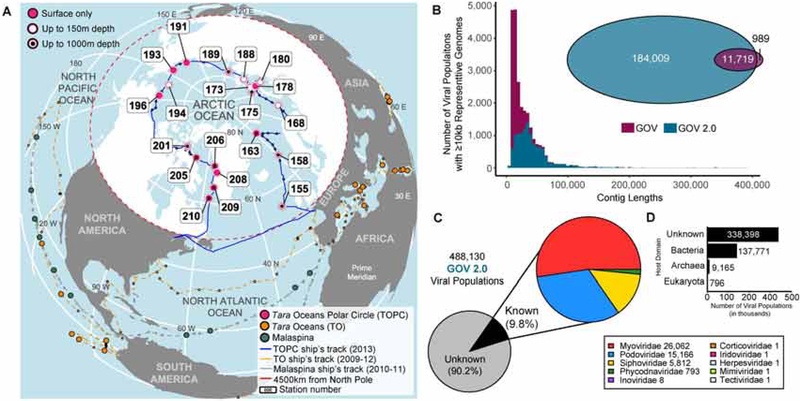
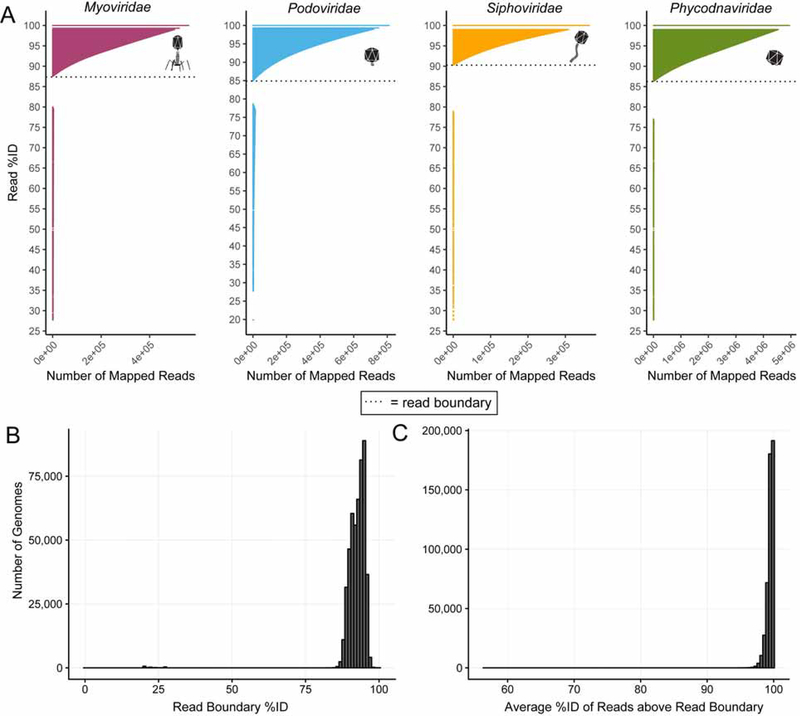
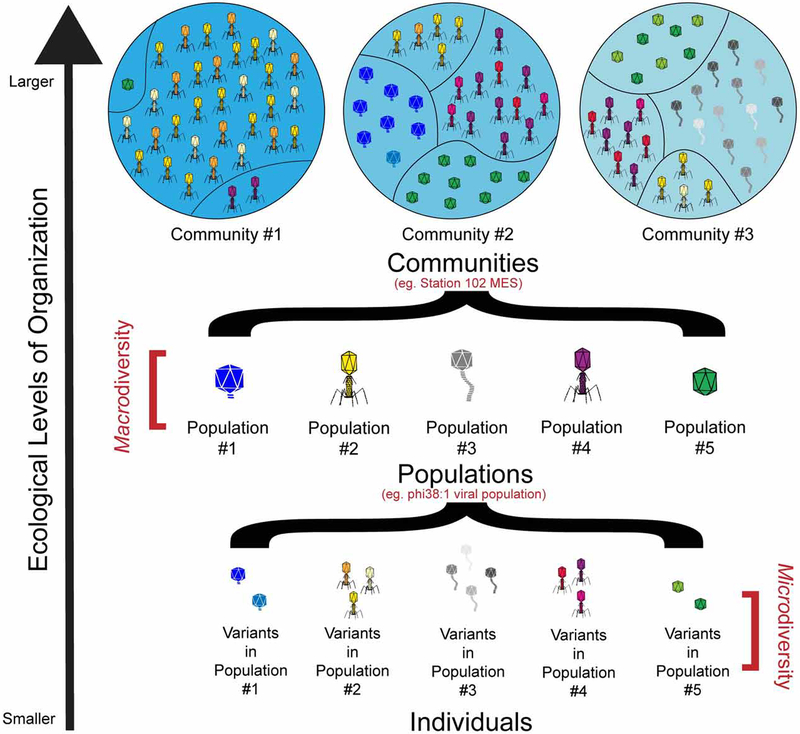
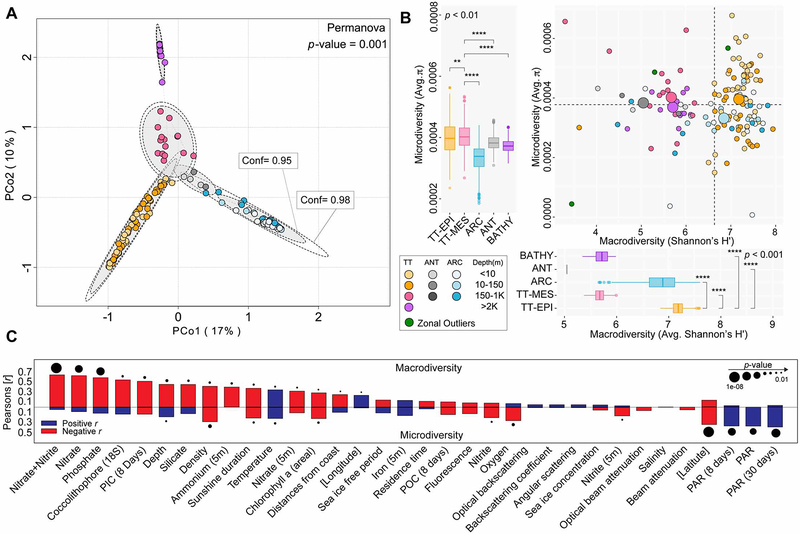
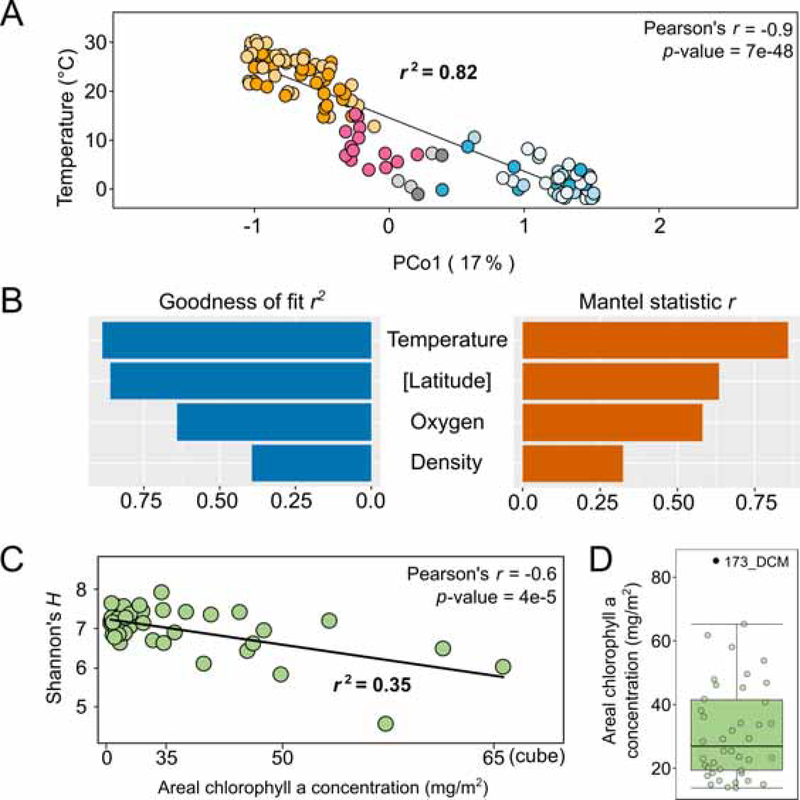
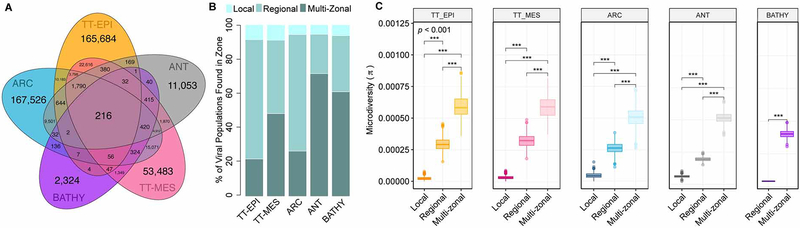
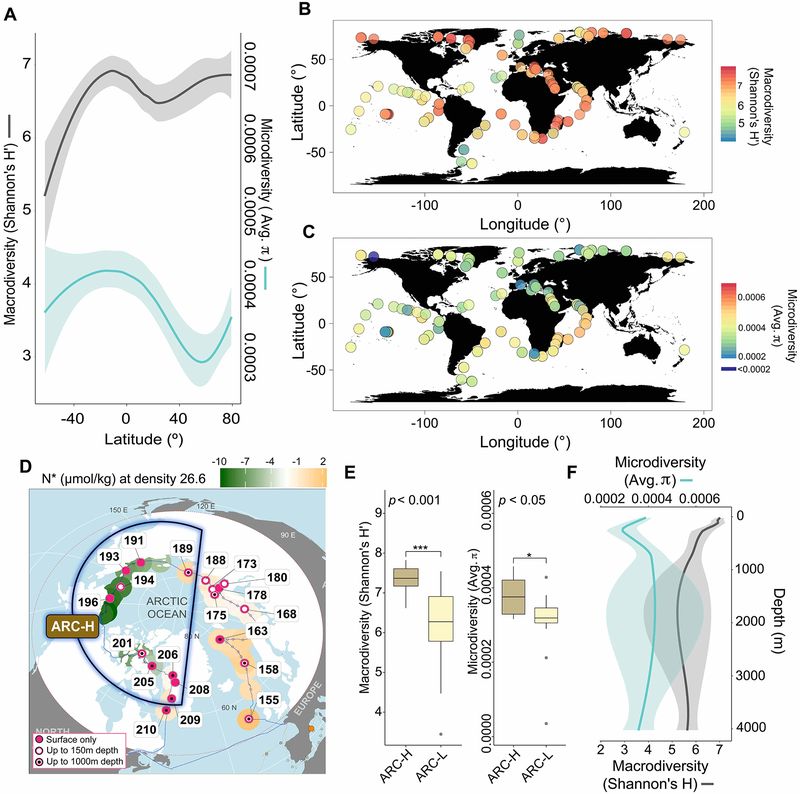
Microbes drive most ecosystems and are modulated by viruses that impact their lifespan, gene flow, and metabolic outputs. However, ecosystem-level impacts of viral community diversity remain difficult to assess due to classification issues and few reference genomes. Here, we establish an ∼12-fold expanded global ocean DNA virome dataset of 195,728 viral populations, now including the Arctic Ocean, and validate that these populations form discrete genotypic clusters. Meta-community analyses revealed five ecological zones throughout the global ocean, including two distinct Arctic regions. Across the zones, local and global patterns and drivers in viral community diversity were established for both macrodiversity (inter-population diversity) and microdiversity (intra-population genetic variation). These patterns sometimes, but not always, paralleled those from macro-organisms and revealed temperate and tropical surface waters and the Arctic as biodiversity hotspots and mechanistic hypotheses to explain them. Such further understanding of ocean viruses is critical for broader inclusion in ecosystem models.

Keywords: community ecology; diversity gradients; marine biology; metagenomics; population ecology; species; viruses.


Conflict of interest statement

Declaration of Interests: The authors declare no competing interests.

Figures

Fig. 1.
Fig. 1.. The Global Ocean Viromes 2.0.
(A) Arctic projection of the global ocean highlighting the new sampling stations of viromes in the GOV 2.0 dataset. Datasets from non-arctic samples were previously published in (Brum et al., 2015; Roux et al., 2016). (B) Histograms of the average assembled contig lengths for viral populations >10 kb shared between GOV and GOV 2.0. B-inset. More than 92% of the unbinned GOV viral populations were reassembled and identified in GOV 2.0 >10 kb populations. (C) Pie charts showing how many of the 488,130 total viral populations comprising GOV 2.0 can be annotated and, of those, their viral family level taxonomy. (D) Barplot showing the host affiliations for each viral population at the domain level.
Fig. 2.
Fig. 2.. GOV 2.0 viral population have discrete population boundaries.
(A) Barplots showing the read mapping results for the most abundant viral population >10kb in length for each of the top four viral families. Despite differences in read boundaries across the representative viral populations, there is no difference in the average read boundaries across the different viral families. (B) Histogram showing the read distribution frequency break (i.e. read boundary) between spuriously mapped reads and legitimate reads mapping to the genome. (C) Histograms showing the average percent identity of reads mapped to each genome after removing spuriously mapped reads.
Fig. 3.
Fig. 3.. Ecological levels of organization.
Schematic showing the different ecological levels of organization studied in this paper.
Fig. 4.
Fig. 4.. Viral communities partition into five ecological zones with different macro- and micro- diversity levels.
(A) Principal coordinate analysis (PCoA) of a Bray-Curtis dissimilarity matrix calculated from GOV 2.0. Analyses show that viromes significantly (Permanova p = 0.001) structure into five distinct global ecological zones: ARC, ANT, BATHY, TT-EPI, and TT-MES zones. Ellipses in the PCoA plot are drawn around the centroids of each group at 95% (inner) and 97.5% (outer) confidence intervals. Four outlier viromes that did not cluster with their ecological zones were removed (Fig. S3A) and all the sequencing reads were used (see Fig. S3B and Methods). (B – right) Scatterplots showing correlations between macro- (Shannon’s H’) and micro- (average π for viral populations with ≥ 10x median read depth coverage; see Methods) diversity values for each sample across GOV 2.0. The larger circles represent the average per zone. (B – left) Boxplots showing median and quartiles of average microdiversity per ecological zone. (B – bottom) Boxplots showing median and quartiles of macrodiversity for each ecological zone. Zonal samples were randomly downsampled to n = 5 to account for zone sampling difference. All pairwise comparisons shown were statistically significant (p<0.01) using two-tailed Mann-Whitney U-tests. (C) Positive (blue) and negative (red) Pearson’s correlation results comparing macro- (upper) and micro- (lower) diversity with different biogeographical and biogeochemical parameters at the global scale (see Fig. S3E, Table S3 for all abbreviations, and Methods). The significance of the correlations is indicated by the size of the black circles on top of the bars, and the variables on the x-axis are ordered from the strongest to the weakest correlation with macrodiversity (except for the top four variables correlating with microdiversity for readability).
Fig. 5.
Fig. 5.. Ecological drivers of global viral macrodiversity.
(A) Regression analysis between the first coordinate of a PCoA (Fig. 4A) and temperature showed that samples were separated by their local temperatures with an r2 of 0.82. (B) Potential ecological drivers & predictors of beta-diversity across GOV 2.0 for the first two dimensions (Goodness of fit r2 using a generalized additive model) and across all dimensions (Mantel test based on Spearman’s correlation). Temperature was uniformly reported as the best predictor of viral beta-diversity globally. (C) Regression analysis between viral macrodiversity at the deep chlorophyll maximum (DCM) layer and areal chlorophyll a concentration (after cube transformation) showed that the negative correlation between viral macrodiversity and nutrients (Fig. 4C) is mediated (at least partially) by primary productivity. The Shannon’s H outlier 32_DCM (Fig. S3) and a chlorophyll a concentration outlier (173_DCM; Fig. 5D) have been excluded from the regression analysis. (D) Boxplot analysis of areal chlorophyll a concentrations showing a single outlier concentration that fell above the fourth quantile of the data points (function geom_boxplot of ggplot).
Fig. 6.
Fig. 6.. Size of geographic range positively correlates with microdiversity.
(A) Venn diagram showing the number of viral populations found only in one zone (zone-specific) and those that are shared between and among the five ecological zones (multi-zonal). (B) Stacked barplots showing the number of multi-zonal, regional, and local viral populations found within the species pool of each ecological zone. (C) Boxplots showing median and quartiles of microdiversity (average π for viral populations with ≥ 10x median read depth coverage) per populations found within each zone defined as multi-zonal, regional, or local. Statistics were the same as in Fig. 2.
Fig. 7.
Fig. 7.. Viral macro- and micro- diversity global biodiversity trends.
(A) Loess smooth plots showing the latitudinal distributions of macro- and micro-diversity. (B & C) Equirectangular projections of the globe showing macro- and micro-diversity levels within each sample, respectively, across the global ocean. Samples collected at different depths from the same latitude and longitude are overlaid and the colors representing their macro- and micro- diversity values are merged. (D) Arctic projection of the global ocean showing the geographical division between ARC-H and ARC-L stations. The patterns are largely concordant with the Arctic division by climatology-derived N*. While we did sample across different seasons, the calculated N* values are not dependent on the season (see impact of the coast, depth, and seasons in Methods). (E) Boxplots showing median and quartiles of macro- (left) and micro-(right) diversity of the ARC-H and ARC-L regions. Statistics were the same as in Fig. 2. (F) Loess smooth plots showing the depth distributions of macro- and micro- population diversity. On all the smooth plots, the line represents the Loess best fit, while the lighter band corresponds to the 95% confidence window of the fit. Abbreviations: N*, the departure from dissolved N:P stoichiometry in the Redfield ratio and a geochemical tracer of Pacific and Atlantic water mass (see Methods).

Comment in

  • Drowning in Viruses.
    Handley SA, Virgin HW. Handley SA, et al. Cell. 2019 May 16;177(5):1084-1085. doi: 10.1016/j.cell.2019.04.045. Cell. 2019. PMID: 31100262

Similar articles

Cited by

References

    1. 1000 Genomes Project Consortium (2012). An integrated map of genetic variation from 1,092 human genomes. Nature. 491, 56–65. - PMC - PubMed
    1. Achtman M, and Wagner M (2008). Microbial diversity and the genetic nature of microbial species. Nat. Rev. Microbiol 6, 431–440. - PubMed
    1. Alberti A, Poulain J, Engelen S, Labadie K, Romac S, Ferrera I, Albini G, Aury JM, Belser C, Bertrand A, et al. (2017). Viral to metazoan marine plankton nucleotide sequences from the Tara Oceans expedition. Sci. Data 4, 170093. - PMC - PubMed
    1. Angly FE, Felts B, Breitbart M, Salamon P, Edwards RA, Carlson C, Chan AM, Haynes M, Kelley S, Liu H, et al. (2006). The marine viromes of four oceanic regions. PLOS Biol. 411, e368. - PMC - PubMed
    1. Bar-On YM, Phillips R, and Milo R (2018). The biomass distribution on Earth. Proc. Natl. Acad. Sci. USA 115, 6506–6511. - PMC - PubMed

Publication types

LinkOut - more resources