. 2019 May 2;177(4):1035-1049.e19.
doi: 10.1016/j.cell.2019.03.030. Epub 2019 Apr 25.

Proteogenomic Analysis of Human Colon Cancer Reveals New Therapeutic Opportunities

Collaborators, Affiliations

Proteogenomic Analysis of Human Colon Cancer Reveals New Therapeutic Opportunities

Suhas Vasaikar et al. Cell. .

Abstract

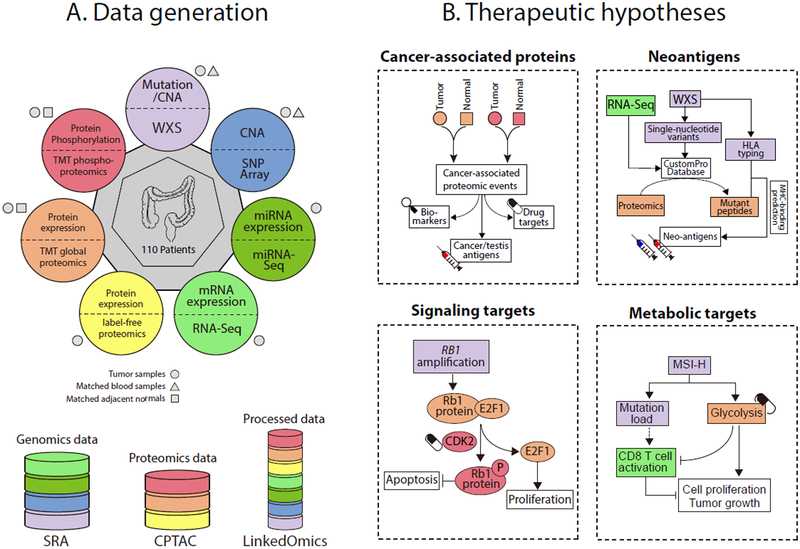
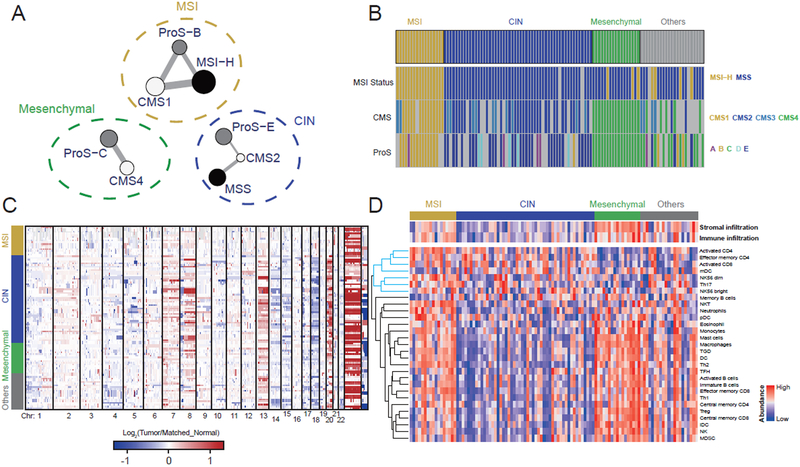
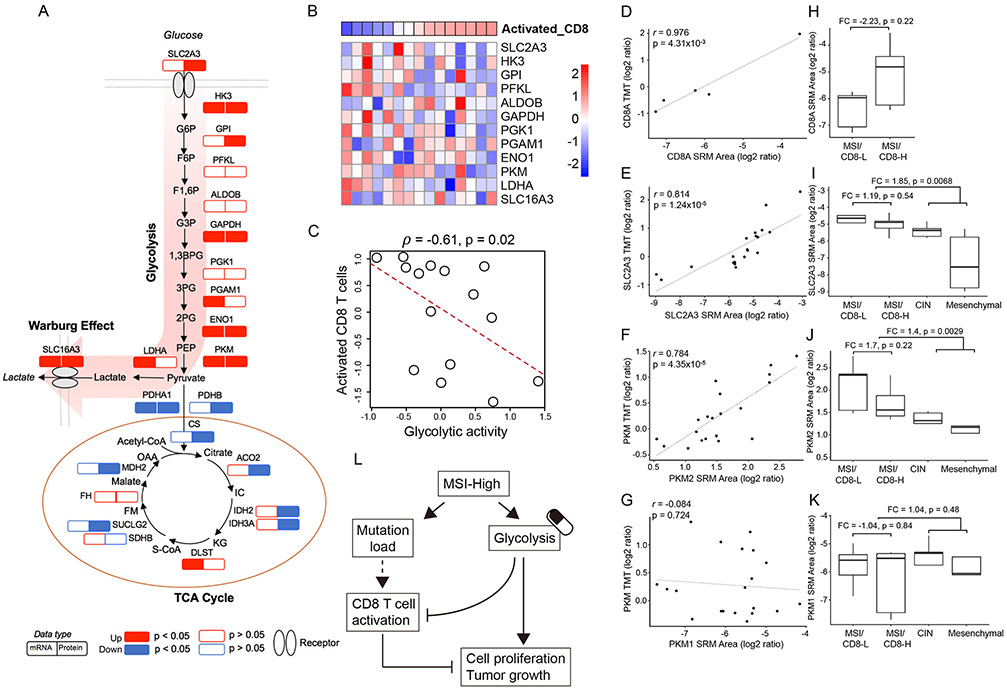
We performed the first proteogenomic study on a prospectively collected colon cancer cohort. Comparative proteomic and phosphoproteomic analysis of paired tumor and normal adjacent tissues produced a catalog of colon cancer-associated proteins and phosphosites, including known and putative new biomarkers, drug targets, and cancer/testis antigens. Proteogenomic integration not only prioritized genomically inferred targets, such as copy-number drivers and mutation-derived neoantigens, but also yielded novel findings. Phosphoproteomics data associated Rb phosphorylation with increased proliferation and decreased apoptosis in colon cancer, which explains why this classical tumor suppressor is amplified in colon tumors and suggests a rationale for targeting Rb phosphorylation in colon cancer. Proteomics identified an association between decreased CD8 T cell infiltration and increased glycolysis in microsatellite instability-high (MSI-H) tumors, suggesting glycolysis as a potential target to overcome the resistance of MSI-H tumors to immune checkpoint blockade. Proteogenomics presents new avenues for biological discoveries and therapeutic development.

Keywords: RB1; SOX9; biomarkers; colon cancer; drug targets; glycolysis; immune evasion; proteogenomics; proteomics; tumor antigen.


Conflict of interest statement

Declaration of Interests

The authors declare no competing interests.

Figures

Figure 1.
Figure 1.. Schematic overview of the study.
(A) Samples and omics platforms for data generation. (B) Therapeutic hypothesis generation through proteogenomic integration. The colors in B represent data generated from different omics platforms as indicated by the same colors in A.
Figure 2.
Figure 2.. Somatic mutations and their proteomic consequences.
(A-B) Significantly mutated genes in non-hypermutated (A) and hypermutated (B) samples. Mutation frequency is shown at the top for each gene. Genes not reported in the TCGA study are shown in bold font. (C-F) Somatic mutations vs protein/phosphosite abundance change for APC (C), TGFBR2 (D), TP53 (E), and SOX9 (F). For each gene, the top panel lollipop plot visualizes all protein altering somatic mutations detected in this cohort. The size of a lollipop represents the number of samples with corresponding mutation, and the color represents a specific type of mutation as indicated in the figure legend. The location of the post-translational modification (PTM) of interest is indicated by a triangle. The bottom panel co-visualizes the mutation and protein or phosphosite abundance data for individual samples. For mutation data, a colored box denotes the existence of a specific type of mutation as indicated in the figure legend. Grey boxes indicate data are not available. If a given sample has more than one type of mutation, only one type is shown in the following order of priority: stop-gain, frameshift-INDEL, non-frameshift INDEL, and non-synonymous SNV. In the waterfall plot, each bar represents the protein or phosphosite abundance change between tumor and matched normal adjacent tissue for a patient. Red and green bars represent over- and under-expression in tumor, respectively. White space in the waterfall plots indicates missing values.
Figure 3.
Figure 3.. Somatic copy number alteration (SCNA) analysis.
(A) Arm-level SCNA events. Red denotes amplification and blue denotes deletion. (B) Focal-level SCNA events. Focal peaks with significant copy number gains (red) and losses (blue) (GISTIC2 Q-values < 0.25) are shown. The top ten amplified and deleted cytobands are labeled, with the proportions of amplified or deleted samples shown in the parentheses. Representative genes encoded from these focal peaks are highlighted in approximate positions across the genome. (C) Effects of copy number alternations on mRNA and protein abundance. The upper heatmap panel shows the abundance of significant copy number correlation with mRNA (left) and protein (right). Significant positive and negative correlations (adj. p < 0.01, Spearman’s correlation coefficient) are indicated by red and blue, respectively. Genes are ordered by chromosome locations on both x- and y-axes. The bottom panel shows the frequency of significant correlations. Grey bars represent copy number correlation to mRNA (left) and protein (right), and black bars represent copy number correlation to both mRNA and protein. (D) Strategy for prioritizing genes in focal alteration peaks. (E) Most enriched KEGG pathways and Gene Ontology (GO) biological processes (BP) for genomic drivers inferred in this study. (F) Six deleted genes involved in endocytosis. Violin plots compare protein expression in tumor and normal adjacent tissue for each gene.
Figure 4.
Figure 4.. Rb phosphorylation as a driver and therapeutic target in colon cancer.
(A-C) RB1 Copy number alteration (CNA) (A), protein log2 fold change (FC) from normal (B), and phosphorylation log2 fold change from normal (C). Samples are ordered by increasing average phosphorylation abundance. (D-E) Correlations of Rb protein abundance change (D) and average Rb phosphorylation change (E) with estimated E2F1 activity change. (F-H) Correlation of average Rb phosphorylation change with estimated CDK2 activity change (F), H3.1 phosphorylation change (G), and protein level changes of apoptotic proteins (H). (I) A model depicting the multi-level regulation of RB1 in colon cancer, highlighting Rb phosphorylation as a driver and therapeutic target in colon cancer.
Figure 5.
Figure 5.. Colon cancer-associated proteomic events.
(A) Volcano plot indicating proteins over-expressed in tumors or normal adjacent tissues (NATs, light red and blue colors indicate adj. p < 0.01 (sig) whereas red and blue further require more than 2-fold change); other genes are colored in grey. (B) Gene Ontology Biological Processes enriched for the 417 proteins down-regulated in tumors. Venn diagram depicts the overlap between muscle system process related genes and the 417 proteins. (C) Log2-fold change between tumor and matched NATs is shown for the 31 cancer-associated proteins (mean in red). (D) Tumor-cell specific immunohistochemistry (IHC) staining scores defined by the Human Protein Atlas (HPA). (E) Overlap with plasma proteins, secreted proteins, transmembrane proteins, and enzymes annotated by HPA, as well as known clinical utilities. (F) Volcano plot indicating phosphosites over-expressed in tumors or NATs. Colors are the same as in A. (G) Correlation between tumor-normal protein and phosphorylation site abundance differences (Pearson’s r = 0.81, p < 2.2×10⁻¹⁶). The purple dashed line indicates the diagonal line. Red points indicate the phosphorylation sites with greater than 2-fold increase. The black arrows highlight 5 of these phosphorylation sites with lower protein abundance in tumors than in NATs. (H) Overlap of proteins containing cancer-associated phosphorylation sites (Phosphoproteome), cancer-associated proteins (Proteome), and cancer genes in the Cancer Gene Census (CGC). (I) Cancer-associated kinases identified by increased phosphorylation of a known kinase activating site in tumor compared to NAT (phosphorylation) or by phosphosite set enrichment analysis based on known kinase-target site relationships (inferred). Grey boxes indicate data are not available. Black boxes indicate the existence of an FDA-approved drug or a drug undergoing clinical trials targeting that kinase. (J) The number of proteomics-supported neoantigens identified for each sample, with MSI-H and MSS annotation shown at the top. (K) Three cancer/testis (CT) antigens over-expressed by at least 2-fold in tumors compared to NATs in more than 5% of all samples, with the percentage indicated in brackets. Sample order is the same as in J. Grey boxes indicate data are not available.
Figure 6.
Figure 6.. A unified, multi-omics view of colon cancer subtypes.
(A) The network representing the association between subtypes defined by genomic (black), transcriptomic (white), and proteomic (grey) classification systems. Edge width denotes the significance of the connections computed by the Fisher’s exact test. The dashed circles indicate the three unified multi-omics subtypes (UMSs). (B) UMS assignment for samples in the cohort. The genomic, transcriptomic, and proteomic subtypes are also shown for comparison. (C) Copy number alteration data grouped by the three UMSs. (D) Stroma and immune infiltration profiles grouped by the three UMSs. The cytotoxic immune cell cluster is highlighted by blue in the dendrogram.
Figure 7.
Figure 7.. Increased glycolysis in the MSI subtype and its association with CD8 T cell infiltration.
(A) MSI subtype-specific alteration of key enzymes involved in the glycolysis and TCA cycle. The MSI subtype-specific RNA and protein changes are shown side-by-side. P values were calculated based on the Wilcoxon rank sum test. (B) The heatmap showing the protein expression levels of glycolytic enzymes within the MSI subtype. Samples are ordered by increased infiltration of activated CD8 T cells. (C) The negative correlation between glycolytic activity (inferred by the protein expression of enzymes involved in the pathway) and the activated CD8 T cell level for the MSI subtype. (D-G) Strong positive correlations were observed between SRM and TMT measurements for CD8A(D), SLC2A3 (E), and PKM2 (F), but not for PKM1 (G). (H) SRM data showed higher CD8A abundance in MSI/CD8-H tumors (n=5) than MSI/CD8-L tumors (n=5). (I-K) SRM data showed higher protein abundance of SLC2A3 (I) and PKM2 (J) in MSI tumors (n=10) compared to CIN (n=5) and Mesenchymal (n=5) tumors, and in MSI/CD8-L tumors (n=5) compared to MSI/CD8-H tumors (n=5). This pattern was not observed for PKM1 (K). (L) Schematic diagram summarizing the interplay between glycolysis and CD8 T cell activation in MSI tumors, highlighting glycolysis as a potential target to overcome the resistance of MSI-H tumors to immune checkpoint blockade.

Comment in

  • Atlas Drugged.
    Chen JK, Yaffe MB. Chen JK, et al. Cell. 2019 May 2;177(4):803-805. doi: 10.1016/j.cell.2019.04.023. Cell. 2019. PMID: 31051104

References

    1. Akiyama H, Kamitani T, Yang X, Kandyil R, Bridgewater LC, Fellous M, Mori-Akiyama Y, and de Crombrugghe B (2005). The transcription factor Sox9 is degraded by the ubiquitin-proteasome system and stabilized by a mutation in a ubiquitin-target site. Matrix Biol 23, 499–505. - PubMed
    1. Almeida LG, Sakabe NJ, deOliveira AR, Silva MC, Mundstein AS, Cohen T, Chen YT, Chua R, Gurung S, Gnjatic S, et al. (2009). CTdatabase: a knowledge-base of high-throughput and curated data on cancer-testis antigens. Nucleic Acids Res 37, D816–819. - PMC - PubMed
    1. Anders S, Pyl PT, and Huber W (2015). HTSeq--a Python framework to work with high-throughput sequencing data. Bioinformatics 31, 166–169. - PMC - PubMed
    1. Angelova M, Charoentong P, Hackl H, Fischer ML, Snajder R, Krogsdam AM, Waldner MJ, Bindea G, Mlecnik B, Galon J, et al. (2015). Characterization of the immunophenotypes and antigenomes of colorectal cancers reveals distinct tumor escape mechanisms and novel targets for immunotherapy. Genome Biol 16, 64. - PMC - PubMed
    1. Arnold M, Sierra MS, Laversanne M, Soerjomataram I, Jemal A, and Bray F (2017). Global patterns and trends in colorectal cancer incidence and mortality. Gut 66, 683–691. - PubMed

Publication types