. 2019 May 16;177(5):1280-1292.e20.
doi: 10.1016/j.cell.2019.03.019. Epub 2019 Apr 25.

Hyperactivity with Disrupted Attention by Activation of an Astrocyte Synaptogenic Cue

Affiliations

Hyperactivity with Disrupted Attention by Activation of an Astrocyte Synaptogenic Cue

Jun Nagai et al. Cell. .

Abstract

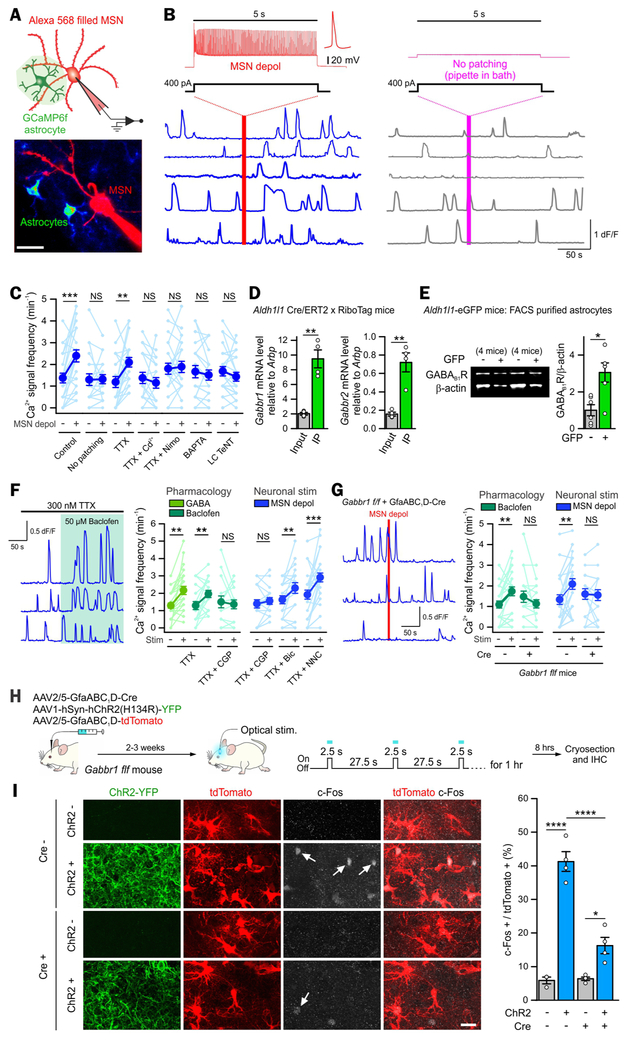
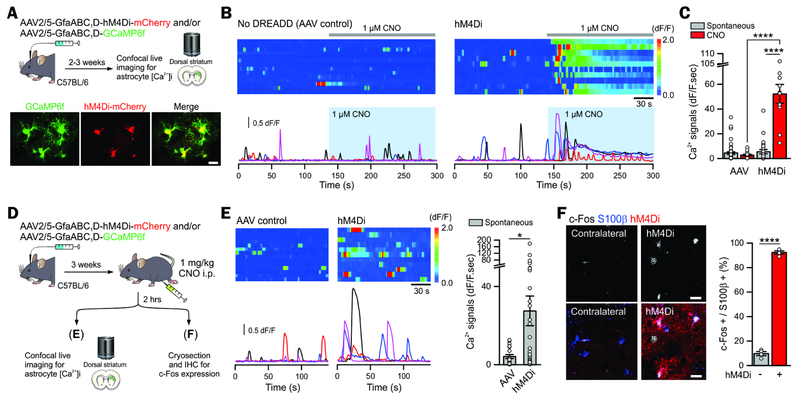
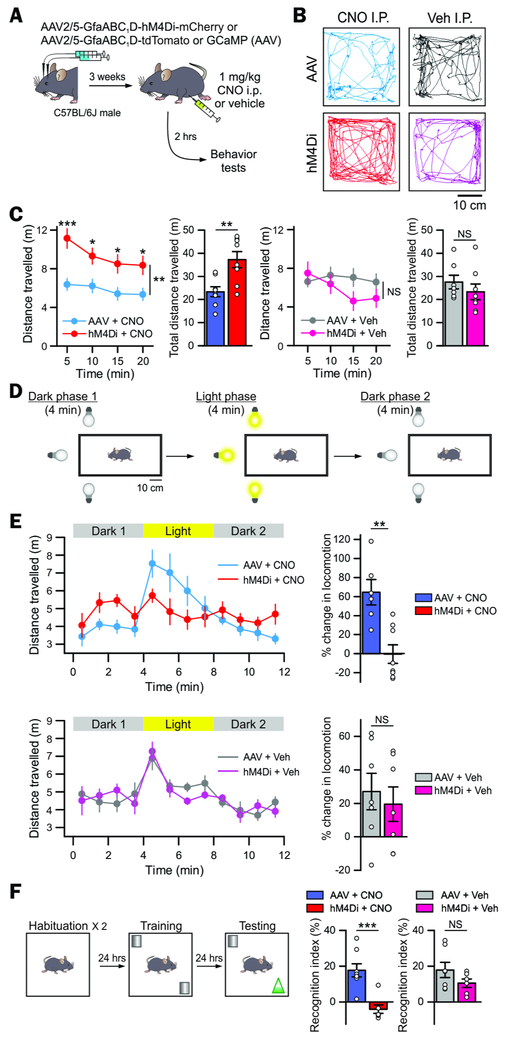
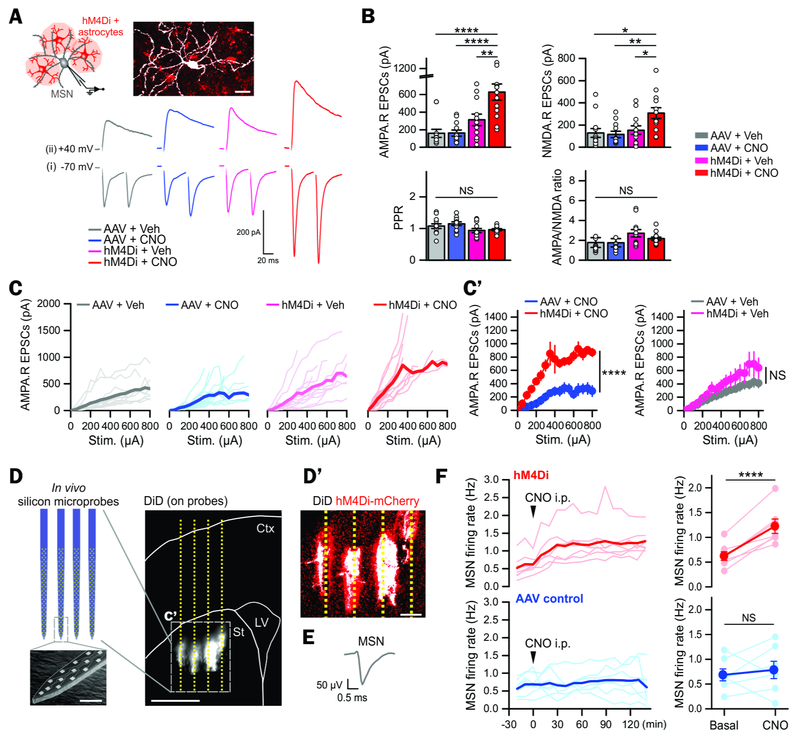
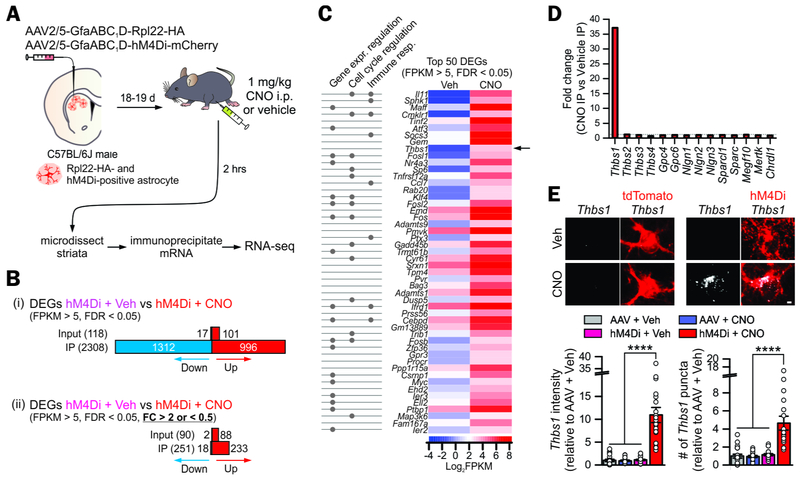
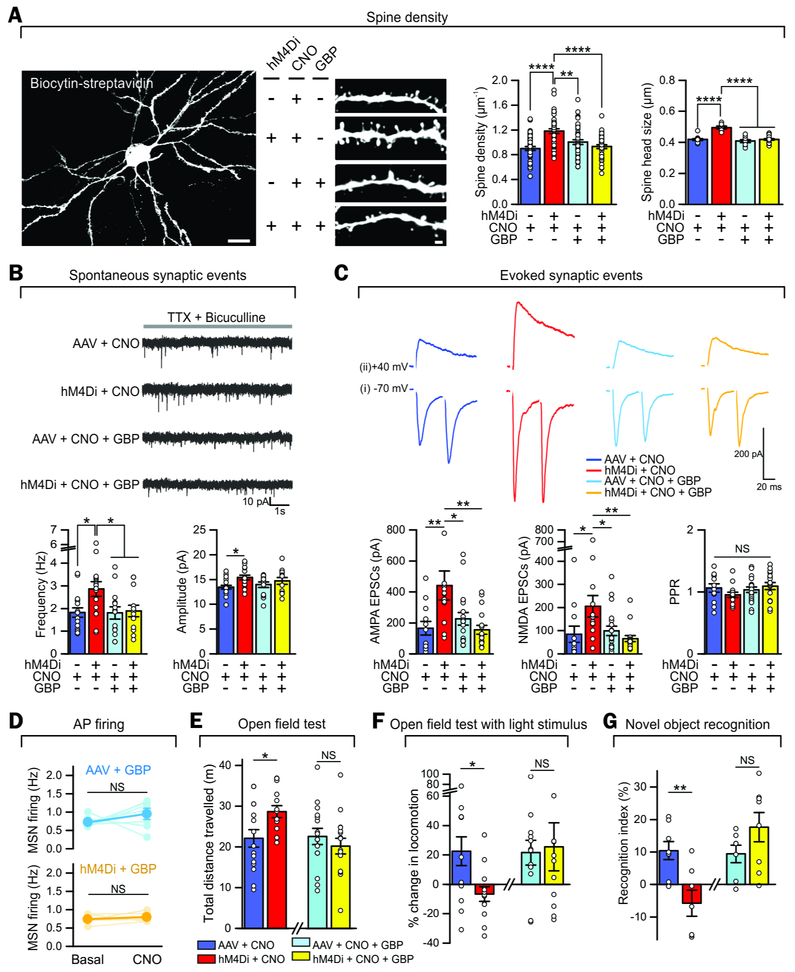
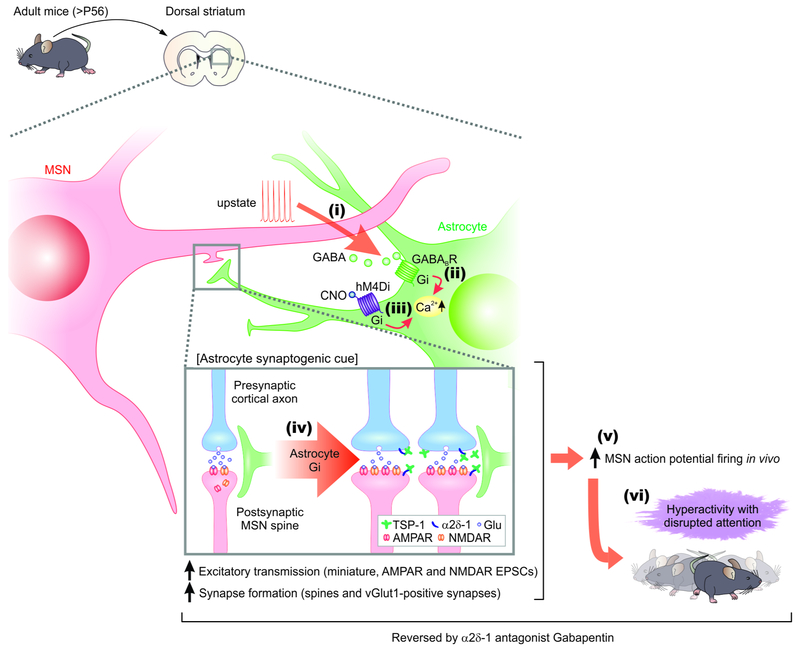
Hyperactivity and disturbances of attention are common behavioral disorders whose underlying cellular and neural circuit causes are not understood. We report the discovery that striatal astrocytes drive such phenotypes through a hitherto unknown synaptic mechanism. We found that striatal medium spiny neurons (MSNs) triggered astrocyte signaling via γ-aminobutyric acid B (GABAB) receptors. Selective chemogenetic activation of this pathway in striatal astrocytes in vivo resulted in acute behavioral hyperactivity and disrupted attention. Such responses also resulted in upregulation of the synaptogenic cue thrombospondin-1 (TSP1) in astrocytes, increased excitatory synapses, enhanced corticostriatal synaptic transmission, and increased MSN action potential firing in vivo. All of these changes were reversed by blocking TSP1 effects. Our data identify a form of bidirectional neuron-astrocyte communication and demonstrate that acute reactivation of a single latent astrocyte synaptogenic cue alters striatal circuits controlling behavior, revealing astrocytes and the TSP1 pathway as therapeutic targets in hyperactivity, attention deficit, and related psychiatric disorders.

Keywords: astrocyte; attention deficit; behavior; calcium; gabapentin; hyperactivity; microcircuit; striatum; thrombospondin.


Conflict of interest statement

Declaration of interests

The authors declare no commercial interests

Figures

Figure 1:
Figure 1:. MSN GABA release activated striatal astrocyte Ca2+ signaling in situ and in vivo.
(A) Whole-cell recording from MSNs (filled with Alexa 568) and imaging from nearby cytosolic GCaMP6f expressing astrocytes. (B) MSN depolarization to upstate like levels for 5 s (117 ± 11 APs evoked) increased the frequency of astrocyte Ca2+ signals (blue traces, 5 representative cells). This did not occur without patching (gray traces, 5 representative cells). (C) Graph of astrocyte Ca2+ signal frequency before and after MSN depolarization in control and various experimental configurations (n = 18-24 astrocytes from 4-6 mice per condition). (D-E) Striatal astrocyte specific qPCR (D, n = 4 mice) and Western blotting (E, n = 6 experiments from 20 mice) revealed GABAB receptor enrichment in astrocytes. (F) Left, Baclofen bath application increased the frequency of astrocyte Ca2+ signals (3 representative cells). The right summary graph shows astrocyte Ca2+ signal frequency before and after drug application or MSN depolarization in various experimental configurations (n = 15-30 astrocytes from 4-5 mice). (G) Left, astrocyte Ca2+ signals (3 representative cells) from the striatum in which Gabbr1 was deleted. The right summary graphs show astrocyte Ca2+ signal frequency before and after baclofen application or MSN depolarization in Gabbr1 f/f mice with or without Cre (n = 18-25 astrocytes from 4 mice). (H) Cartoon illustrating AAV microinjection into the dorsal striatum to delete Gabbr1 in astrocytes by delivering AAV2/5 GfaABC1D-Cre and the method used to activate neurons in vivo with optical stimulation following expression of ChR2(H134R). tdTomato was expressed in order to visualize astrocytes. (I) ChR2-based striatal neuron excitation in vivo resulted in c-Fos expression in astrocytes, which was attenuated by Gabbr1 deletion in astrocytes (n = 4 mice). Paired t-test or Wilcoxon signed ranks test between before (basal) and after stimulation (C, F, G). Paired t-test (D, E). Two-way ANOVA test followed by Tukey’s post-hoc test (I). Scale bars, 20 μm (A, I). Data are shown as mean ± s.e.m. Full details of n numbers, precise P values and statistical tests are reported in Supplementary Table 1. * indicates P < 0.05, ** indicates P < 0.01, *** indicates P < 0.001, **** indicates P < 0.0001, NS indicates not significantly different. See also Fig S1-3.
Figure 2:
Figure 2:. Astrocyte-specific Gi pathway activation by a Gi-DREADD hM4Di.
(A) Cartoon illustrating AAVs used for expressing GCaMP6f with and without mCherry-fused hM4Di in astrocytes in the dorsal striatum. The lower images show GCaMP6f and hM4Di-mCherry expressing astrocytes in striatal slices were colocalised (Chai et al., 2017). (B-C) Kymographs and ΔF/F traces of astrocyte Ca2+ responses evoked by bath application of 1 μM CNO in control AAV injected and hM4Di injected mice. The bar graph shows the CNO-evoked integrated area of astrocyte Ca2+ signals in the hM4Di group, and in the controls (n ≥ 11 cells from ≥ 3 mice). (D) Schematic illustrating 1 mg/kg CNO was administrated i.p. in vivo 2 hr prior to harvesting brains for imaging. (E) Kymographs and ΔF/F traces of astrocyte Ca2+ responses in control and hM4Di groups. The bar graphs summarize the integrated areas of the spontaneous Ca2+ signals in hM4Di and control mice that received CNO i.p. 2 hr prior (n ≥ 21 astrocytes from ≥ 3 mice). These data show that a single in vivo dose of CNO evoked a long lasting increase in astrocyte Ca2+ signaling. (F) hM4Di activation with in vivo CNO administration increased c-Fos expression in striatal S100β positive astrocytes (4 mice). Scale bars, 20 μm (A, F). Data are shown as mean ± s.e.m. Full details of n numbers, precise P values and statistical tests are reported in Supplementary Table 1. * indicates P < 0.05, **** indicates P < 0.0001. See also Fig S3.
Figure 3:
Figure 3:. Astrocyte-specific Gi pathway activation in vivo induced hyperactivity and disrupted attention.
(A) Cartoon illustrating the AAV2/5 reagents and approaches for selectively expressing hM4Di-mCherry or tdTomato (as a control AAV) bilaterally in striatal astrocytes. Once such mice were prepared, behavior was assessed 3 weeks later and 2 hrs after intraperitoneal administration of 1 mg/kg CNO or vehicle. (B) The representative open-field activity tracks show the 4 experimental groups used in behavioral analyses to control for potential off target effects of CNO and to control for AAV microinjections. (C) Distance travelled by the mice over 20 min in an open field chamber, divided into 5 min epochs and also pooled over 20 mins for the 4 experimental groups. (D) Cartoon of the modified open field test with a light stimulus. (E) Distance travelled in the modified open field chamber before, during and after light stimulation (in 1 min epochs). Notably, the hM4Di + CNO group showed no significant increase in ambulation in response to light stimulation, whereas all the other groups did so. (F) Behavioral layout of the novel object recognition task for the 4 experimental groups. No significant difference was found between hM4Di + Veh and AAV + Veh groups across all the behavioral tests, but there were clear differences between the AAV + CNO and the hM4Di + CNO groups (B-F). Data: mean ± s.e.m. Full details of n numbers, precise P values and statistical tests are reported in Supplementary Table 1. * indicates P < 0.05, ** indicates P < 0.01, *** indicates P < 0.001, NS indicates not significantly different. See also Fig S3-4.
Figure 4:
Figure 4:. Increased corticostriatal excitatory synaptic transmission and elevated MSN firing in vivo by acute astrocyte Gi pathway activation.
(A) Cartoon illustrating whole-cell patch-clamp recording from an MSN (filled with Biocytin) surrounded by hM4Di-expressing astrocytes. The lower traces show representative traces for evoked AMPA.R EPSCs due to paired stimuli at membrane potentials of −70 mV (i) and for NMDA.R EPSCs due to single stimuli at +40 mV (ii) from the indicated 4 experimental groups. (B) Summary of multiple experiments such as those illustrated with representative traces in panel A (n = 12-13 MSNs from 4 mice). Notably, the AMPA.R and the NMDA.R EPSC amplitude in the hM4Di + CNO group was greater compared to other control groups, but there was no significant change in PPR and AMPA/NMDA ratios. (C) The graphs plot the AMPA EPSC amplitudes with varying stimulation intensities delivered to the cortico-striatal pathway in brain slices from the indicated 4 experimental groups. Plots in light colors show individual data from each MSN and those in dark colors and thicker lines indicate averaged data (n = 12-13 MSNs from 4 mice). The subpanel C’ shows average plots from indicated 4 experimental groups. (D) Illustration and scanning electron microscope image of the silicon microprobes used to record neuronal activity in vivo. The probes were coated with DiD fluorescent dye, which was deposited at the implantation site, allowing reconstruction of their position post hoc. The subpanel D’ shows that the microprobes (indicated in white by the dye) were positioned near hM4Di-expressing astrocytes (indicated in red owing to mCherry). (E) Representative extracellularly recorded MSN AP. (F) The graphs plot the MSN firing rate before and following i.p. CNO administration to AAV control mice and to hM4Di mice. The scatter graphs on the right summarize such experiments. Notably, MSN firing rate was significantly increased 120 min after CNO i.p. administration in hM4Di mice, but not in control mice (n = 7 mice). Scale bars, 20 μm in panel (A), 1 mm in the large image of panel D, 10 μm in the small image of the microprobes in D, and 200 μm in panel D’. Data are shown as mean ± s.e.m. Full details of n numbers, precise P values and statistical tests are reported in Supplementary Table 1. * indicates P < 0.05, ** indicates P < 0.01, **** indicates P < 0.0001, NS indicates not significantly different. See also Fig S4.
Figure 5:
Figure 5:. Astrocyte transcriptomes following astrocyte Gi pathway activation revealed Thbs1 upregulation.
(A) Cartoon illustrating AAVs for selectively expressing Rpl22-HA and hM4Di-mCherry in astrocytes in the dorsal striatum via intracranial microinjections for RNA-seq 2 hrs after intraperitoneal administration of 1 mg/kg CNO or vehicle. (B) The number of differentially expressed genes (DEGs) in RNA-seq, with no fold-change cutoff and with a > 2-fold change cut off. (C) Heatmaps of FPKM for the top 50 DEGs. Log2(FPKM) ranged from −4 (blue, relatively low expression) to 8 (red, relatively high expression). The proposed functions of the gene based on gene ontology analyses are also shown. (D) Fold-change of genes implicated in astrocyte-dependent synapse formation and removal. (E) RNAscope based assessment of Thbs1 mRNA expression in the dorsal striatum of the four experimental groups (n = 20-21 astrocytes from 4 mice per group). Significant upregulation of Thbs1 mRNA was observed in the hM4Di + CNO group. Scale bars, 2 μm in panel (E). Data are shown as mean ± s.e.m. Full details of n numbers, precise P values and statistical tests are reported in Supplementary Table 1. **** indicates P < 0.0001. See also Fig S5.
Figure 6:
Figure 6:. Gabapentin (GBP) rescued astrocyte Gi pathway-induced morphological, electrophysiological, and behavioral phenotypes.
(A) Increase in spine density and spine head size of MSNs in hM4Di + CNO mice compared to AAV + CNO mice, which was rescued by GBP i.p. administration (n = 4 mice per group). (B-C) Increased mEPSC frequency and evoked EPSC amplitude in hM4Di + CNO mice was rescued by GBP i.p. administration (n = 15-18 MSNs from 5-6 mice per group for B and 12-19 MSNs from 4 mice per group for C). (D) CNO i.p. administration did not change MSN firing rate after in vivo administration of GBP (n = 7 mice for AAV + GBP, n = 5 mice for hM4Di + GBP). (E-G) Increased ambulation in an open field (E), blunted responses to bright light stimuli (F) and novel objects (G) observed in hM4Di + CNO mice relative to controls were rescued by GBP i.p. administration (n = 14-16 mice per group for E, 12-13 mice per group for F and 7-8 mice per group for G). Scale bars, 20 μm in the left image and 2 μm in the right image (A). Full details of n numbers, precise P values and statistical tests are reported in Supplementary Table 1. * indicates P <0.05, ** indicates P < 0.01, **** indicates P <0.0001, NS indicates not significantly different. See also Fig S6-7.
Figure 7:
Figure 7:. Summary and model for Gi GPCR-mediated MSN-astrocyte bidirectional interactions.
When MSNs were depolarized to levels associated with upstates, they released GABA (step i) which activated Gi-protein coupled GABAB GPCRs on striatal astrocytes, leading to increase in intracellular Ca2+ signals (step ii). Selectively stimulating the Gi-pathway with DREADDS and CNO evoked Ca2+ signals in striatal astrocytes (step iii), upregulated the astrocyte synaptogenic molecule TSP-1, boosted excitatory synapse formation, boosted fast excitatory synaptic transmission (step iv) and increased firing of MSNs (step v), which together resulted in hyperactivity with disrupted attention phenotypes in mice (step vi). The synaptic, circuit and behavioral effects resulting from Gi-pathway activation in vivo (steps iv-vi) were all reversed by blocking TSP-1 actions on neuronal α2δ–1 receptors with gabapentin.

Comment in

References

    1. Adamsky A, Kol A, Kreisel T, Doron A, Ozeri-Engelhard N, Melcer T, Refaeli R, Horn H, Regev L, Groysman M, et al. (2018). Astrocytic Activation Generates De Novo Neuronal Potentiation and Memory Enhancement. Cell 174, 59–71. - PubMed
    1. Alexander GM, Rogan SC, Abbas AI, Armbruster BN, Pei Y, Allen JA, Nonneman RJ, Hartmann J, Moy SS, Nicolelis MA, et al. (2009). Remote control of neuronal activity in transgenic mice expressing evolved G protein-coupled receptors. Neuron 63, 27–39. - PMC - PubMed
    1. Allen NJ, and Lyons DA (2018). Glia as architects of central nervous system formation and function. Science 362, 181–185. - PMC - PubMed
    1. Anders S, Pyl PT, and Huber W (2015). HTSeq—a Python framework to work with high-throughput sequencing data. Bioinformatics 31, 166–169. - PMC - PubMed
    1. Anderson MA, Burda JE, Ren Y, Ao Y, O’Shea TM, Kawaguchi R, Coppola G, Khakh BS, Deming TJ, and Sofroniew MV (2016). Astrocyte scar formation aids central nervous system axon regeneration. Nature 532, 195–200. - PMC - PubMed

Publication types

MeSH terms