. 2019 Jun 13;177(7):1903-1914.e14.
doi: 10.1016/j.cell.2019.04.004. Epub 2019 Apr 25.

Visualizing Engrafted Human Cancer and Therapy Responses in Immunodeficient Zebrafish

Affiliations

Visualizing Engrafted Human Cancer and Therapy Responses in Immunodeficient Zebrafish

Chuan Yan et al. Cell. .

Abstract

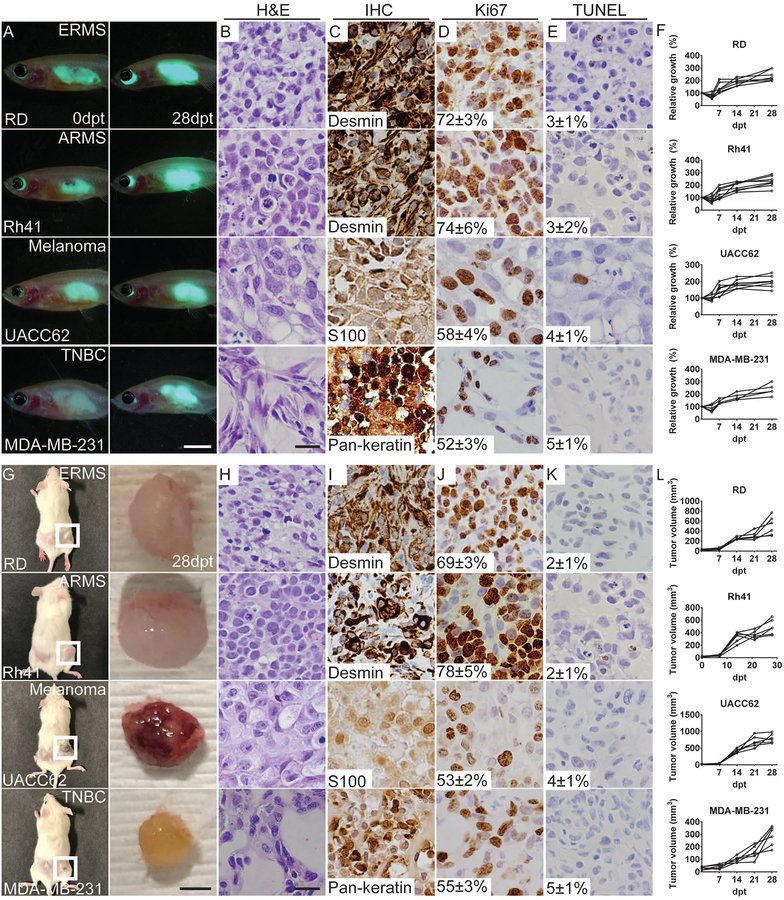
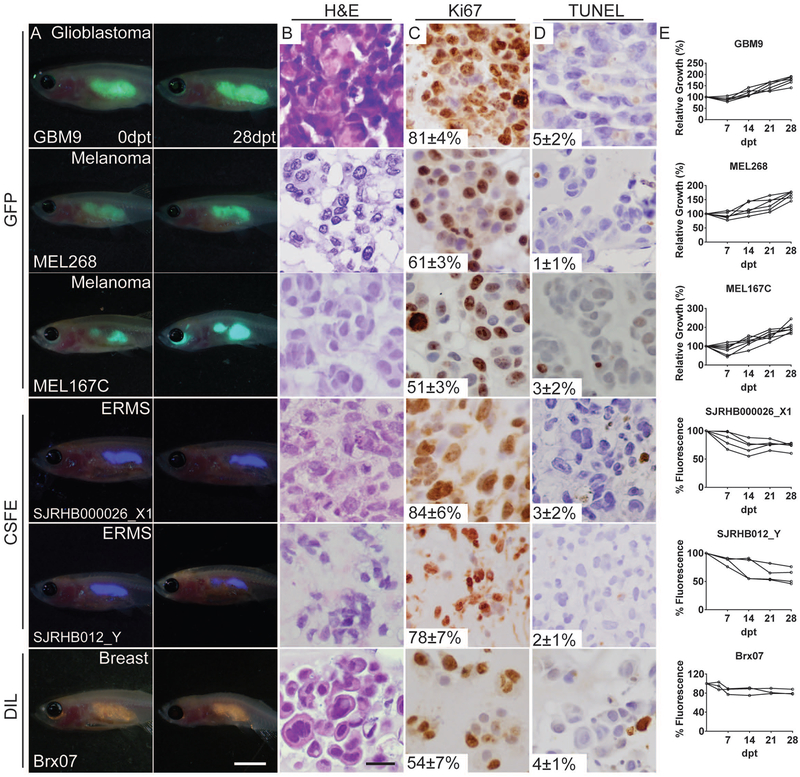
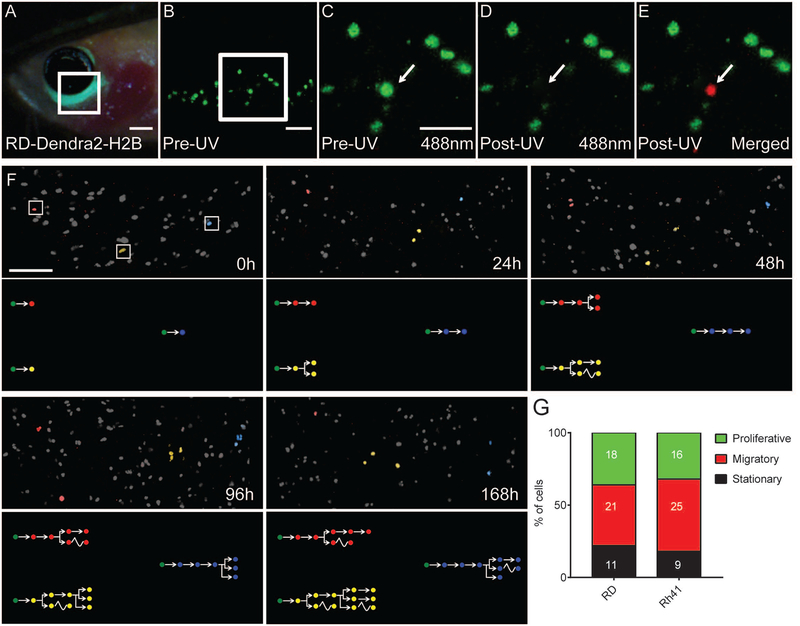
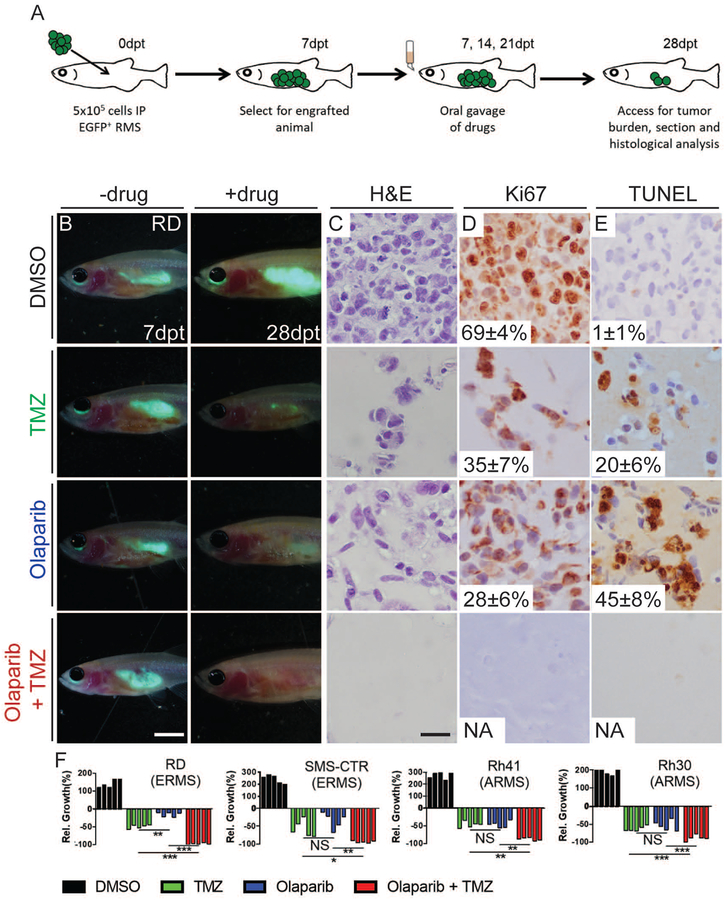
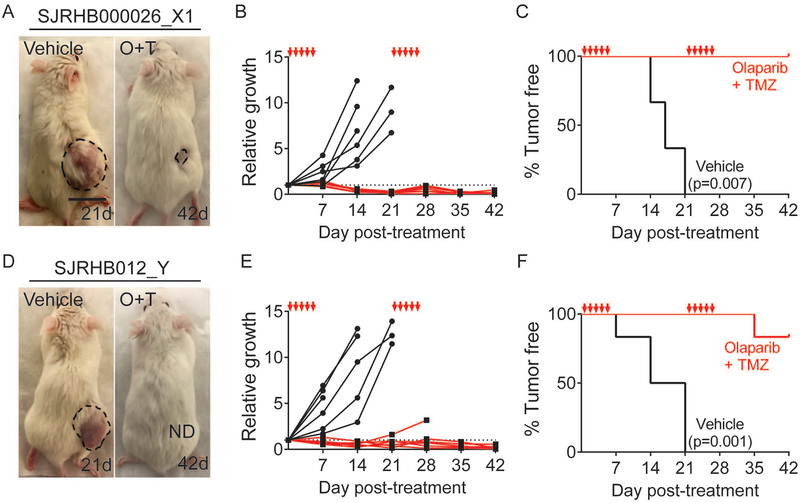
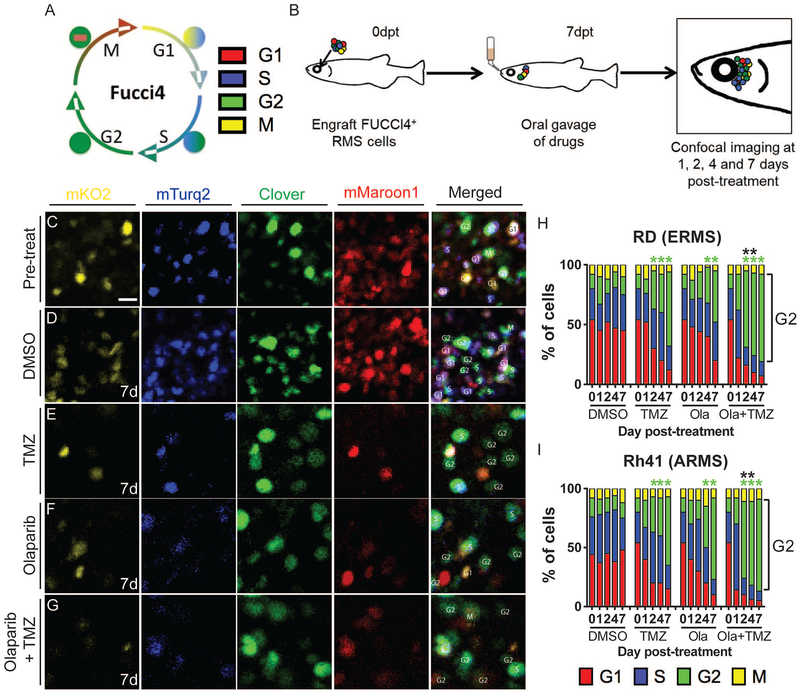
Xenograft cell transplantation into immunodeficient mice has become the gold standard for assessing pre-clinical efficacy of cancer drugs, yet direct visualization of single-cell phenotypes is difficult. Here, we report an optically-clear prkdc-/-, il2rga-/- zebrafish that lacks adaptive and natural killer immune cells, can engraft a wide array of human cancers at 37°C, and permits the dynamic visualization of single engrafted cells. For example, photoconversion cell-lineage tracing identified migratory and proliferative cell states in human rhabdomyosarcoma, a pediatric cancer of muscle. Additional experiments identified the preclinical efficacy of combination olaparib PARP inhibitor and temozolomide DNA-damaging agent as an effective therapy for rhabdomyosarcoma and visualized therapeutic responses using a four-color FUCCI cell-cycle fluorescent reporter. These experiments identified that combination treatment arrested rhabdomyosarcoma cells in the G2 cell cycle prior to induction of apoptosis. Finally, patient-derived xenografts could be engrafted into our model, opening new avenues for developing personalized therapeutic approaches in the future.

Keywords: SCID; breast cancer; il2rg; immune deficient; melanoma; prkdc; rhabdomyosarcoma; xenograft; zebrafish.


Figures

Figure 1.
Figure 1.. Human cancers have similar growth kinetics, histology, and rates of proliferation and apoptosis when engrafted into prkdc−/−, il2rga−/− zebrafish or NSG mice.
(A-F) Engraftment of EGFP+ human tumor cells into prkdc−/−, il2rga−/− zebrafish grown at 37°C. Merged fluorescence and brightfield images of whole animals imaged at 0 and 28 days post-transplant (dpt; A). (G-L) Analysis of the same tumors grown in NSG mice for 28 days. Images of engrafted mice shown to left and excised tumors to the right (G). Hematoxylin and eosin stained sections (zebrafish,B; mouse,H) and immunohistochemistry for cell lineage markers (zebrafish,C; mouse,I), Ki67 (zebrafish,D; mouse,J) and TUNEL (zebrafish,E; mouse,K) with the average percentage of positive cells +/− standard deviation noted (n≥3 animals/tumor type). Quantification of relative tumor growth in engrafted prkdc−/−, il2rga−/− zebrafish (F) and NSG mice (L). Human embryonal rhabdomyosarcoma RD (ERMS RD), alveolar rhabdomyosarcoma Rh41 (ARMS Rh41), melanoma UACC62, and triple-negative breast cancer MDA-MB-231. Scale bars equal 0.25 cm (A); 50 μm (B-E, H-K); and 0.5 cm (G). See also Table S1 and Figure S1.
Figure 2.
Figure 2.. Prkdc−/−, il2rga−/− zebrafish engraft patient-derived tumors.
Merged fluorescence and brightfield images of prkdc−/−, il2rga−/− zebrafish imaged at 0 and 28 days post-transplant (dpt, A). Hematoxylin and eosin stained sections (B) and immunohistochemistry for Ki67 (C) and TUNEL (D) with the average percentage of positive cells +/− standard deviation noted (n≥3 fish/tumor type). Quantification of relative growth of transplanted cells over time (E). Note that Viafluor- and DiL-labeled cells would not be predicted to increase intensity with time as 100% fluorescence equates to full retention of tumor cells over the experiment. Scale bar equals 0.25 cm (A); 50 μm (B-D).
Figure 3.
Figure 3.. Identification of functionally distinct rhabdomyosarcoma cell types using photo-convertible Dendra2-H2b and single cell fate mapping.
(A-E) A prkdc−/−, il2rga−/− zebrafish engrafted with H2b-Dendra2+ RD cells. Cells were engrafted into the peri-ocular muscle and imaged at 7 days post-transplantation. Epifluorescent image of head region (A) and higher magnification confocal images (B, 100X; C-E, 200X magnification). Images were taken before 405nm UV photoconversion (B,C) or immediately post-UV exposure (D-E, merged image E shows excitation using both 488 and 563nm laser). (F) Serially imaging of three photo-converted RD ERMS cells. Cells have been pseudo-colored and tracked at 0, 24, 48, 96 and 168 hours after photoconversion. Cell fates are pictorially depicted within lower panels with migration denoted by wavy lines. (G) Quantification of single cell behaviors in RD ERMS and Rh41 ARMS cells. Number of cells imaged with each phenotype are noted within bar graphs. Scale bar equals 0.1 cm (A); 50 μm (B-E); 200 μm (F). See also Figure S2 and S3.
Figure 4.
Figure 4.. Combination treatment of temozolomide and olaparib PARP-inhibitor reduces growth of human RMS cells in engrafted prkdc−/−, il2rga−/− zebrafish.
Schematic of experimental design (A). Merged fluorescence and brightfield images of prkdc−/−, il2rga−/− animals engrafted with EGFP+ RD cells (B). Whole animal imaging of engrafted animal at 7 dpt (prior to drug administration, B, left) and 28 dpt (after three cycles of drug dosing, B, right). Hematoxylin and eosin (C), Ki67 (D), and TUNEL (E) stained sections of fish engrafted with RD RMS cells. The average percentage of positive cells +/− standard deviation is noted (n=5 fish/treatment). Quantification of relative RMS growth following drug administration in RD, SMSCTR, Rh41 and Rh30 (F) cells. *p<0.05, **p<0.01, ***p<0.001, Student’s T-test. Not significant (NS). Scale bar equals 0.25 cm (B) and 50 μm (C-E). Not applicable (NA). See also Figure S4.
Figure 5.
Figure 5.. Combination treatment of temozolomide and olaparib PARP-inhibitor reduces growth of patient-derived rhabdomyosarcomas grown in NSG mice.
Representative images of mice engrafted with two independent PDX RMS and orally gavaged with vehicle control shown at 21 days post-treatment (21d) or following combination drug treatment at 42 days (42d, A,D). Quantification of relative growth (p=0.001 and p=0.008 at 42d for data shown in B and E, respectively, Fisher’s Exact Test) and Kaplan-Meier survival analysis with p-values denoted within the panels (C,F, n=6 mice/treatment arm). The five days of drug administration are denoted by red arrows in B,C,E and F. See also Figure S5.
Figure 6.
Figure 6.. FUCCI4 cell cycle imaging reveals that combined treatment with olaparib PARP-inhibitor and temozolomide results in rapid G2-cell cycle arrest of human RMS cells engrafted into prkdc−/−, il2rga−/− zebrafish.
Schematic of FUCCI 4-color cell reporter (A) and experimental design (B). Single fluorescent channels or merged images of RD expressing FUCCI4+ RD RMS cells engrafted peri-ocularly into prkdc−/−, il2rga−/− zebrafish (C-G). Merged images to the right denote cell cycle state for individual cells. High magnification images of cells prior to drug treatment (C) and 7 days after receiving control vehicle (D), temozolomide (TMZ,E), olaparib (F), or TMZ + olaparib (G). Quantification of cell cycle effects in RD ERMS (H) and Rh41 ARMS cells (I). Green asterisks denote statistical differences in numbers of G2-arrested cells when compared to vehicle controls and black asterisks denote differences between single olaparib- or single temozolomide-treated animals when compared to combination-treated zebrafish (*p<0.05 by Fisher’s exact test, n=100 cells analyzed per time point, n=3 animals/condition). Scale bar equals 10μm (C-G). See also Figure S6.

Comment in

References

    1. Agarwala SS & Kirkwood JM (2000). Temozolomide, a novel alkylating agent with activity in the central nervous system, may improve the treatment of advanced metastatic melanoma. Oncologist, 5, 144–51. - PubMed
    1. Bajar BT, Lam AJ, Badiee RK, Oh YH, Chu J, Zhou XX, Kim N, Kim BB, Chung M, Yablonovitch AL, et al. (2016). Fluorescent indicators for simultaneous reporting of all four cell cycle phases. Nat Methods, 13, 993–996. - PMC - PubMed
    1. Bakhoum SF, Ngo B, Laughney AM, Cavallo JA, Murphy CJ, Ly P, Shah P, Sriram RK, Watkins TBK, Taunk NK, et al. (2018). Chromosomal instability drives metastasis through a cytosolic DNA response. Nature, 553, 467–472. - PMC - PubMed
    1. Barr FG, Galili N, Holick J, Biegel JA, Rovera G & Emanuel BS (1993). Rearrangement of the PAX3 paired box gene in the paediatric solid tumour alveolar rhabdomyosarcoma. Nat Genet, 3, 113–7. - PubMed
    1. Beerling E, Seinstra D, de Wit E, Kester L, van der Velden D, Maynard C, Schafer R, van Diest P, Voest E, van Oudenaarden A, et al. (2016). Plasticity between Epithelial and Mesenchymal States Unlinks EMT from Metastasis-Enhancing Stem Cell Capacity. Cell Rep, 14, 2281–8. - PMC - PubMed

Publication types

MeSH terms