. 2019 May 16;177(5):1172-1186.e14.
doi: 10.1016/j.cell.2019.03.025. Epub 2019 Apr 25.

Adaptive Immune Resistance Emerges from Tumor-Initiating Stem Cells

Affiliations

Adaptive Immune Resistance Emerges from Tumor-Initiating Stem Cells

Yuxuan Miao et al. Cell. .

Abstract

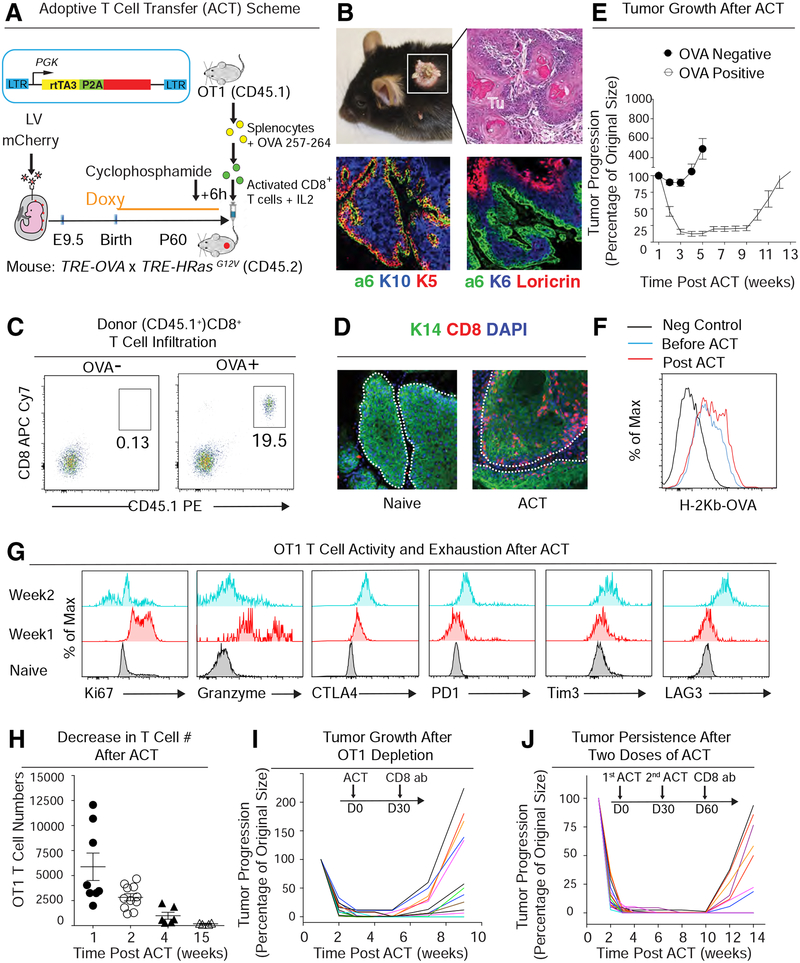
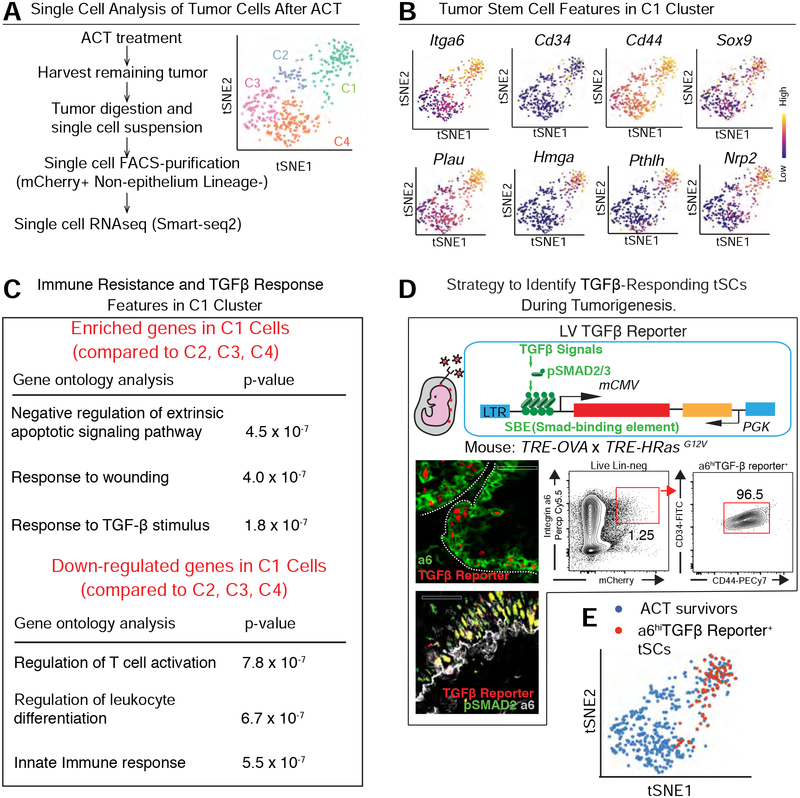
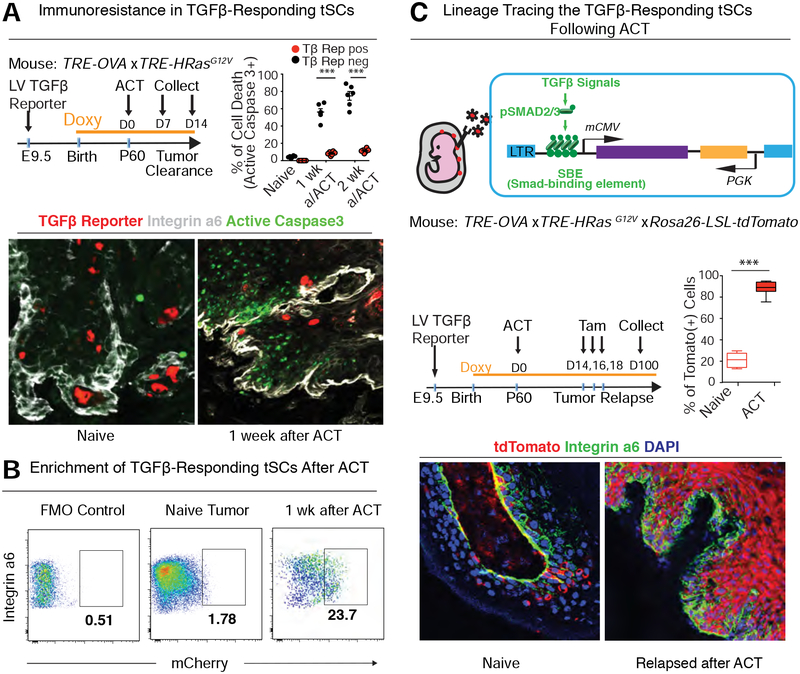
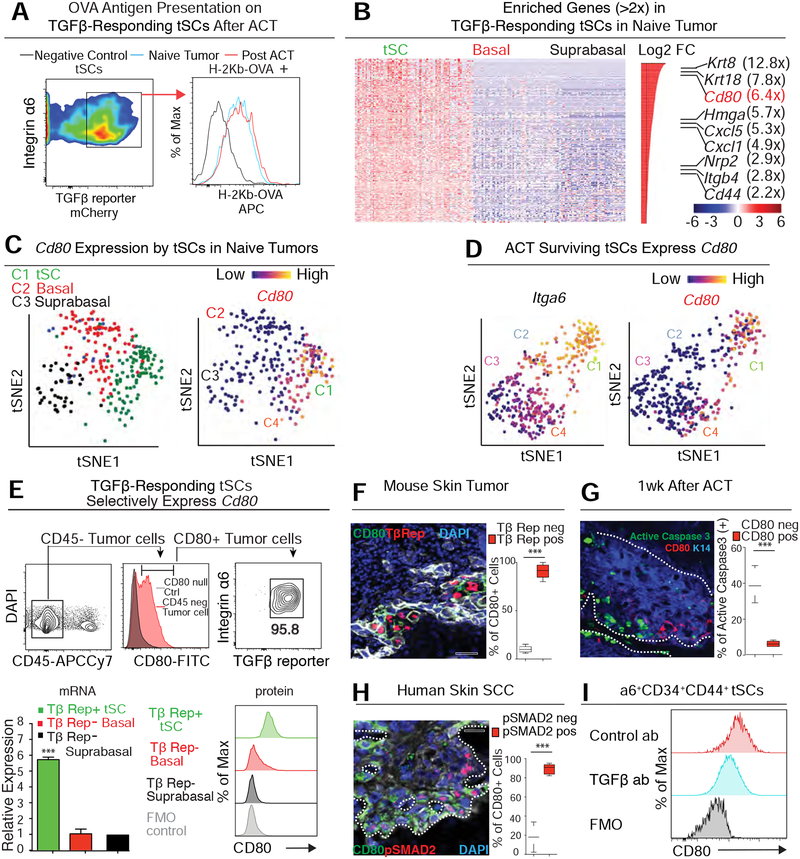
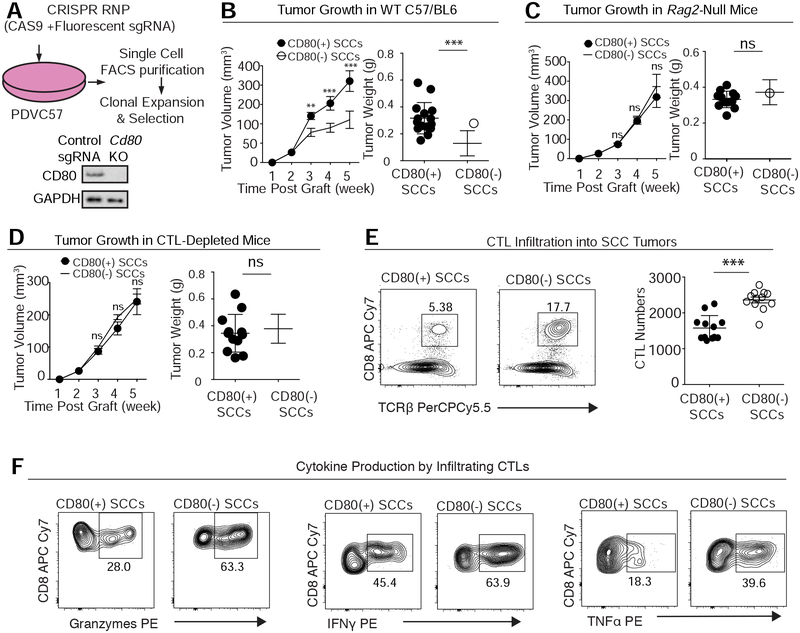
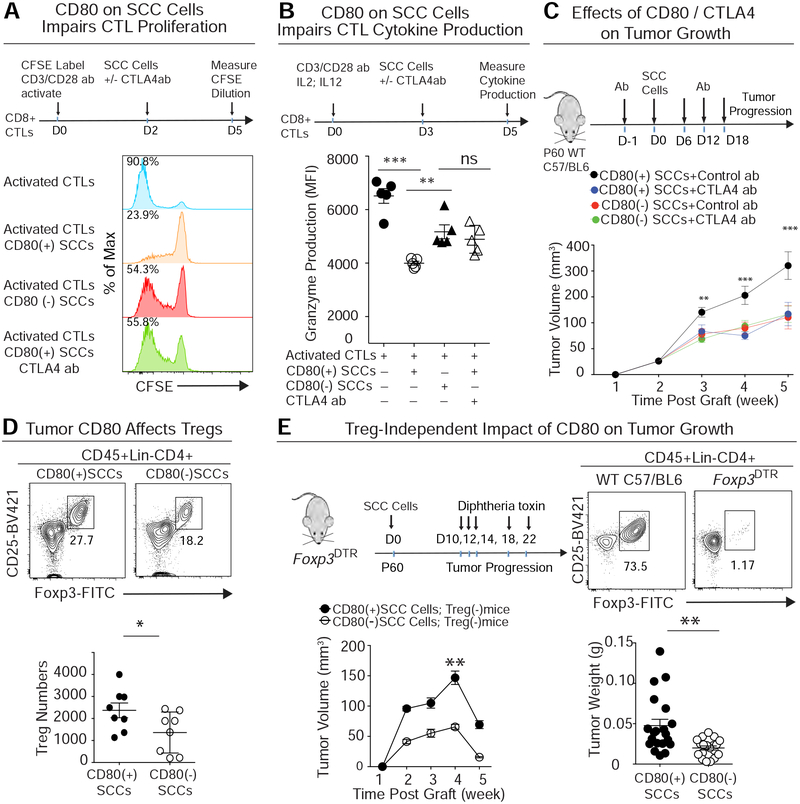
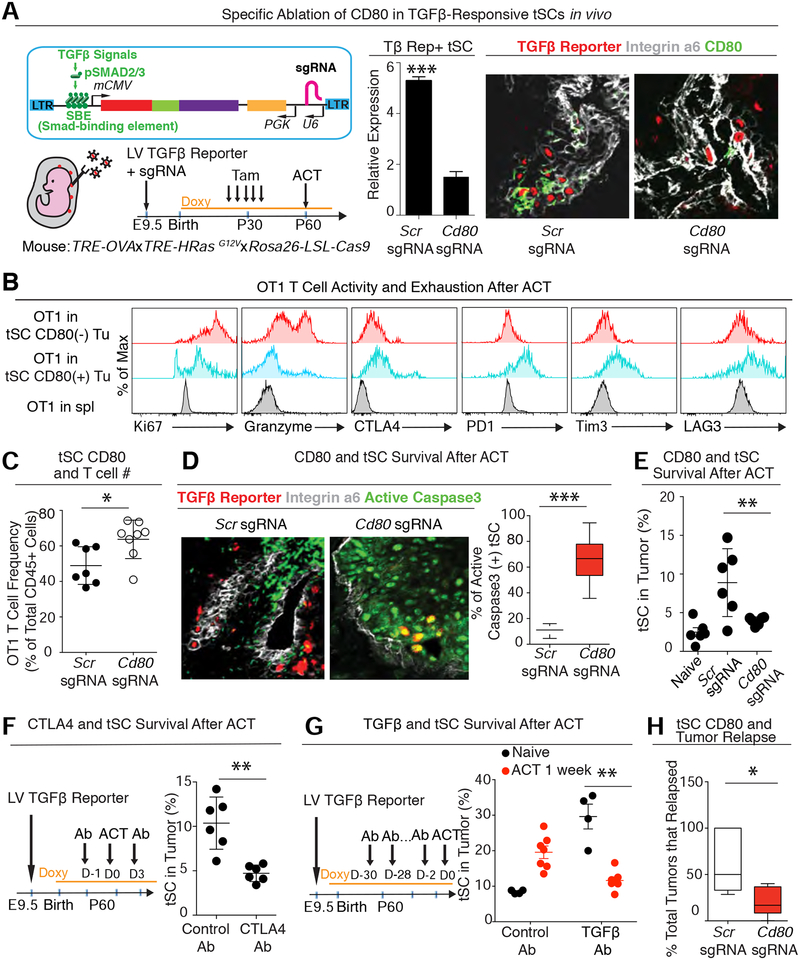
Our bodies are equipped with powerful immune surveillance to clear cancerous cells as they emerge. How tumor-initiating stem cells (tSCs) that form and propagate cancers equip themselves to overcome this barrier remains poorly understood. To tackle this problem, we designed a skin cancer model for squamous cell carcinoma (SCC) that can be effectively challenged by adoptive cytotoxic T cell transfer (ACT)-based immunotherapy. Using single-cell RNA sequencing (RNA-seq) and lineage tracing, we found that transforming growth factor β (TGF-β)-responding tSCs are superior at resisting ACT and form the root of tumor relapse. Probing mechanism, we discovered that during malignancy, tSCs selectively acquire CD80, a surface ligand previously identified on immune cells. Moreover, upon engaging cytotoxic T lymphocyte antigen-4 (CTLA4), CD80-expressing tSCs directly dampen cytotoxic T cell activity. Conversely, upon CTLA4- or TGF-β-blocking immunotherapies or Cd80 ablation, tSCs become vulnerable, diminishing tumor relapse after ACT treatment. Our findings place tSCs at the crux of how immune checkpoint pathways are activated.

Keywords: adoptive T cell transfer therapy; immune evasion; immune-stem cell interactions; lineage tracing; single-cell RNA sequencing; squamous cell carcinoma; tumor stem cell.


Conflict of interest statement

DECLARATION OF FINANCIAL INTERESTS.

The authors declare no competing financial interests.

Figures

Figure 1.
Figure 1.. A Murine Skin Tumor Model for Adoptive T Cell Transfer-Based Immunotherapy.
See also Figure S1 (A) Schematic. Lentivirus harboring rtTA3 and mCherry, both under the control of a constitutive phosphoglycerate kinase (PGK) promoter. Sparse, selective transduction of surface ectoderm was achieved by in utero ultrasound-guided microinjection of low titer LV into the amniOT-Ic sacs of living E9.5 CD45.2 TRE-HrasG12V TRE-OVA embryos. Doxy-induction of HRasG12V concomitantly initiates tumorigenesis and OVA expression in these transduced clonal patches of skin epithelium. Cytotoxic T cells for ACT were prepared from the spleen of CD45.1 OT-I mice and then activated in vitro as shown. Activated CTLs were then injected into tail veins of mice bearing OVA+ tumors. Mice were given cyclophosphamide 6 hrs prior to ACT to clear their endogenous immune repertoire. (B) Mice, H&E staining, and immunofluorescence (IMF) of skin tissue sections of a representative tumor induced as in (A). Integrin α6 demarcates tumor-stroma interface; keratin 5 (K5) marks progenitors and K10, K6 and loricrin confirm the well-differentiated nature of these early skin tumors. (C) Flow cytometry analysis of OT-I CD8+ T cell infiltration into OVA control or OVA+ tumors at one week post-ACT. CD45.1 distinguished donor from host immune cells. (D) IMF images of CD8+ T cells within tumors sampled before (naive) and one week after ACT. (E) Changes in tumor size following ACT treatment of mice harboring OVA control or OVA+ tumors. Tumor volumes were normalized to their original size. n=12; data are mean ± SEM. (F) Flow cytometry analysis of OVA antigen presentation on the surface of lineage-negative tumor cells ± ACT. (G) Flow cytometry analyses of proliferation maker (Ki67), anti-tumor cytokine production (granzyme) and T cell exhaustion markers (CTLA4, PD1, Tim3 and LAG3) in OT-I T cells following ACT. Naïve CD8+ T cells from donor spleen were used as negative control. (H) Decrease in tumor-infiltrating OT-I T cells following ACT treatment; data are mean ± SEM. (I, J) After one (I) and even two (J) ACT treatments, both active CTLs and tSCs still persist, since tumors regrow immediately following CTL depletion. Tumor volumes were normalized to their original size; the curves from different tumors are distinguished by different colors. data are mean ± SEM. All scale bars=50 μm.
Figure 2.
Figure 2.. Single Cell Transcriptome Analysis of ACT-Surviving Tumor Cells.
See also Figure S2. (A) Experimental scheme to characterize tumors 2 wk post-ACT by single cell RNA-seq (SmartSeq2). Principle component analyses (right) reveals four major clusters. (B) C1 shows classical features of tSCs (top row) and stem cell-specific, super-enhancer regulated genes (bottom row). Note: C3 and C4 display signatures of suprabasal, differentiating tumor cells, while C2 likely represent early suprabasal tumor cells (intga6loCd34neg) (Figure S2). (C) Gene ontology analyses of C1 transcripts changed by ≥2X compared to other tumor cell clusters (p<0.05). (D) (Top) Schematic of the LV construct for marking and monitoring TGFβ-responding tSCs. (Bottom left) Representative image of a naïve skin tumor immunolabeled for TGFβ-reporter (red) and (top) integrin α6 (green) or (bottom) pSMAD2(green). (Bottom right) Flow cytometry quantification of CD34+CD44+ tSCs within the integrin α6hiTGFβ-reporter+ cells. Scale bar, 50 μm (E) Single cell transcriptome of TGFβ-reporter+ tSCs from skin tumors (described later) overlaps with C1 ACT survivors.
Figure 3.
Figure 3.. TGFβ-Responding tSCs Persist and Form the Roots of Tumor Relapse Following ACT Treatment.
See also Figure S3. (A) TGFβ-responding tSCs are persistent after ACT. Representative image and quantification of immunolabeling for active Caspase3 (green) and TGFβ-reporter (red) in naïve tumor or tumor at 1 week post-ACT. Three tumors and >150 cells from each of two sagittal sections per tumor were analyzed for each time point. (B) Flow cytometry quantification of integrin α6hi TGFβ-reporter+ tSCs at 1 week post-ACT. Normal back skin cells labeled with the same Ab cocktail were used as fluorescence minus one (FMO) negative control to set the gate for mCherry. (C) Lineage-tracing of TGFβ-responding tSCs following ACT therapy. Experimental scheme (top), quantification (middle), and representative images (bottom) from lineage-traced tumor regrowth following ACT. Three tumors and >150 cells from each of two sagittal sections per tumor were analyzed for each time point. All scale bars=50 μm.
Figure 4.
Figure 4.. TGF-β-Responding tSCs Express CD80.
See also Figure S4. (A) Flow cytometry analysis of OVA antigen presentation on the surface of Integrin α6hi TGFβ-reporter+ tSCs before and after ACT treatment. (B) Heatmap of single cell transcriptome profiles of naïve tumors reveals genes differentially expressed between TGFβ-responding tSCs and other tumor cells (Integrin α6hi or low). Note that Cd80 is among the most highly up-regulated transcripts in naïve tSCs. (C) t-SNE plots showing that the high Cd80 expression is restricted to C1 cluster that represents the TGFβ-reporter+ tSCs of the naïve tumor. (D) t-SNE plots showing high Cd80 expression only in the C1 cluster of ACT survivors that represent the tSCs (Integrin α6hi). (E) CD80 expression in skin tumors. (Upper) Flow cytometry analysis shows that integrin α6hi TGFβ-reporter+ tSCs are the non-immune (CD45neg cell) source of surface CD80. (Lower left) qRT-PCR analysis of Cd80 in naïve tumor cells. Data are mean ± SEM. (Lower Right) Flow cytometry analysis of CD80 protein different FACS-purified tumor populations. (F-H) IMF and quantifications of CD80 and integrin α6hi in TGFβ-reporter+ tSCs of mouse (F,G) and human (H) skin SCCs. Data are from 3 tumors and 2 sagittal sections (>150 cells each) for each tumor and time point. Scale bars, 50 μm. (I) Flow cytometry shows that CD80 on Integrin a6+CD34+CD44+ tSCs was significantly reduced when TGFβ blocking Abs were administered to tumor bearing mice for one month.
Figure 5.
Figure 5.. CD80 Protects Tumor Stem Cells from Cytotoxic T Cells.
See also Figure S5. (A) Schematic of CRISPR/Cas9-mediated Cd80 ablation in the skin SCC line PDVC57. Immunoblots confirmed the status of CD80 in CD80(+) and CD80(−) isogenic PDVC57 SCC cells. (B) Effect of CD80 on SCC growth in C57BL/6 mice (left: tumor volume; right: tumor size at week 5). Note that CD80 deficiency diminishes tumorigenesis on these immunocompetent mice. n=15; data are mean ± SEM. (C) Effect of CD80 on SCC growth in C57BL/6 mice lacking all B and T lymphocytes (left: tumor volume; right: tumor size at week 5). Note that CD80 deficiency does not diminish tumorigenesis when mice lack an adaptive immune system. n=15, data are mean ± SEM. (D) Effect of CD80 on SCC growth in C57BL/6 mice immunodepleted for their CD8+ CTLs (left: tumor volume; right: tumor size at week 5). Note that CD80 deficiency does not diminish tumorigenesis when CD8 T cells are not present. n=15; data are mean ± SEM. (E,F) Effect of CD80 on (E) CD8+ T cell infiltration in tumors (Left, percentage of total CD45+ cells; Right, exact T cell number per 0.1 mg tumor) and (F) CD8+ T cell production of Granzyme, IFNγ and TNFα (percentage of total CD8+ T cells). Quantifications are by flow cytometry.
Figure 6.
Figure 6.. tSC-CD80 Attenuates Cytotoxic T Cell Activities Both by Direct Engagement and Indirectly by Elevating Treg Numbers.
See also Figure S6. (A) Primary CD8+ T cells were activated by incubation with CD3/CD28 Abs and labeled with CFSE, a dye that is only diluted with subsequent cell divisions. These T cells were then co-cultured to measure the effects of CD80(+) and CD80(−) SCC cells on their dye dilution as a proxy for T cell activity. Note that CD80(+) SCC cells robustly impaired T cell activity, and that this effect was abrogated by CTLA4 blocking Abs. This combined effect was comparable to that of SCC cells lacking CD80. n=15; data are mean ± SEM. (B) Primary CD8+ T cells, activated as in (A), were exposed to IL2 and IL12 for 3d and then co­cultured to measure the effects of CD80(+) or CD80(−) SCC cells on their granzyme production as a proxy for CTL activity. Note that CD80(+) SCC cells robustly impaired T cell cytokine production, and that this effect was abrogated by silencing CD80 or CTLA4 blocking Abs. Data are mean ± SEM. (C) CD80(+) or CD80(−) PDVC57 SCC cells were transplanted into C57/BL6 mice treated with either isotype control or CTLA4 blocking Abs, and tumor progression was analyzed at times indicated. Note that the effects of CD80 loss are as potent as CTLA4 Abs. n=15; data are mean ± SEM. (D) Flow cytometry quantifications of the CD4+CD25HiFoxp3+ Treg cells that infiltrated CD80(+) and CD80(−) tumors (Left, percentage of total CD4 T cells; Right, exact Treg number per 0.1 mg tumor). (E) CD80(+) or CD80(−) SCC tumors grown on Foxp3DTR mice treated with vehicle or with diphtheria toxin to eliminate Foxp3+ Treg cells. n=20; data are mean ± SEM.
Figure 7.
Figure 7.. CD80 is Critical for TGFβ-responding tSCs to Dampen Immune Attack and Survive ACT.
See also Figure S7. (A) (Left) Strategy to achieve TGFβ-responding tSC-specific silencing of Cd80 in a spontaneous HRasG12V-driven skin tumor. (Right) qPCR and representative IMF reveal efficient CD80 targeting and CD80 Ab efficacy. (B) Flow cytometry analysis of proliferation (Ki67), cytokine production (granzyme) and T cell exhaustion markers (CTLA4, PD1, Tim3 and LAG3) in OT-I T cells that infiltrated Control (Scr-sg) or Cd80-null (Cd80-sg) tumors at 2 week post-ACT. The naïve CD8+ T cells from donor spleen was used as negative control. (C) Flow cytometry analysis of T cell frequency in the control tumors or CD80 sgRNA transduced tumors at 2 week post-ACT. (D) IMF and quantifications of active Caspase3 (green) and TGFβ-reporter (red) in OVA+ Scr sgRNA (left) or Cd80 sgRNA (right) transduced tumors at 1 week post-ACT. Five tumors with two slides from each tumor were analyzed; >150 cells were counted from each slide. (E) Flow cytometry quantifications of integrin α6hi TGFβ-reporter+ tSCs in Scr sgRNA or Cd80 sgRNA transduced tumors at 1 week post-ACT showing that the enrichment of tSCs is dramatically reduced when Cd80 is silenced in tSCs. (F) Flow cytometry quantifications of integrin α6hi TGFβ-reporter+ tSCs in mice treated with control or CTLA4 blocking Ab at 1 week post-ACT. (G) Flow cytometry quantifications of integrin α6hi TGFβ-reporter+ tSCs in mice treated with control or TGFβ blocking Ab without ACT treatment or at 1 week post-ACT. (H) Tracking Scr sgRNA or Cd80 sgRNA transduced tumors after ACT. n=15 for control; n=21 for tSC-specific targeting of Cd80. All Scale bars=50 μm.

References

    1. Agudo J, Park ES, Rose SA, Alibo E, Sweeney R, Dhainaut M, Kobayashi KS, Sachidanandam R, Baccarini A, Merad M, et al. (2018). Quiescent Tissue Stem Cells Evade Immune Surveillance. Immunity 48, 271–285 e275. - PMC - PubMed
    1. Alegre ML, Frauwirth KA, and Thompson CB (2001). T-cell regulation by CD28 and CTLA-4. Nat Rev Immunol 1, 220–228. - PubMed
    1. Anders S, and Huber W (2010). Differential expression analysis for sequence count data. Genome Biol 11, R106. - PMC - PubMed
    1. Batlle E, and Clevers H (2017). Cancer stem cells revisited. Nat Med 23, 1124–1134. - PubMed
    1. Beck B, Driessens G, Goossens S, Youssef KK, Kuchnio A, Caauwe A, Sotiropoulou PA, Loges S, Lapouge G, Candi A, et al. (2011). A vascular niche and a VEGF-Nrp1 loop regulate the initiation and stemness of skin tumours. Nature 478, 399–403. - PubMed

Publication types

MeSH terms

Substances