. 2019 Jun 20;74(6):1278-1290.e9.
doi: 10.1016/j.molcel.2019.03.040. Epub 2019 Apr 25.

METTL1 Promotes let-7 MicroRNA Processing via m7G Methylation

Affiliations

METTL1 Promotes let-7 MicroRNA Processing via m7G Methylation

Luca Pandolfini et al. Mol Cell. .

Abstract

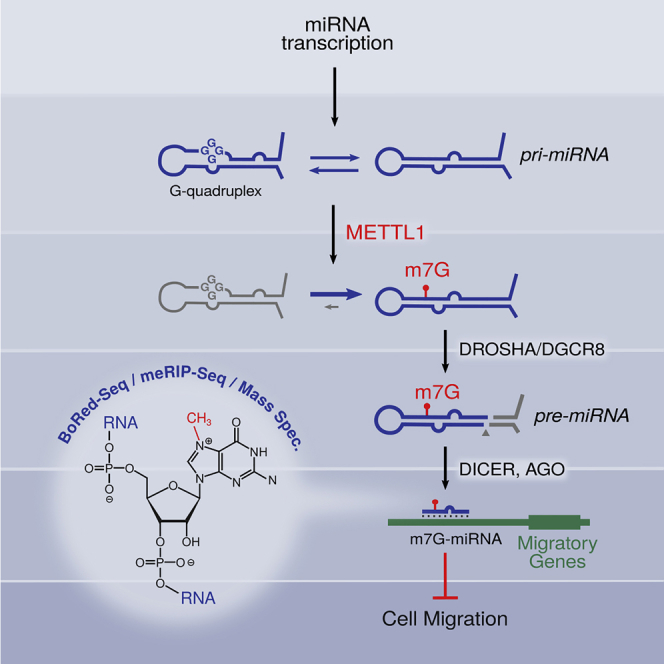
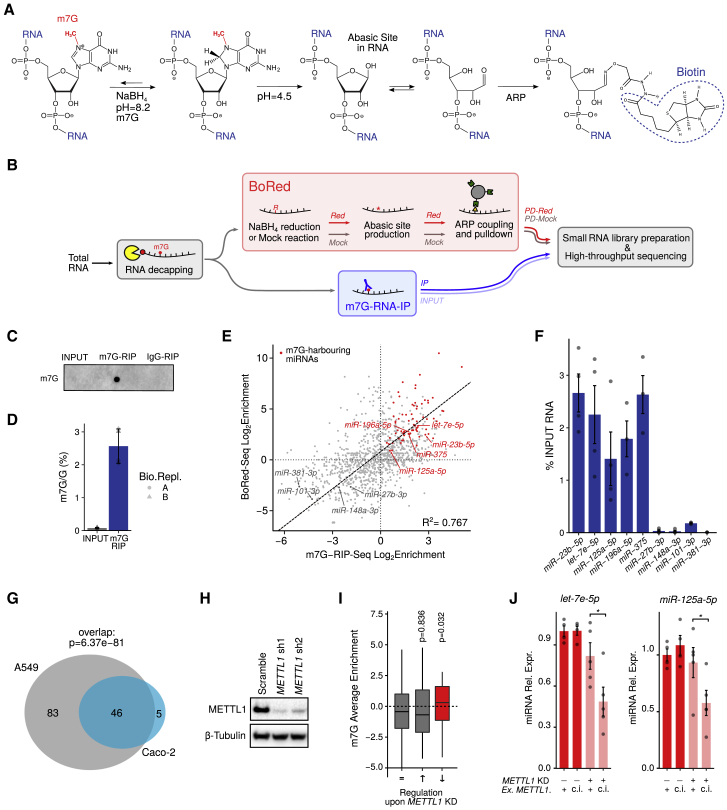
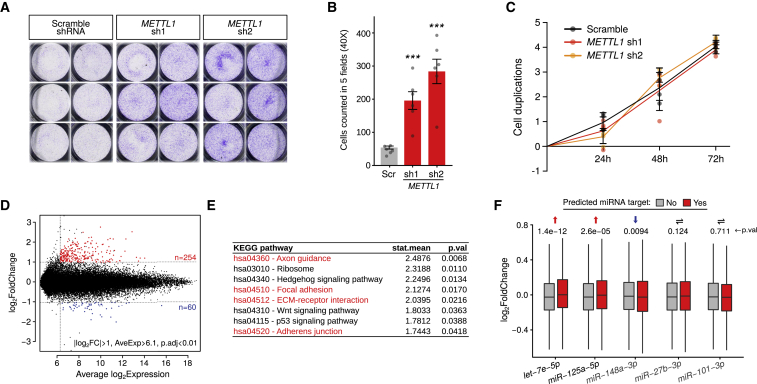
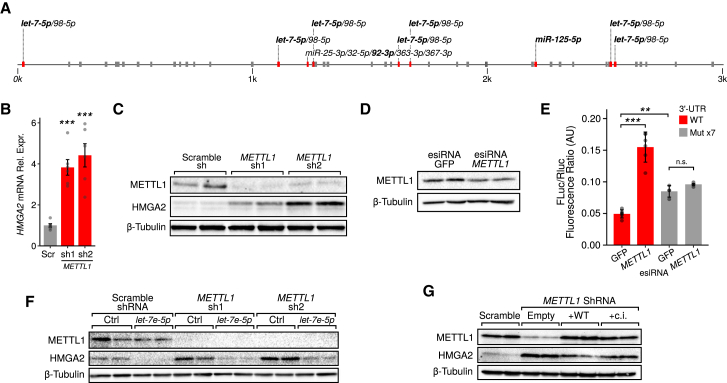
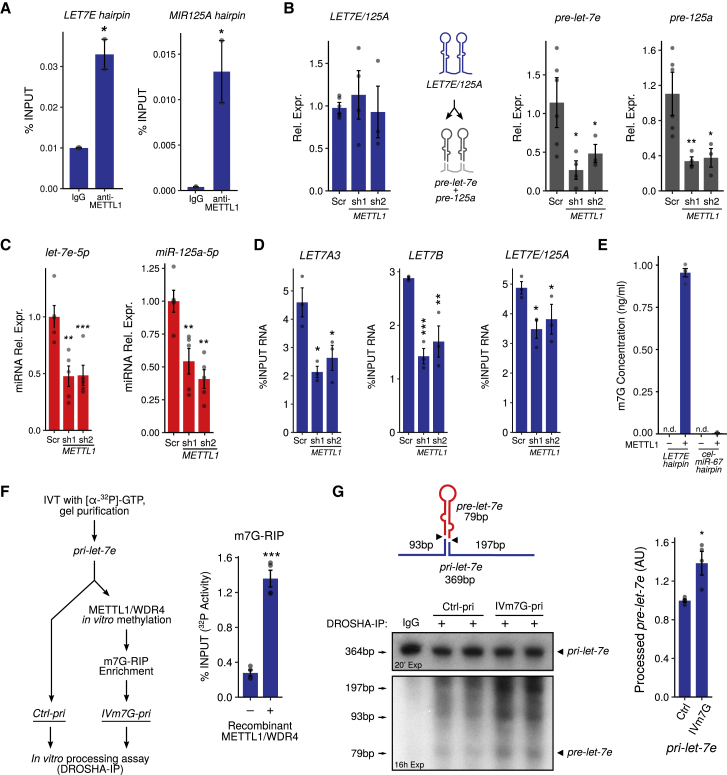
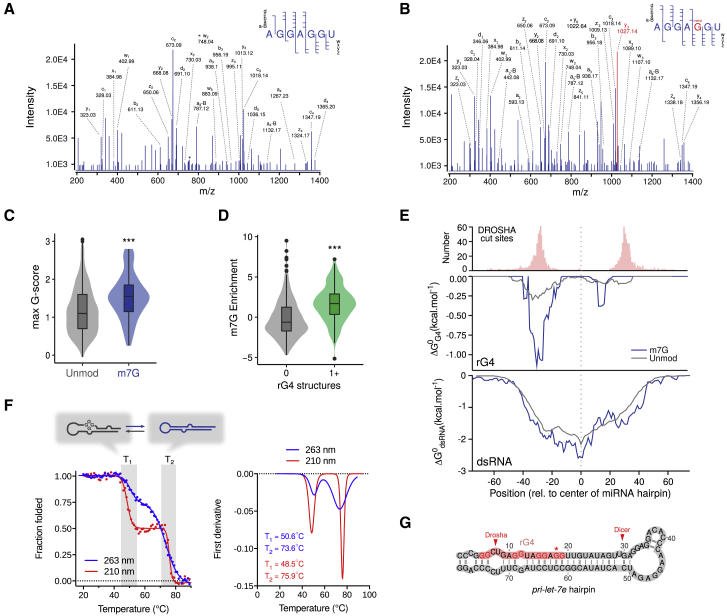
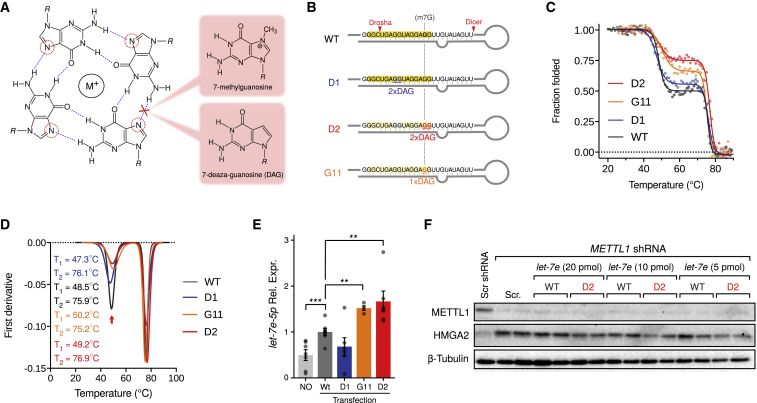
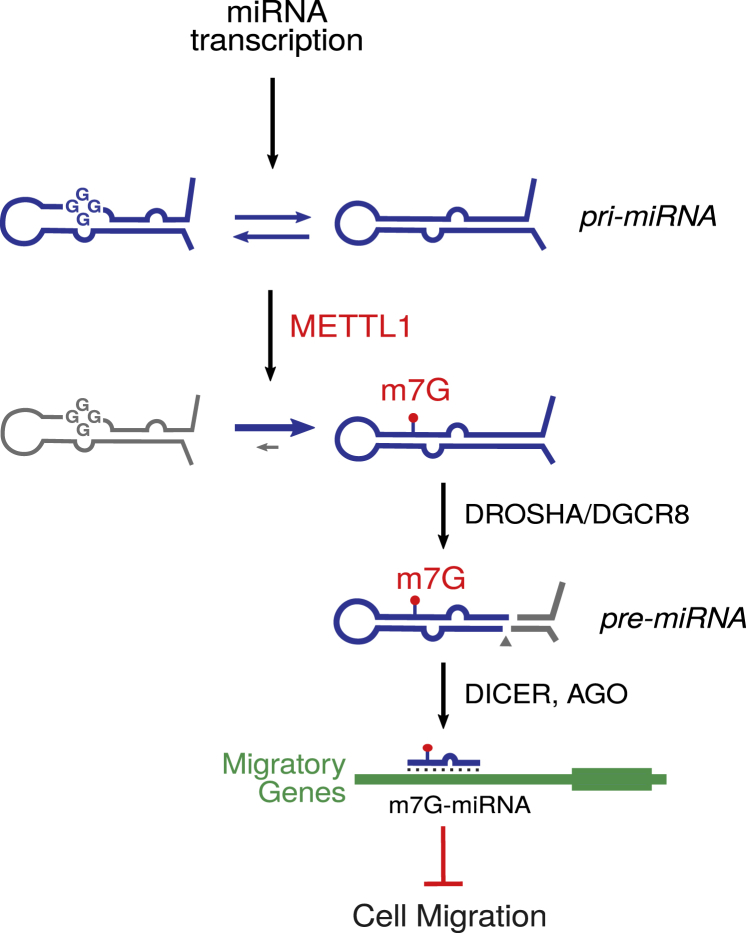
7-methylguanosine (m7G) is present at mRNA caps and at defined internal positions within tRNAs and rRNAs. However, its detection within low-abundance mRNAs and microRNAs (miRNAs) has been hampered by a lack of sensitive detection strategies. Here, we adapt a chemical reactivity assay to detect internal m7G in miRNAs. Using this technique (Borohydride Reduction sequencing [BoRed-seq]) alongside RNA immunoprecipitation, we identify m7G within a subset of miRNAs that inhibit cell migration. We show that the METTL1 methyltransferase mediates m7G methylation within miRNAs and that this enzyme regulates cell migration via its catalytic activity. Using refined mass spectrometry methods, we map m7G to a single guanosine within the let-7e-5p miRNA. We show that METTL1-mediated methylation augments let-7 miRNA processing by disrupting an inhibitory secondary structure within the primary miRNA transcript (pri-miRNA). These results identify METTL1-dependent N7-methylation of guanosine as a new RNA modification pathway that regulates miRNA structure, biogenesis, and cell migration.

Keywords: 7-methylguanosine; G-quadruplexes; METTL1; RNA methylation; SAM-dependent methyltransferase; cell migration; high-throughput sequencing; let-7; miRNA biogenesis; microRNA.


Figures

None
Graphical abstract
Figure 1
Figure 1
Detection of m7G in Specific miRNAs in A549 Cells (A) Schematic of a novel chemical method to detect internal m7G RNA modification. (B) Schematic representation of the procedure used to identify the m7G modified miRNAs in A549 cells. (C) Immuno-dot blot of total decapped INPUT RNA (10%) or RNA immunoprecipitated with anti-m7G antibody or control immunoglobulin G (IgG). (D) Immunoprecipitation with anti-m7G antibody enriches for m7G-containaing RNAs as determined by mass spectrometry (MS; see also Figure S1). The average of two biological replicates ± SDs is shown. (E) Scatterplot showing a high degree of consistency between the BoRed-seq approach and RIP-seq in detecting miRNAs harboring m7G (upper right quadrant). Goodness of fit is calculated as R2 Pearson correlation coefficient. (F) RNA immunoprecipitation with the anti-m7G antibody coupled to qRT-PCR was used to validate five m7G-containing miRNAs and four negative miRNAs, which are identified in (E). The average of four biological replicates ± SDs is shown. The distributions of mean enrichments in m7G+ and m7G miRNAs are significantly different, as evaluated by the two-tailed Wilcoxon text (p < 0.05). (G) Venn diagram showing the overlap between miRNAs significantly enriched in m7G-RIP of A549 and Caco-2 cells, respectively (see also Figure S2). The p value is obtained by Fisher’s exact test. (H) Western blot showing METTL1 protein levels in A549 cells infected with METTL1-specific (sh1, sh2) or control (Scramble) tetracycline (TET)-inducible shRNAs 5 days after doxycycline treatment. A representative experiment of four independent biological replicates is shown. (I) Boxplot showing increased m7G signal (as an average enrichment in both BoRed-seq and m7G-RIP-seq; E) in miRNAs that are significantly downregulated (↓) upon inducible METTL1 knockdown, but not in miRNAs that are unchanged (=) or upregulated (↑). Statistical significance was calculated by the Wilcoxon test. (J) qRT-PCR showing the levels of let-7e-5p and miR-125a-5p in WT and METTL1 knockdown A549 cells in the presence of either active (+) or catalytically inactive (c.i.) exogenous METTL1 (Ex. METTL1).
Figure 2
Figure 2
METTL1 Inhibits Cellular Migration of A549 Cells (A) A migration assay was performed for 7 h using cells infected with METTL1-specific (sh1, sh2) or control (Scramble) TET-inducible shRNAs 5 days after doxycycline treatment. (B) Results from (A) were quantitated and plotted, as indicated. The plot shows the average of six biological replicates ± SDs (∗∗∗p < 0.001, two-tailed t test). (C) A proliferation assay was initiated 4 days after doxycycline treatment of cells infected with METTL1-specific (sh1, sh2) or control (Scramble) TET-inducible shRNAs. The average of four biological replicates ± SDs is shown. (D) Global gene expression analysis of cells infected with METTL1-specific (sh1) or control (Scramble) TET-inducible shRNAs 5 days after doxycycline treatment. log2 fold change was plotted against average log2 expression. Significantly upregulated (red) and significantly downregulated (blue) transcripts are indicated. See also Figure S3. (E) Gene Ontology analysis of gene expression changes following METTL1 knockdown identifying upregulated Kyoto Encyclopedia of Genes and Genomes (KEGG) pathways involved in cellular migration (red). (F) log2 fold change in the expression of predicted targets of the indicated miRNAs upon METTL1 knockdown. Each pair of boxplots compares the fold change of mRNAs that are targets (red) or not (gray) of a single specific miRNA. Statistical significance was calculated by the Wilcoxon test.
Figure 3
Figure 3
METTL1 Catalytic Activity Regulates HMGA2 Expression in a let-7-Dependent Manner (A) Schematic of HMGA2 3′ UTR showing the enrichment of evolutionarily conserved target sites of several m7G-containing miRNAs (OR = 5.46, p = 0.001). (B) HMGA2 expression was measured by qRT-PCR in A549 cells infected with METTL1-specific (sh1, sh2) or control (Scr) TET-inducible shRNAs 5 days after doxycycline treatment. The average of six biological replicates ± SDs is shown (∗∗∗p < 0.001, two-tailed t test). (C) Western blot showing METTL1, HMGA2, and β-tubulin protein levels in A549 cells infected with METTL1-specific (sh1, sh2) or control (Scramble) TET-inducible shRNAs 5 days after doxycycline treatment. Two representative biological replicates of a total of four are shown. (D) Western blot showing METTL1 downregulation upon transfection with METTL1-specific siRNAs in A549 cells stably expressing a luciferase cDNA with Hmga2 3′ UTR. Two independent transfections of a total of four replicates are shown. (E) Luciferase fluorescence levels upon METTL1 downregulation in A549 cells stably expressing a luciferase cDNA with Hmga2 3′ UTR as a reporter. Red and gray bars indicate luciferase levels in the presence of either WT Hmga2 3′ UTR or of a variant in which all 7 let-7 seed sequences have been mutated, respectively. The plot shows the average of four independent transfections ± SDs (∗∗∗p < 0.001, two-tailed t test). (F) Western blot showing the rescue of HMGA2 upregulation upon transfection with let-7e-5p mature miRNA in METTL1 knockdown A549 cells. Two independent transfection replicates of a total of four are shown. (G) Western blot showing the rescue of HMGA2 upregulation upon the overexpression of WT, but not catalytically inactive METTL1, in A549 METTL1 knockdown cells. Two representative biological replicates of a total of five independent infections are shown. See also Figure S4.
Figure 4
Figure 4
METTL1 Directly Modifies let-7e pri-miRNA and Regulates Its Processing (A) CLIP-qPCR using a METTL1-specific antibody or a non-specific IgG. The levels of immunoprecipitated pri-let-7e and pri-mir-125a hairpins are shown. The average of two independent immunoprecipitation reactions ± SEMs is shown (p < 0.05, two-tailed t test). miR-148a is shown in Figure S4E as a negative control. (B) qRT-PCR showing the levels of either LET7E/125A primary transcript (blue) or let-7e and miR-125a precursors (gray) upon METTL1 knockdown in A549 cells. The average of five to six independent biological replicates ± SDs is shown (p < 0.05, ∗∗p < 0.01, two-tailed t test). (C) qRT-PCR quantification of let-7e-5p and miR-125a-5p upon METTL1 knockdown. The average of five independent biological replicates ± SDs is shown (∗∗p < 0.01, ∗∗∗p < 0.001, two-tailed t test). miR-148a-3p is shown in Figure S4F as a negative control. (D) m7G RNA immunoprecipitation and qRT-PCR of LET7A3, LET7B, and LET7E/125A primary transcripts in A549 cells upon METTL1 knockdown. The average of three independent biological replicates ± SEMs is shown (p < 0.05, ∗∗p < 0.01, ∗∗∗p < 0.001, two-tailed t test). (E) In vitro methylation reaction using recombinant METTL1/WDR4 pre-assembled complex on let-7e or cel-miR-67 primary hairpin (negative control). MS analysis shows specific m7G methylation of the let-7e hairpin. The average of three independent experiments ± SDs is shown. (F) Experimental strategy to obtain radiolabeled, m7G-modified pri-let-7e (IVm7G-pri). The histogram shows the fraction of RNA recovered by m7G-RIP after in vitro methylation with METTL1/WDR4, as evaluated by scintillation counting (∗∗∗p < 0.001, two-tailed t test). (G) In vitro processing assay of pri-let-7e: control (Ctrl) or in vitro methylated pri-miRNAs were incubated in the presence of immunoprecipitated DROSHA. Autoradiography reveals that IVm7G-pri undergoes more efficient processing, yielding the expected cleavage pattern shown in the illustration. The histogram shows the relative quantification of the resulting pre-let-7e from four samples obtained in two independent experiments (p < 0.05, two-tailed t test). Autoradiography images are composites of different molecular weight regions and exposure times. Full, unprocessed images are deposited on Mendeley Data. See also Figure S5.
Figure 5
Figure 5
G-Quadruplexes Mark m7G-Containing miRNAs (A and B) Spectral sequencing of in vivo let-7e-5p showing unmodified (A) and methylated 5′-AGGAGGU-3′ (B) fragments, obtained following RNase A digestion of a miRNA fraction isolated from A549 cells (see also Figure S5). (C) Boxplot showing the maximum G-score, a quantitative estimation of G-richness and G-skewness (see Method Details for definition), in primary hairpins of either unmodified or m7G containing miRNAs (∗∗∗p < 0.001, Wilcoxon test). (D) Boxplot showing the enrichment of miRNAs, grouped according to the propensity of their primary hairpins to form G-quadruplexes (∗∗∗p < 0.001, Wilcoxon test). (E) Metagene plot showing pri-miRNA cleavage site distribution (top) and the predicted stability of G-quadruplexes (center), and double strand (bottom) across primary hairpins of unmodified (gray) or m7G-modified miRNAs (blue). (F) Denaturation experiments of let-7e primary hairpin in the presence of 100 mM KCl followed by circular dichroism at 263 or 210 nm show two transitions demonstrating that let-7e exists as a mixture of two distinct structures in equilibrium in solution (top). The first structure melts at 48.5°C–50.6°C, while the second one is more stable (75.9°C–73.6°C). (G) Scheme showing the predicted G-quadruplex (rG4, pink) within the pri-let-7e hairpin. In red are shown the guanosines predicted to be involved in the formation of the quadruplex motif. Arrows mark the cleavage sites of let-7e-5p processing. The asterisk indicates the position of m7G. See also Figure S6.
Figure 6
Figure 6
m7G Position Is Essential for let-7e Quadruplex:Stem-Loop Equilibrium and Promotes miRNA Processing (A) Schematic representation of a guanine tetrad, highlighting Hoogsteen base pairing involving the N7 of guanosine that stabilizes the G-quadruplex structure, together with a stabilizing monovalent cation (M+, usually potassium). Both 7-methylguanosine and 7-deaza-guanosine are able to destabilize the hydrogen bond involving N7. (B) Illustration depicting the pri-miRNA hairpins used in the following experiments. (C) Thermal denaturation studies of RNA oligonucleotides as described in (B). While GG-to-DAG-DAG mutation at the D1 position does not significantly affect the contribution of G4 in the G4:stem-loop equilibrium, GG-to-DAG-DAG mutation at the D1 position and a single G11-to-DAG mutation affect the contribution of rG4 in the structural equilibrium by shifting it toward the hairpin form. (D) First derivative plot of the denaturation experiment in (C) helps visualize the decrease in rG4 contribution to the equilibrium (red arrow). (E) qRT-PCR showing the levels of let-7e-5p 72 h after transfection with either WT, D1, D2, or G11 oligonucleotides. The average of six independent transfections ± SDs is shown (∗∗p < 0.01, ∗∗∗p < 0.001, two-tailed t test). (F) Western blot showing the rescue of HMGA2 upregulation upon transfection of D2, but not WT let-7e primary hairpin in A549 METTL1 knockdown cells. Two representative biological replicates of a total of three independent experiments are shown.
Figure 7
Figure 7
Role of m7G in miRNA Biogenesis Proposed model of the role of METTL1-mediated m7G in promoting miRNA processing and suppressing migration phenotype.

Comment in

References

    1. Alarcón C.R., Lee H., Goodarzi H., Halberg N., Tavazoie S.F. N6-methyladenosine marks primary microRNAs for processing. Nature. 2015;519:482–485. - PMC - PubMed
    1. Alexandrov A., Martzen M.R., Phizicky E.M. Two proteins that form a complex are required for 7-methylguanosine modification of yeast tRNA. RNA. 2002;8:1253–1266. - PMC - PubMed
    1. Balzeau J., Menezes M.R., Cao S., Hagan J.P. The LIN28/let-7 pathway in cancer. Front. Genet. 2017;8:31. - PMC - PubMed
    1. Bao X., Guo X., Yin M., Tariq M., Lai Y., Kanwal S., Zhou J., Li N., Lv Y., Pulido-Quetglas C. Capturing the interactome of newly transcribed RNA. Nat. Methods. 2018;15:213–220. - PMC - PubMed
    1. Bartel D.P. MicroRNAs: target recognition and regulatory functions. Cell. 2009;136:215–233. - PMC - PubMed

Publication types