. 2019 Jul 2;30(1):143-156.e5.
doi: 10.1016/j.cmet.2019.04.002. Epub 2019 Apr 25.

Cholesterol Induces CD8+ T Cell Exhaustion in the Tumor Microenvironment

Affiliations

Cholesterol Induces CD8+ T Cell Exhaustion in the Tumor Microenvironment

Xingzhe Ma et al. Cell Metab. .

Abstract

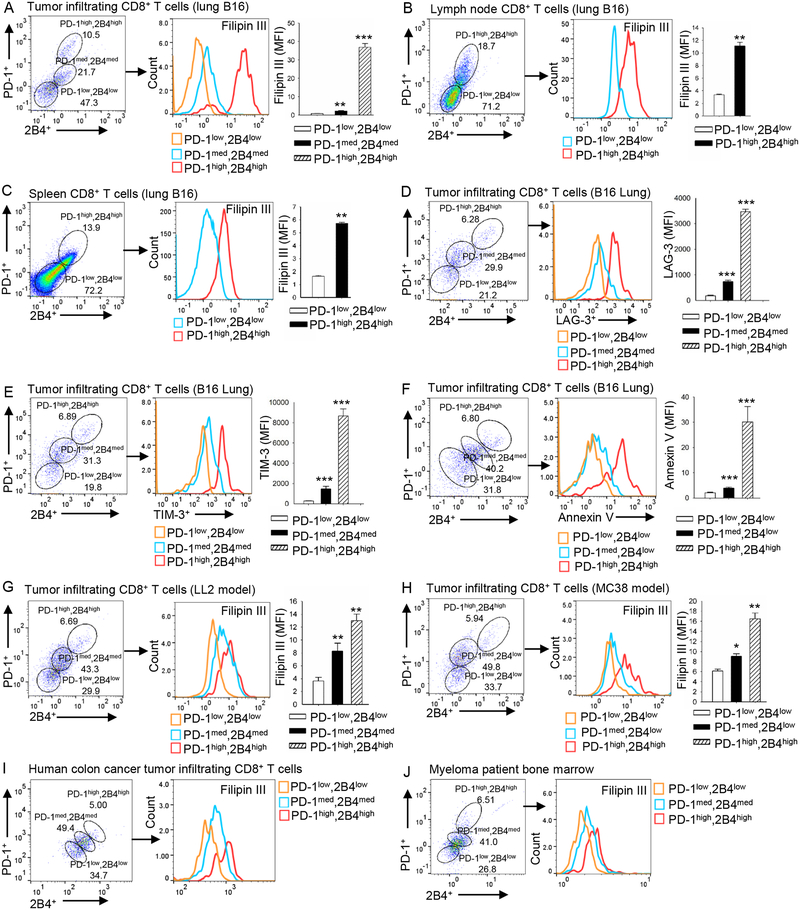
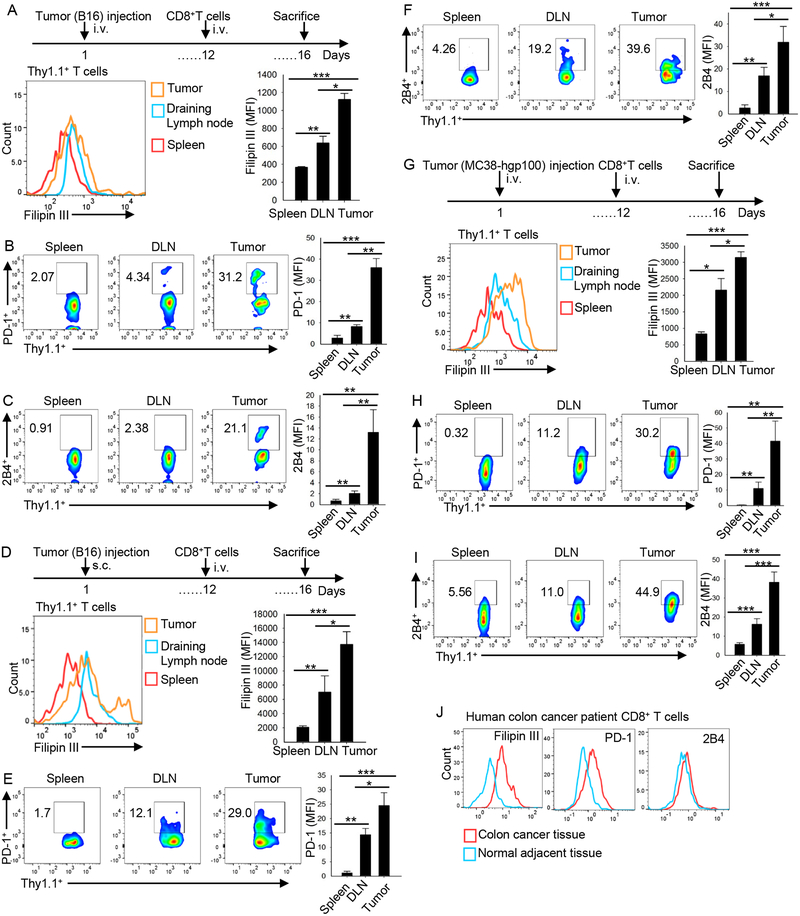
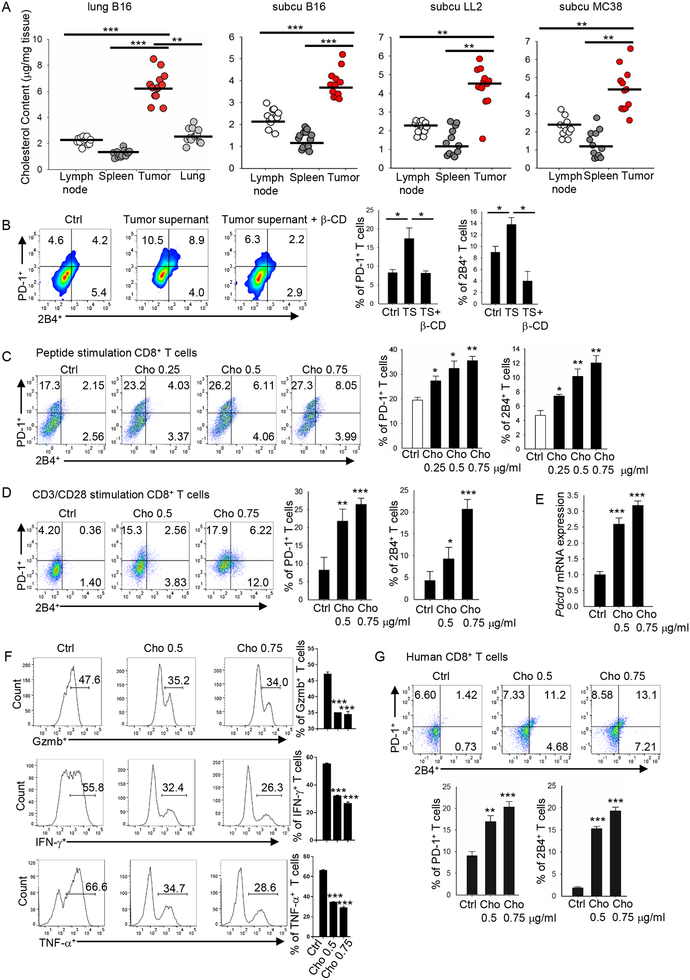
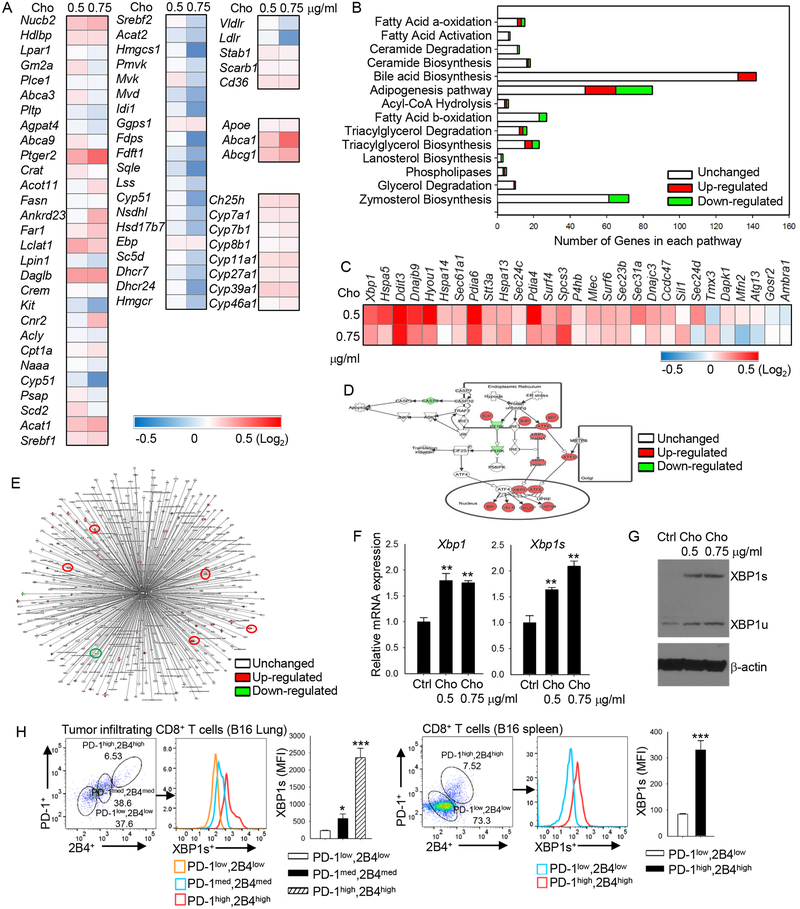
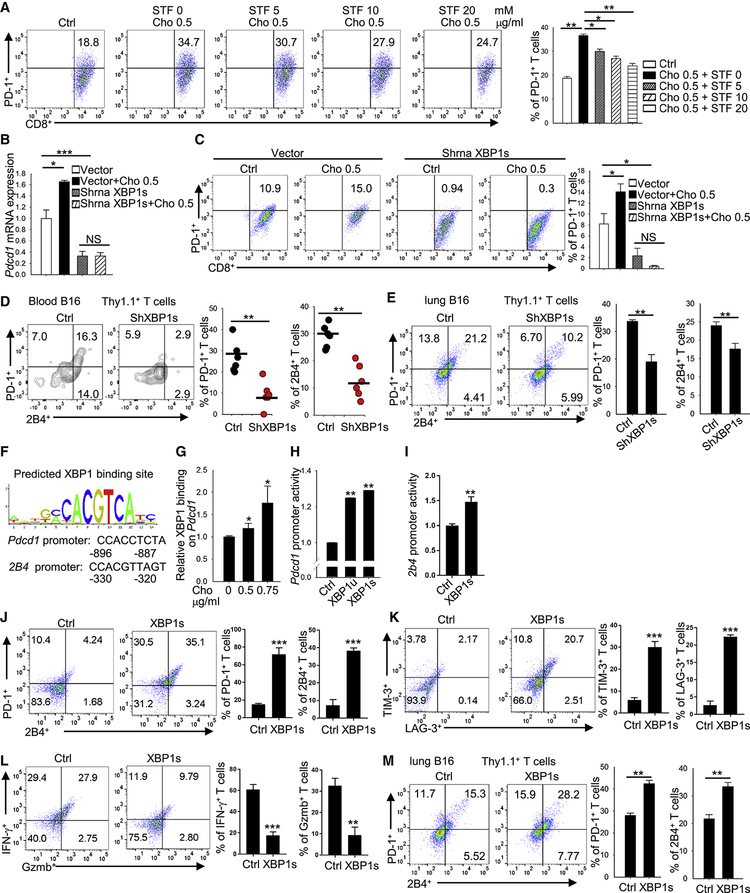
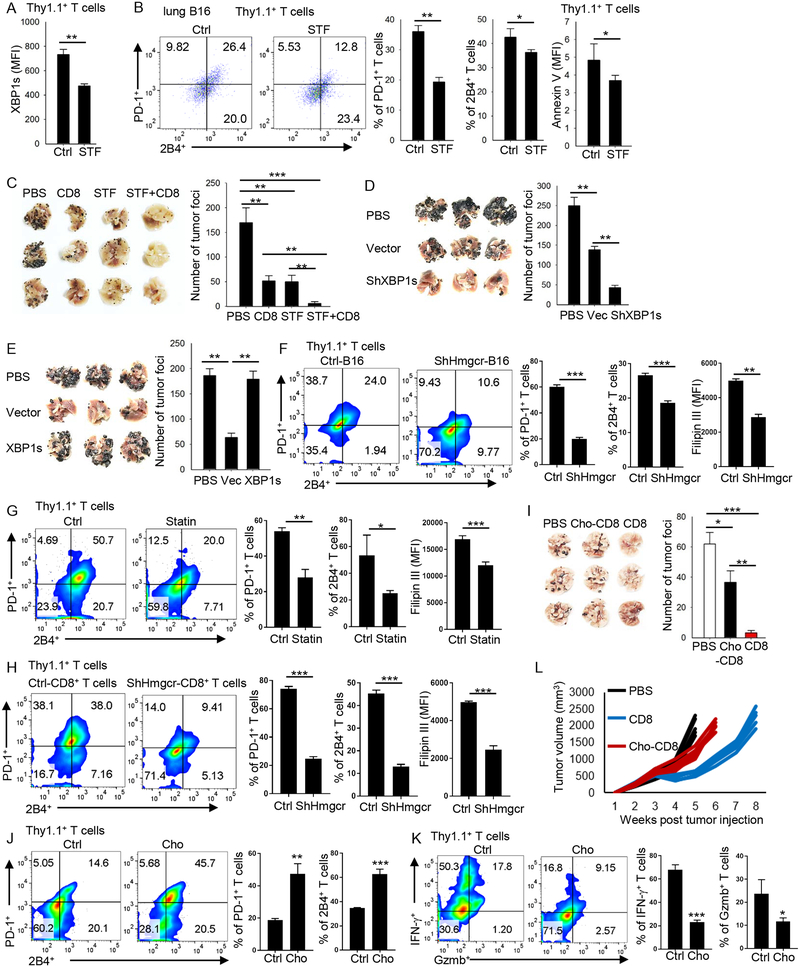
Tumor-infiltrating T cells often lose their effector function; however, the mechanisms are incompletely understood. We report that cholesterol in the tumor microenvironment induces CD8+ T cell expression of immune checkpoints and exhaustion. Tumor tissues enriched with cholesterol and cholesterol content in tumor-infiltrating CD8+ T cells were positively and progressively associated with upregulated T cell expression of PD-1, 2B4, TIM-3, and LAG-3. Adoptively transferred CD8+ T cells acquired cholesterol, expressed high levels of immune checkpoints, and became exhausted upon entering a tumor. Tumor culture supernatant or cholesterol induced immune checkpoint expression by increasing endoplasmic reticulum (ER) stress in CD8+ T cells. Consequently, the ER stress sensor XBP1 was activated and regulated PD-1 and 2B4 transcription. Inhibiting XBP1 or reducing cholesterol in CD8+ T cells effectively restored antitumor activity. This study reveals a mechanism underlying T cell exhaustion and suggests a new strategy for restoring T cell function by reducing cholesterol to enhance T cell-based immunotherapy.

Keywords: CD8+ T cells; cholesterol; exhaustion; immune checkpoints; tumor microenvironment.


Conflict of interest statement

DECLARATION OF INTERESTS

The authors have declared that no conflicts of interest exist.

Figures

Figure 1.
Figure 1.. The expression of CD8+ T-cell immune checkpoints is positively associated with increasing cholesterol accumulation
(A-C) B6 mice were injected i.v. with 1 × 10⁵ B16 cells. Tumor-infiltrating (A), lymph node (B) and spleen (C) CD8+ T cells were analyzed for PD-1 and 2B4 expression and for cholesterol content on day 16 after tumor transfer. (D-F) B6 mice were injected i.v. with 1 × 10⁵ B16 cells. Tumor-infiltrating CD8+ T cells were analyzed for the expression of PD-1, 2B4 and LAG-3 (D), TIM-3 (E), and annexin V (F) on day 16 after tumor transfer. (G and H) B6 mice were injected s.c. with 1 × 10⁶ LL2 cells (G) or 5× 10⁶ MC38 cells (H). Tumor-infiltrating CD8+ T cells were analyzed for PD-1 and 2B4 expression, and for cholesterol level on day 10 after tumor transfer. Experiments were performed with at least three biological replicates and are representative of at least three independent experiments. (I and J) Patient colon cancer (I) and myeloma (J) patient tumor-infiltrating CD8+ T cells were analyzed for PD-1 and 2B4 expression and cholesterol level. Data shown are for 1 representative patient each of 4 colon cancer patients (I) and 5 myeloma patients (J). Data are presented as mean ± SEM. *p < 0.05; **p < 0.01; ***p < 0.001.
Figure 2.
Figure 2.. CD8+ T-cell immune checkpoint expression and cholesterol accumulation are increased upon entry into the tumor microenvironment
Splenocytes from Pmel-1 mice were differentiated in vitro for 5 days in the presence of hgp10025–33 peptide (1 mg/ml) and IL-2 (10 ng/ml). (A-C) B6 mice were injected i.v. with 1 × 10⁵ B16 cells. At day 12 after tumor inoculation, 2 × 10⁶ CD8+ Pmel-1 T cells were i.v. transferred into the tumor-bearing mice. At day 16, Pmel-1 CD8+ T cells in tumor, draining lymph nodes (DLN), and spleen were analyzed for cholesterol level (A) and PD-1 (B) and 2B4 (C) expression. (D-F) B6 mice were injected s.c. with 1 × 10⁶ B16 cells. At day 12 after tumor inoculation, 2 × 10⁶ CD8+ Pmel-1 T cells were i.v. transferred into the tumor-bearing mice. At day 16, Pmel-1 CD8+ T cells in tumor, draining lymph nodes (DLN), and spleen were analyzed for cholesterol level (D) or PD-1 (E) and 2B4 (F) expression. (G-I) B6 mice were injected s.c. with 5 × 10⁶ MC38-hgp100 tumor cells. At day 12 after tumor inoculation, 2 × 10⁶ Pmel-1 CD8+ T cells were i.v. transferred into tumor-bearing mice. At day 16, CD8+ Pmel-1 T cells in tumor, draining lymph nodes (DLN), and spleen were analyzed for cholesterol level (G) or PD-1 (H) and 2B4 (I) expression. Experiments were performed with at least three biological replicates and are representative of at least two independent experiments. (J) Human colon cancer tissues and the adjacent normal tissues were analyzed for PD-1 and 2B4 expression and cholesterol level. Data shown are 1 representative patient of 2 colon cancer patients. Data are presented as mean ± SEM. *p < 0.05; **p < 0.01; ***p < 0.001.
Figure 3.
Figure 3.. Cholesterol within the tumor tissues induces CD8+ T-cell immune checkpoint expression
(A) Cholesterol content of tumor, spleen and lymph node was measured in four different tumor models: lung metastatic B16, s.c. grown B16, s.c. grown LL2, and s.c. grown MC38 tumor models. Experiments were performed with at least 10 biological replicates and are representative of at least 2 independent experiments. (B) Splenocytes from Pmel-1 mice were differentiated in vitro for 5 days in the presence of hgp10025–33 (1 mg/ml) and IL-2 (10 ng/ml). Tumor supernatant (1 mg tumor in 1 ml T-cell culture medium, filtered) was from s.c. grown B16 tumor. CD8+ T cells were cultured with control T-cell culture medium or with 100 ml tumor supernatant without or with β-cyclodextrin (β-CD, 0.5 mM) as indicated, and expression of PD-1 and 2B4 on the cultured T cells was determined. (C) Splenocytes from Pmel-1 mice were in vitro-differentiated for 5 days in the presence of hgp10025–33 (1 mg/ml) and IL-2 (10 ng/ml). Cholesterol was added to the cultures at the indicated concentrations. T-cell expression of PD-1 and 2B4 was determined 5 days later. (D) Pmel-1 CD8+ T cells were isolated and in vitro stimulated with CD3/CD28 antibodies in the presence of IL-2. Cholesterol was added to the cultures at the indicated concentrations. T-cell expression of PD-1 and 2B4 was examined on day 5. (E) Quantitative RT-PCR analysis of Pdcd1 expression in CD8+ T cells treated with cholesterol as indicated. (F) Pmel-1 CD8+ T cells were in vitro stimulated with CD3/CD28 antibodies in the presence of IL-2 and soluble CD3/CD28 antibodies. Cholesterol was added to the culture at indicated concentrations. T-cell production of Gzmb, IFN-γ, or TNF-α were examined on day 8 by flow. (G) Human CD8+ T cells were isolated from peripheral blood mononuclear cells and in vitro-stimulated with CD3/CD28 beads in the presence of IL-2. Cholesterol was added to the cultures at different concentrations as indicated. T-cell expression of PD-1 and 2B4 was examined on day 12. Experiments were performed with at least three biological replicates, and data shown are representative of at least three independent experiments. Data are presented as mean ± SEM. *p < 0.05; **p < 0.01; ***p < 0.001.
Figure 4.
Figure 4.. Cholesterol disrupts lipid metabolism and increases ER stress in CD8+ T cells
(A and B) Pmel-1 CD8+ T cells were isolated and stimulated in vitro with CD3/CD28 antibodies in the presence of IL-2. Cholesterol was added to the cultures at different concentrations as indicated at the top of the heat map in (A). Shown are microarray analysis (heat maps) of lipid metabolism-related gene expression (A) and IPA analysis (B) of lipid metabolism-related pathway changes in these CD8+ T cells. (C-E) CD8+ T cells were isolated and in vitro-stimulated with CD3/CD28 antibodies in the presence of IL-2 and cholesterol at the indicated concentrations. Shown are microarray analysis (heat map) of ER stress-related gene expression in these CD8+ T cells (C); IPA analysis of ER stress-signaling pathway in CD8+ treated without or with 0.75 μg/ml cholesterol (D); and IPA analysis of Xbp1-related interaction gene expression (E). In E, red circles indicate ER-stress signaling genes. Data are representative of at least 2 independent experiments. (F) Quantitative RT-PCR analysis of Xbp1 and Xbp1s expression in in vitro-differentiated CD8+ T cells with indicated cholesterol treatments. (G) Western blot analysis of XBP1s and XBP1u expression in in vitro-differentiated CD8+ T cells with indicated cholesterol treatments. (H) Flow cytometry analysis of PD-1, 2B4 and XBP1s expression in lung B16 tumor-infiltrating and spleen CD8+ T cells. Experiments were performed with at least three biological replicates, and data shown are representative of at least two independent experiments. Data are presented as mean ± SEM. *p < 0.05; **p < 0.01; ***p < 0.001.
Figure 5.
Figure 5.. Expression of the cholesterol-induced ER-stress sensor XBP1 is required for CD8+ T-cell immune checkpoint expression
(A) Flow cytometry analysis of PD-1 expression on in vitro differentiated CD8+ T cells treated with cholesterol or the ER stress inhibitor, STF (STF-083010). (B and C) Quantitative RT-PCR (B) and flow cytometry (C) analysis of PD-1 expression on in vitro-differentiated CD8+ T cells treated with cholesterol or shRNA transfection to knock down XBP1s. Control shRNA was used as vector control. Experiments were performed with at least three biological replicates and are representative of at least three independent experiments. (D and E) In vitro-differentiated Pmel-1-derived CD8+ T cells were transfected with XBP1s shRNA and then injected i.v. into 10-day lung B16 tumor-bearing mice. One week later, blood (D) and lung tumor (E) were collected and examined for PD-1 and 2B4 expression on transferred Pmel-1 CD8+ T cells. Pmel-1 CD8+ T cells treated with control shRNA was used as control. (F) Predicted binding sites of XBP1 on the Pdcd1 and 2b4 promoters. (G) ChIP analysis of XBP1 binding to the Pdcd1 promoter under indicated cholesterol treatments. (H) Dual luciferase analysis of the impact of XBP1 and XBP1s overexpression on the Pdcd1 promoter in 293T cells. (I) Dual luciferase analysis of the impact of XBP1s overexpression on the CD244 promoter in 293T cells. (J-L) In vitro-differentiated Pmel-1-derived CD8+ T cells were transfected with XBP1s virus to overexpress XBP1s. Cells were cultured in the presence of soluble CD3/CD28 antibodies and IL-2. T-cell expression of PD-1, 2B4, TIM-3, and LAG-3, and production of Gzmb and IFN-γ were examined on day 8 by flow. (M) In vitro-differentiated Pmel-1-derived CD8+ T cells were transfected with XBP1s virus to overexpress XBP1s and then injected i.v. into lung B16 tumor-bearing mice. One week later, lung tumor was collected, and the expression of PD-1 and 2B4 expression on transferred CD8+ T cells was examined. Pmel-1 CD8+ T cells treated with control virus was used as control. Experiments were performed with at least three biological replicates, and data shown are representative of at least two independent experiments. Data are presented as mean ± SEM. *p < 0.05; **p < 0.01; ***p < 0.001.
Figure 6.
Figure 6.. Inhibiting XBP1 or reducing cholesterol enhances the antitumor activity of CD8+ T cells in vivo
(A-B) CD8+ T cells from Pmel-1 mice were transferred into 10-day lung B16 tumor-bearing mice. STF-083010 (60 mg/kg) was injected intraperitoneally 1 day after CD8+ T-cell transfer. DMSO was used as control (Ctrl). One week later, lung tumor was collected and the expression of XBP1s (A) and PD-1, 2B4 or annexin-V (B) in transferred CD8+ T cells was examined by flow cytometry. (C) CD8+ T cells from Pmel-1 mice were transferred into B16 tumor-bearing mice as indicated. STF-083010 (30 mg/kg) was injected intraperitoneally once a week for 2 weeks. After 16 days, tumor foci in the lung were counted. (D and E) CD8+ T cells from Pmel-1 mice, treated with XBP1 shRNA to knockdown XBP1 (D), or with XBP1 virus to overexpress XBP1 (E), were transferred into 2-day lung B16 tumor-bearing mice. Two weeks later, tumorfoci in the lung were counted. (F) B16 cells were transfected with ctrl or Hmgcr shRNA and then injected s.c. into B6 mice. In vitro-differentiated Pmel-1-derived CD8+ T cells were injected into ctrl or shHmgcr B16-bearing mice. One week later tumors were collected and PD-1 and 2B4 expression and cholesterol content of tumor-infiltrating Pmel-1 CD8+ T cells were examined. (G) One dose of simvastatin (1 mg; 50 mg/kg body weight) was directly injected into 10-day large established B16 tumor. Three days later, in vitro-differentiated Pmel-1-derived CD8+ T cellswere injected into ctrl or simvastatin-treated B16-bearing mice. One week later tumors were collected and PD-1 and 2B4 expression and cholesterol content of tumor-infiltrating Pmel-1 CD8+ T cells were examined. (H) In vitro-differentiated Pmel-1-derived CD8+ T cells were transfected with Hmgcr shRNA and then injected i.v. into 10-day B16-bearing mice. One week later tumors were collected and PD-1 and 2B4 expression and cholesterol content of tumor-infiltrating Pmel-1 CD8+ T cells were examined. (I) In vitro-differentiated Pmel-1-derived CD8+ T cells were cultured in standard T-cell culture medium or treated with 0.5 mg/ml cholesterol for 5 days. On day 5, the T cells were transferred into 2-day lung B16 tumor-bearing mice. After 2 weeks, tumor foci in the lung were counted. (J and K) In vitro-differentiated Pmel-1-derived CD8+ T cells were cultured in standard T-cell culture medium or treated with 0.5 mg/ml cholesterol for 5 days. On day 5, T cells were transferred into 10-day subcutaneous B16 tumor-bearing mice. Ten days later, transferred, tumor-infiltrating T cells were examined for the expression of PD-1 and 2B4, and the production of Gzmb and IFN-γ by flow. (L) Tumor growth of subcutaneous B16-bearing mice treated with control T cells or cholesterol-treated CD8+ T cells. Experiments were performed with at least three biological replicates and data shown are representative of at least two independent experiments. Data are presented as mean ± SEM. *p < 0.05; **p < 0.01; ***p < 0.001.

Comment in

References

    1. Anderson AC, Lord GM, Dardalhon V, Lee DH, Sabatos-Peyton CA, Glimcher LH, and Kuchroo VK (2010). T-bet, a Th1 transcription factor regulates the expression of Tim-3. Eur J Immunol 40, 859–866. - PMC - PubMed
    1. Angelin A, Gil-de-Gomez L, Dahiya S, Jiao J, Guo L, Levine MH, Wang Z, Quinn WJ 3rd, Kopinski PK, Wang L, et al. (2017). Foxp3 Reprograms T Cell Metabolism to Function in Low-Glucose, High-Lactate Environments. Cell Metab 25, 1282–1293 e1287. - PMC - PubMed
    1. Austin JW, Lu P, Majumder P, Ahmed R, and Boss JM (2014). STAT3, STAT4, NFATc1, and CTCF regulate PD-1 through multiple novel regulatory regions in murine T cells. J Immunol 192, 4876–4886. - PMC - PubMed
    1. Baek AE, Yu YA, He S, Wardell SE, Chang CY, Kwon S, Pillai RV, McDowell HB, Thompson JW, Dubois LG, et al. (2017). The cholesterol metabolite 27 hydroxycholesterol facilitates breast cancer metastasis through its actions on immune cells. Nat Commun 8, 864. - PMC - PubMed
    1. Bally AP, Austin JW, and Boss JM (2016). Genetic and Epigenetic Regulation of PD-1 Expression. J Immunol 196, 2431–2437. - PMC - PubMed

Publication types