. 2019 May 14;12(5):1159-1177.
doi: 10.1016/j.stemcr.2019.04.001. Epub 2019 Apr 25.

RNA Profiling of the Human and Mouse Spinal Cord Stem Cell Niches Reveals an Embryonic-like Regionalization with MSX1+ Roof-Plate-Derived Cells

Affiliations

RNA Profiling of the Human and Mouse Spinal Cord Stem Cell Niches Reveals an Embryonic-like Regionalization with MSX1+ Roof-Plate-Derived Cells

Hussein Ghazale et al. Stem Cell Reports. .

Abstract

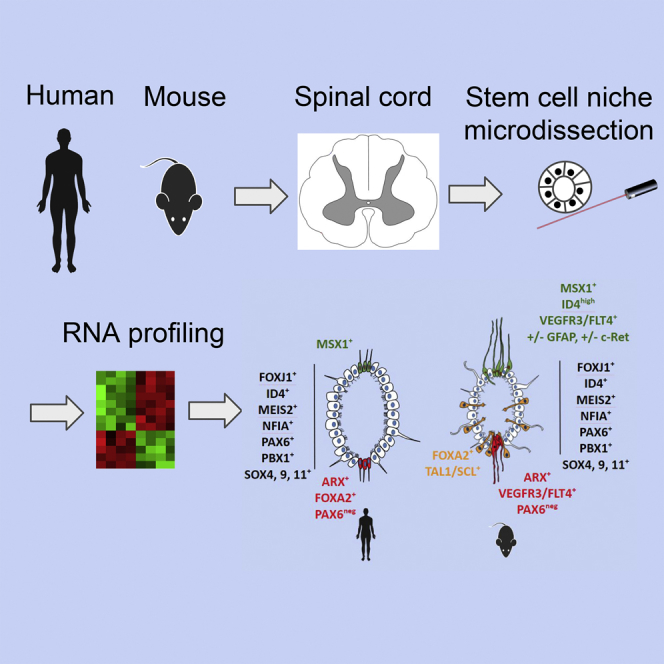
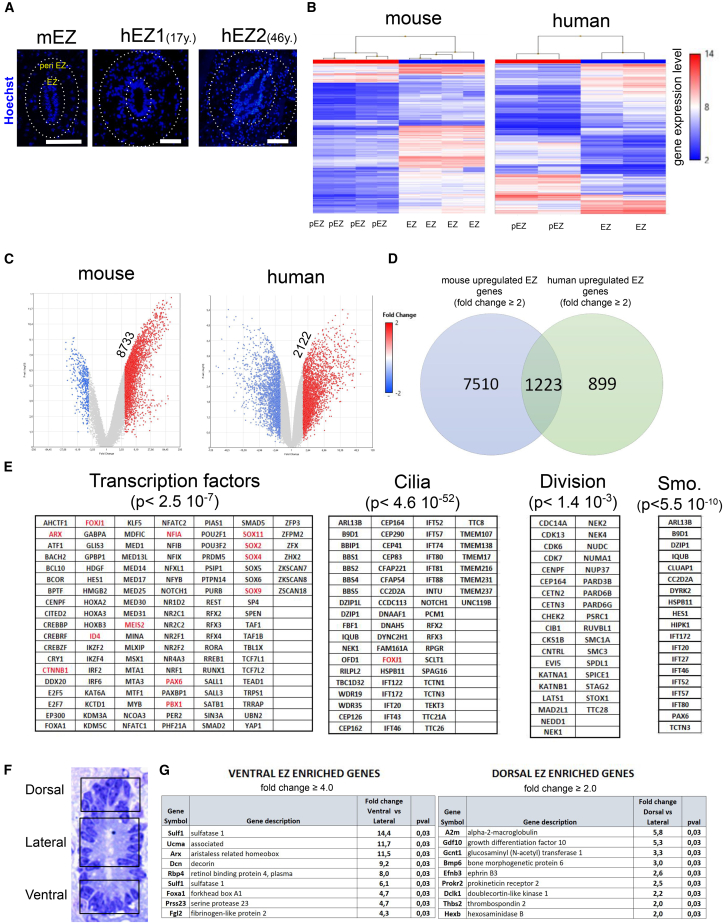
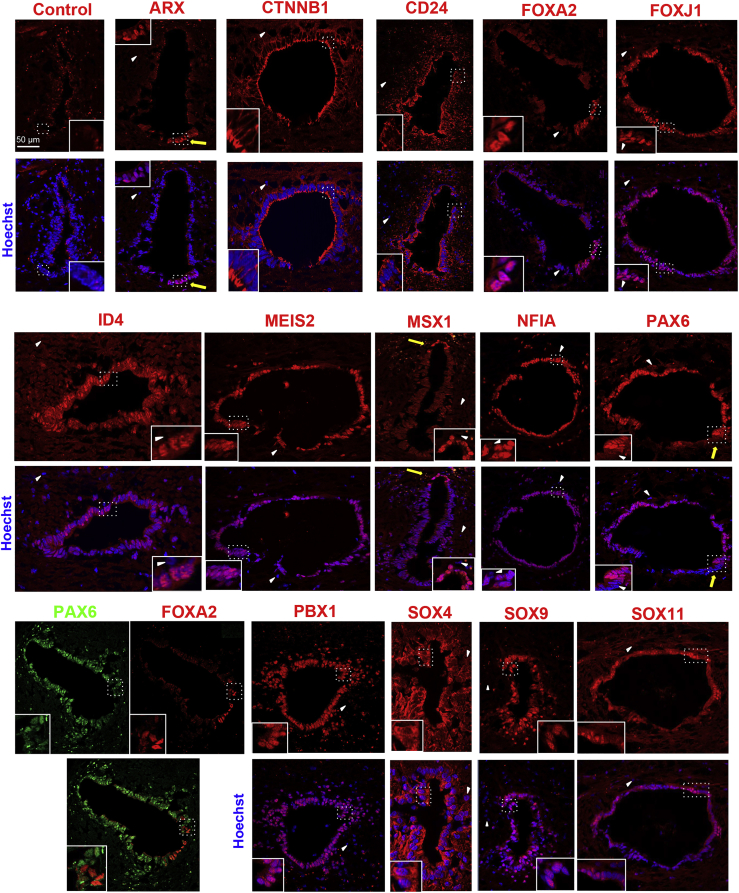
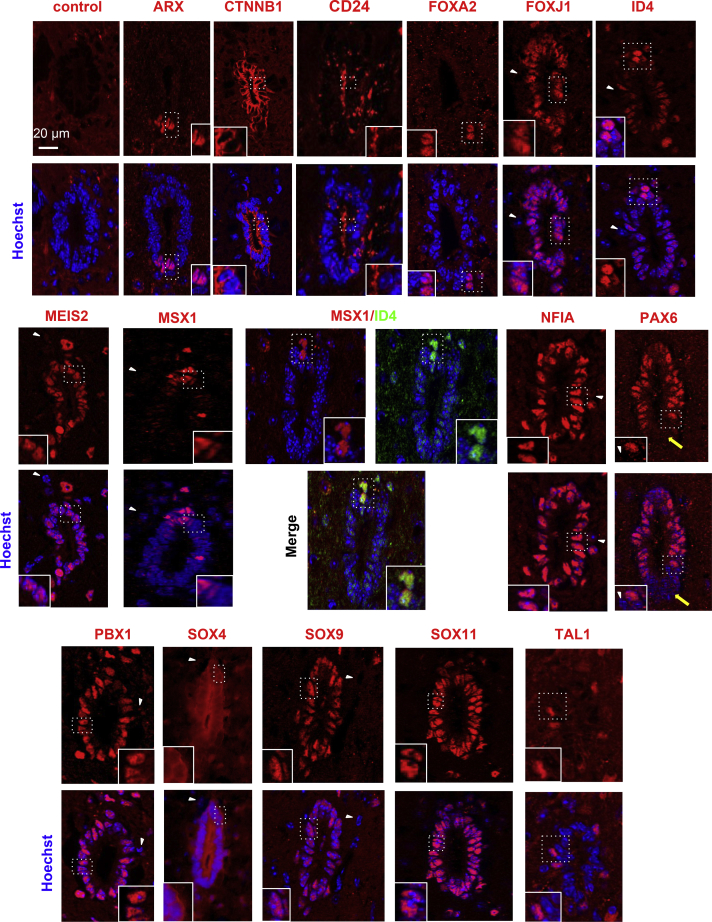
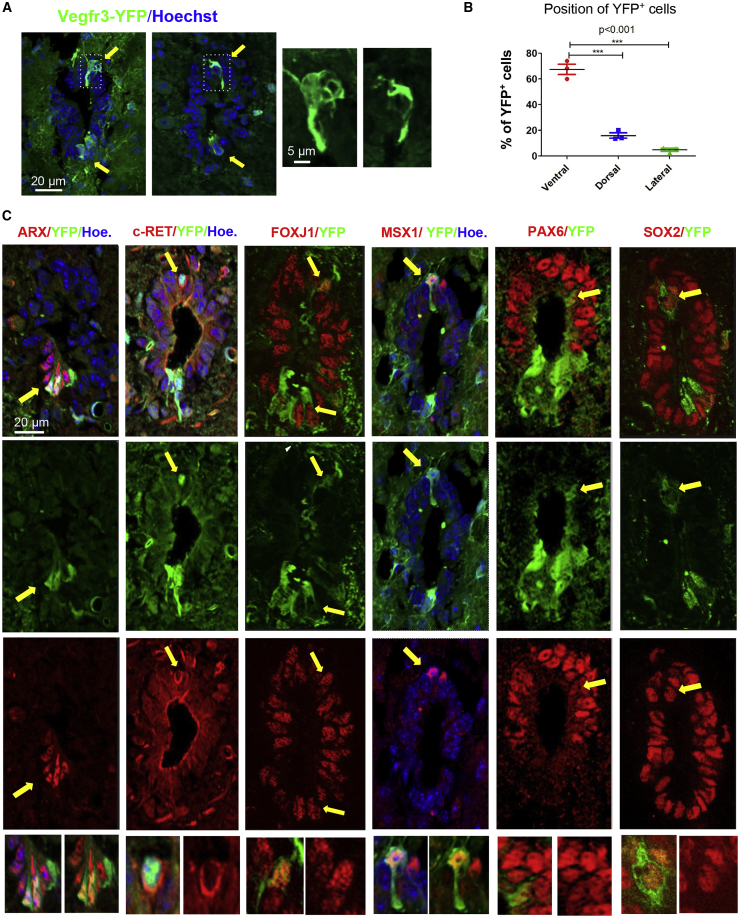
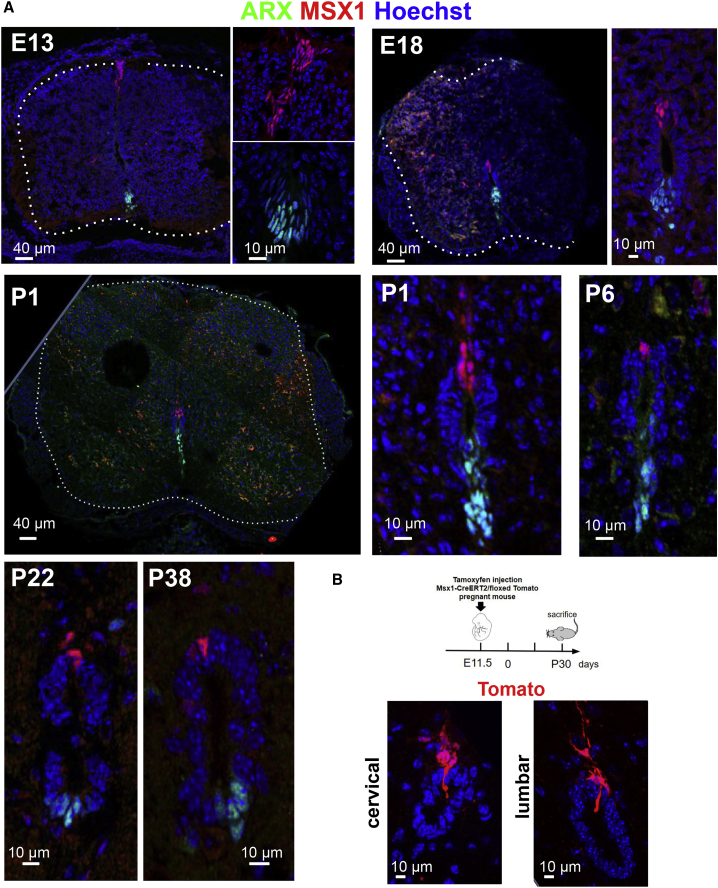
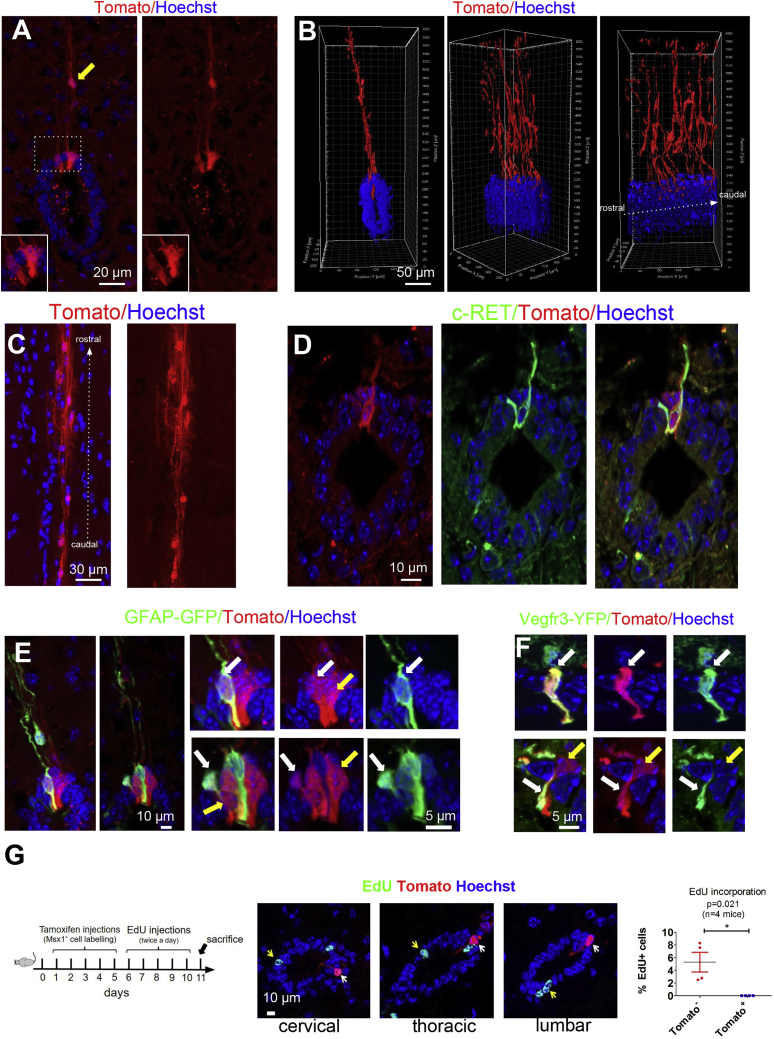
Anamniotes, rodents, and young humans maintain neural stem cells in the ependymal zone (EZ) around the central canal of the spinal cord, representing a possible endogenous source for repair in mammalian lesions. Cell diversity and genes specific for this region are ill defined. A cellular and molecular resource is provided here for the mouse and human EZ based on RNA profiling, immunostaining, and fluorescent transgenic mice. This uncovered the conserved expression of 1,200 genes including 120 transcription factors. Unexpectedly the EZ maintains an embryonic-like dorsal-ventral pattern of expression of spinal cord developmental transcription factors (ARX, FOXA2, MSX1, and PAX6). In mice, dorsal and ventral EZ cells express Vegfr3 and are derived from the embryonic roof and floor plates. The dorsal EZ expresses a high level of Bmp6 and Gdf10 genes and harbors a subpopulation of radial quiescent cells expressing MSX1 and ID4 transcription factors.

Keywords: Msx1; ependyma; ependymal cells; floor plate; neural stem cells; niche; radial glial cells; regionalization; roof plate; spinal cord; transcription factors.


Figures

None
Graphical abstract
Figure 1
Figure 1
RNA Profiles of the Mouse and Human EZ (A) Aspect of EZ in the mouse (mEZ, thoraco level) and human samples (hEZ1 and hEZ2, thoracolumbar level). A lumen was present in mice and in the two human (aged 17 and 46 years) samples. Microdissected EZ and peri EZ regions are delimited with dotted circles. Scale bars, 100 μm. (B) Heatmap of hierarchical clustering of genes expressed in EZ and peri EZ (pEZ) regions in the four mouse and two human samples. (C) Volcano plots of genes whose expression is enriched in the mouse and human EZ (fold change ≥2). (D) Venn diagram of genes enriched in the mouse and human EZ. (E) Genes enriched for ciliogenesis, smoothened pathway (Smo.), division, and transcription factors in the mouse and human EZ. Expression of genes in red was subsequently confirmed at the protein level (Figures 2 and 3). (F) Microdissected subregions of the mouse EZ. (G) Genes enriched (top 9) in the ventral and dorsal EZ (full lists are in Table S5).
Figure 2
Figure 2
Human EZ Characterization IF of the indicated proteins in the human EZ (patient aged 17 years). White arrowheads show negative cells indicative of the staining specificity. Yellow arrows show ventral ARX+ cells, dorsal MSX1+ cells, and ventral PAX6 cells. Note that SOX4 is mostly cytoplasmic. Images are oriented with ventral part at bottom. Labelings were performed at the thoracic (control, ARX, CD24, FOXA2, MSX1, SOX4, SOX9) or lumbar level (CTNNB1, FOXJ1, ID4, MEIS2, NFIA, PAX6, PBX1, SOX11). These images are representative of at least eight sections. Scale bar, 50 μm (applies to all images).
Figure 3
Figure 3
Mouse EZ Characterization IF for the indicated proteins in the adult mouse EZ (lumbar level). Images are oriented with ventral part at bottom. The yellow arrows on PAX6 staining show negative cells in the ventral part. Note the higher expression of ID4 in cells localized in the dorsal part, which also express MSX1. FOXA2+ and TAL1+ cells are localized in a subependymal position and express PKD2L1 a marker specific for CSF-N (Figure S2). Note that SOX4 is mostly cytoplasmic. These images are representative of ten sections per animal, n = 4 mice analyzed. Scale bar, 20 μm (applies to all images).
Figure 4
Figure 4
EZ in Vegfr3-YFP Mice (A) Representative images of the spinal cord EZ (lumbar level) in Vegfr3-YFP mice (IF anti-GFP). Images are oriented with ventral part at bottom. YFP+ cells are mainly present in the dorsal and ventral regions (yellow arrows). Boxed areas show dorsal cells sending a process toward the lumen. These images are representative of at least 20 sections per animal (n = 3 mice analyzed). Ventral YFP+ cells are present in >95% of sections whereas dorsal YFP+ cells are present in approximately 25% of examined sections. (B) Quantification of YFP+ cells in the lumbar EZ (187 YFP+ cells counted) indicated a preferential ventral and dorsal localization. One-way ANOVA + Tukey’s post test (n = 3 mice). (C) Phenotypic characterization of YFP+ cells with indicated protein (images are representative of 20 sections, n = 3 mice). Yellow arrows show double-positive cells. Images at the bottom are high magnification of arrow-pointed areas. Hoe., Hoechst. Scale bar, 20 μm (applies to all images).
Figure 5
Figure 5
MSX1 and ARX Expression in the Developing Spinal Cord (A) IF for MSX1 and ARX during spinal cord embryonic development (E13 and E18) and postnatal stages (P1, P6, P22, P38). All images are oriented with ventral part at bottom. Images are representative of ten sections (n = 2 embryos and pups analyzed per stage). (B) Representative images (n = 20 sections each levels, two mice) of the EZ of a P30 Msx1-CreERT2/Rosa-Tomato mouse derived from an embryo subjected to tamoxifen at E11.5.
Figure 6
Figure 6
Characterization of Dorsal MSX1+ Cells (A) Radial morphology of MSX1+ cells observed in Msx1-CreERT2/Rosa-Tomato mice. Yellow arrow shows rare radial Tomato+ cells outside EZ. Images are oriented with ventral part at bottom. (B) 3D reconstruction of Tomato+ cells (coronal, intermediate, and lateral views). (C) Dorsal view of the dorsal EZ region showing rostral-caudal oriented Tomato+ processes. (D) Expression of c-RET receptor in Tomato+ cells (n = 10 sections). (E and F) Representative images (n = 20 sections, two mice) of the EZ in double transgenic hGFAP-GFP/Msx1-CreERT2/Rosa-Tomato (E) and Vegfr3-YFP/Msx1-CreERT2/Rosa-Tomato (F) mice. White arrows indicate double-positive cells and yellow arrows Tomato+-only cells. (G) EdU incorporation (5 days) in the EZ. Images show EdU+ cells (yellow arrows) not positive for Tomato (white arrows) in Msx1-CreERT2/Rosa-Tomato mouse sections. Quantifications are provided on right-hand graph (112 spinal cord sections, 5,120 cells examined, unpaired t test, n = 4 mice).

Similar articles

Cited by

References

    1. Adrian E.K., Jr., Walker B.E. Incorporation of thymidine-H3 by cells in normal and injured mouse spinal cord. J. Neuropathol. Exp. Neurol. 1962;21:597–609. - PubMed
    1. Alfaro-Cervello C., Soriano-Navarro M., Mirzadeh Z., Alvarez-Buylla A., Garcia-Verdugo J.M. Biciliated ependymal cell proliferation contributes to spinal cord growth. J. Comp. Neurol. 2012;520:3528–3552. - PMC - PubMed
    1. Alvarez-Buylla A., Ihrie R.A. Sonic hedgehog signaling in the postnatal brain. Semin. Cell Dev. Biol. 2014;33:105–111. - PMC - PubMed
    1. Barnabé-Heider F., Göritz C., Sabelström H., Takebayashi H., Pfrieger F.W., Meletis K., Frisén J. Origin of new glial cells in intact and injured adult spinal cord. Cell Stem Cell. 2010;7:470–482. - PubMed
    1. Bauchet L., Lonjon N., Vachiery-Lahaye F., Boularan A., Privat A., Hugnot J.-P. Isolation and culture of precursor cells from the adult human spinal cord. Methods Mol. Biol. 2013;1059:87–93. - PubMed

Publication types

MeSH terms