

Shared Multidrug Resistance Patterns in Chicken-Associated Escherichia coli Identified by Association Rule Mining
- PMID: 31031716
- PMCID: PMC6473086
- DOI: 10.3389/fmicb.2019.00687
Shared Multidrug Resistance Patterns in Chicken-Associated Escherichia coli Identified by Association Rule Mining
Erratum in
-
Corrigendum: Shared Multidrug Resistance Patterns in Chicken-Associated Escherichia coli Identified by Association Rule Mining.Front Microbiol. 2020 Jun 30;11:1359. doi: 10.3389/fmicb.2020.01359. eCollection 2020. Front Microbiol. 2020. PMID: 32714298 Free PMC article.
Abstract
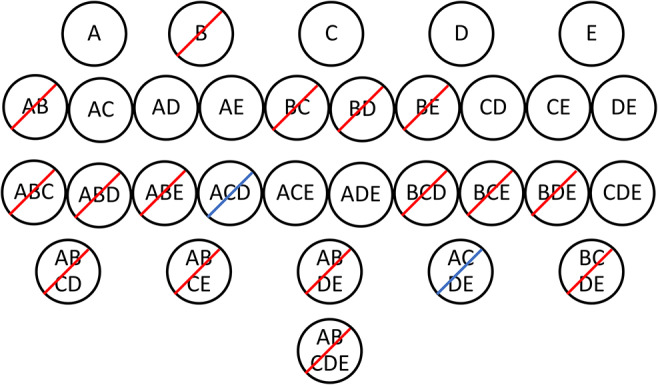
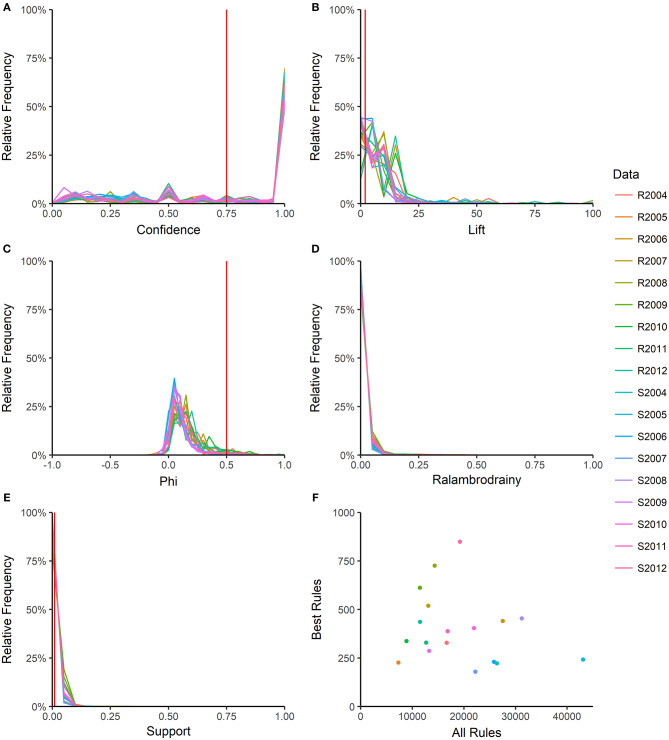
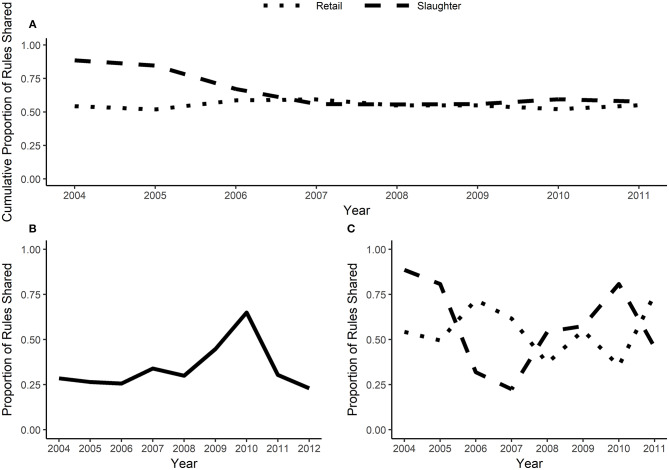
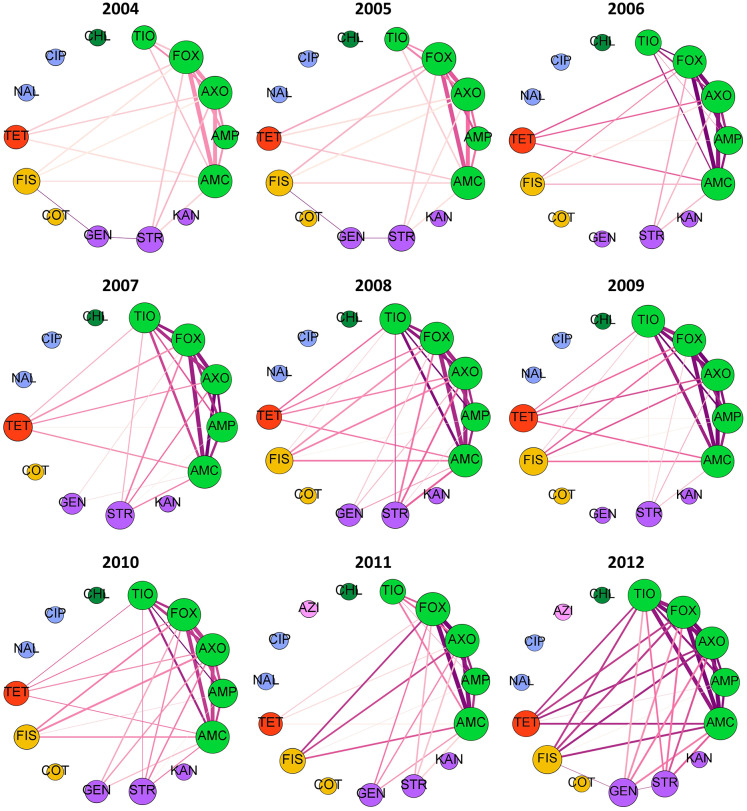
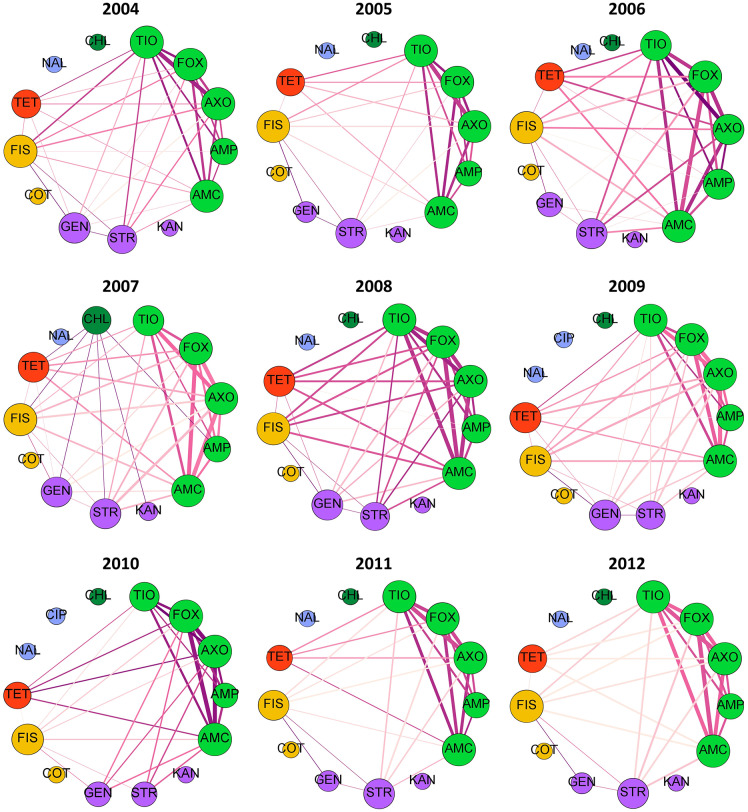
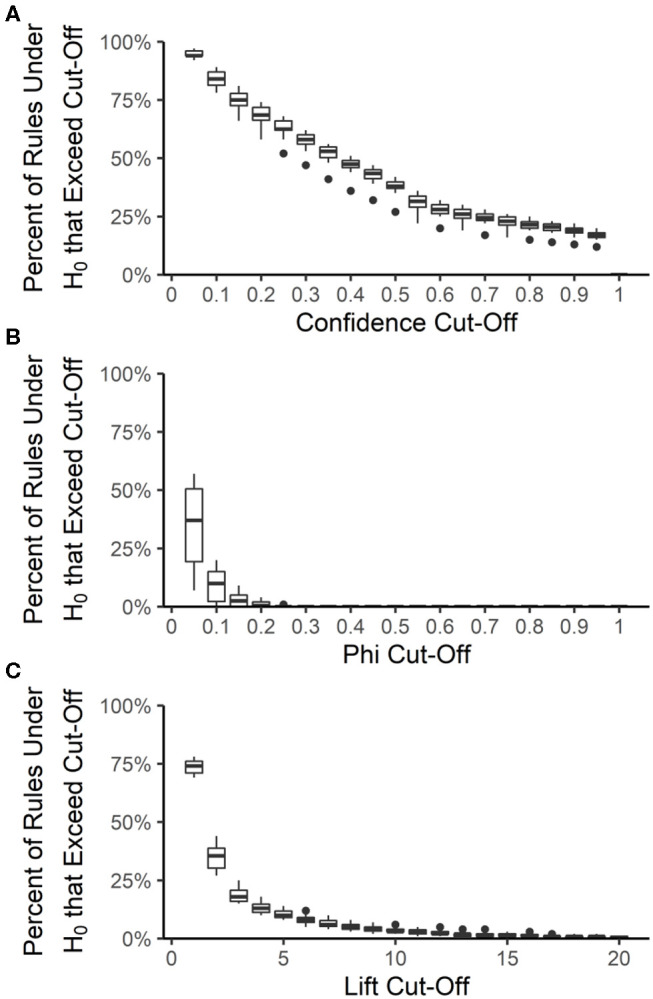
Using multiple antimicrobials in food animals may incubate genetically-linked multidrug-resistance (MDR) in enteric bacteria, which can contaminate meat at slaughter. The U.S. National Antimicrobial Resistance Monitoring System tested 21,243 chicken-associated Escherichia coli between 2004 and 2012 for resistance to 15 antimicrobials, resulting in >32,000 possible MDR patterns. We analyzed MDR patterns in this dataset with association rule mining, also called market-basket analysis. The association rules were pruned with four quality measures resulting in a <1% false-discovery rate. MDR rules were more stable across consecutive years than between slaughter and retail. Rules were decomposed into networks with antimicrobials as nodes and rules as edges. A strong subnetwork of beta-lactam resistance existed in each year and the beta-lactam resistances also had strong associations with sulfisoxazole, gentamicin, streptomycin and tetracycline resistances. The association rules concur with previously identified E. coli resistance patterns but provide significant flexibility for studying MDR in large datasets.
Keywords: Escherichia coli; antimicrobial resistance; association rule mining; foodborne bacteria; machine learning; multidrug resistance.
Figures
Similar articles
-
Comparison of annual and regional variation in multidrug resistance using various classification metrics for generic Escherichia coli isolated from chicken abattoir surveillance samples in Canada.Prev Vet Med. 2018 Jun 1;154:9-17. doi: 10.1016/j.prevetmed.2018.03.010. Epub 2018 Mar 16. Prev Vet Med. 2018. PMID: 29685448
-
Corrigendum: Shared Multidrug Resistance Patterns in Chicken-Associated Escherichia coli Identified by Association Rule Mining.Front Microbiol. 2020 Jun 30;11:1359. doi: 10.3389/fmicb.2020.01359. eCollection 2020. Front Microbiol. 2020. PMID: 32714298 Free PMC article.
-
Isolation and molecular characterization of multidrug-resistant strains of Escherichia coli and Salmonella from retail chicken meat in Japan.J Food Sci. 2009 Sep;74(7):M405-10. doi: 10.1111/j.1750-3841.2009.01291.x. J Food Sci. 2009. PMID: 19895488
-
Antimicrobial resistance in fecal Escherichia coli and Salmonella enterica isolates: a two-year prospective study of small poultry flocks in Ontario, Canada.BMC Vet Res. 2019 Dec 21;15(1):464. doi: 10.1186/s12917-019-2187-z. BMC Vet Res. 2019. PMID: 31864357 Free PMC article.
-
Multidrug-resistant pathogens in the food supply.Foodborne Pathog Dis. 2015 Apr;12(4):261-79. doi: 10.1089/fpd.2014.1865. Epub 2015 Jan 26. Foodborne Pathog Dis. 2015. PMID: 25621383 Review.
Cited by
-
Virulence-associated genes analysis of carbapenemase-producing Escherichia coli isolates.PLoS One. 2022 May 10;17(5):e0266787. doi: 10.1371/journal.pone.0266787. eCollection 2022. PLoS One. 2022. PMID: 35536848 Free PMC article.
-
Machine Learning for Antimicrobial Resistance Prediction: Current Practice, Limitations, and Clinical Perspective.Clin Microbiol Rev. 2022 Sep 21;35(3):e0017921. doi: 10.1128/cmr.00179-21. Epub 2022 May 25. Clin Microbiol Rev. 2022. PMID: 35612324 Free PMC article. Review.
-
Using GWAS and Machine Learning to Identify and Predict Genetic Variants Associated with Foodborne Bacteria Phenotypic Traits.Methods Mol Biol. 2025;2852:223-253. doi: 10.1007/978-1-0716-4100-2_16. Methods Mol Biol. 2025. PMID: 39235748 Review.
-
Analysis of Multidrug Resistance in Staphylococcus aureus with a Machine Learning-Generated Antibiogram.Antimicrob Agents Chemother. 2021 Mar 18;65(4):e02132-20. doi: 10.1128/AAC.02132-20. Print 2021 Mar 18. Antimicrob Agents Chemother. 2021. PMID: 33431415 Free PMC article.
-
Associations between antimicrobial resistance in fecal Escherichia coli isolates and antimicrobial use in Canadian turkey flocks.Front Microbiol. 2022 Jul 29;13:954123. doi: 10.3389/fmicb.2022.954123. eCollection 2022. Front Microbiol. 2022. PMID: 35966666 Free PMC article.
References
-
- Agrawal R., Imielinski T., Swami A. (1993). Mining Association Rules Between Sets of Items in Large Databases. ACM SIGMOD Record. ACM. 10.1145/170035.170072 - DOI
-
- Bastian M., Heymann S., Jacomy M. (2009). Gephi: An Open Source Software for Exploring and Manipulating Networks, in International AAAI Conference on Weblogs and Social Media. (San Jose, CA: AAAI; ). Available online at: https://www.aaai.org/ocs/index.php/ICWSM/09/paper/view/154 (accessed September 3, 2018).
-
- Centers for Disease Control Prevention Reports of E.coli Outbreak Investigations from 2010. (2015). [Online]. Available online at: https://www.cdc.gov/ecoli/2010-outbreaks.html (accessed February 28, 2019).
Grants and funding
LinkOut - more resources
Full Text Sources