. 2019 Apr 12:10:757.
doi: 10.3389/fimmu.2019.00757. eCollection 2019.

Tumor-Stroma-Inflammation Networks Promote Pro-metastatic Chemokines and Aggressiveness Characteristics in Triple-Negative Breast Cancer

Affiliations

Tumor-Stroma-Inflammation Networks Promote Pro-metastatic Chemokines and Aggressiveness Characteristics in Triple-Negative Breast Cancer

Yulia Liubomirski et al. Front Immunol. .

Abstract

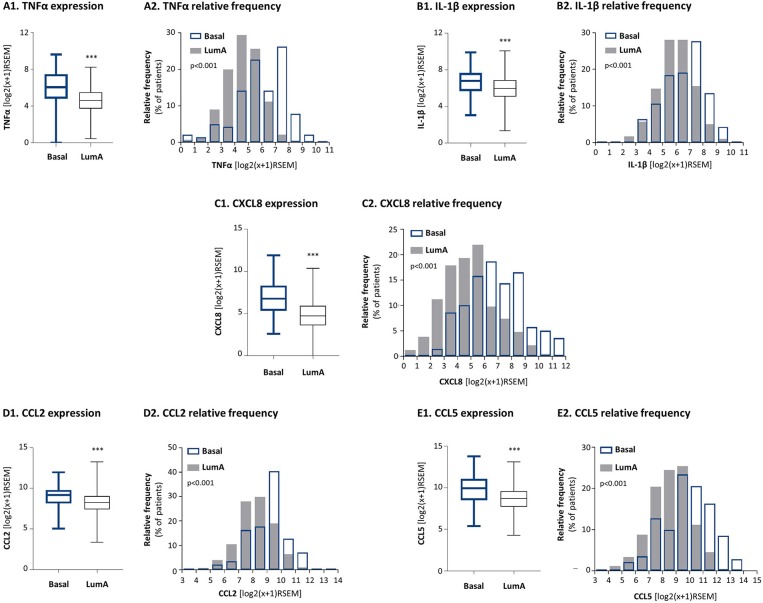
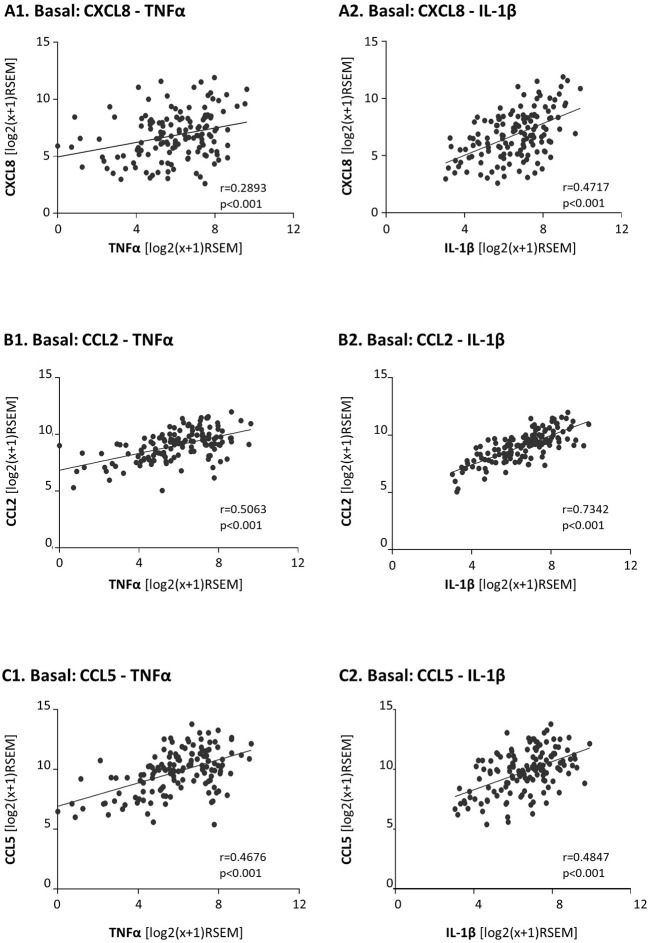
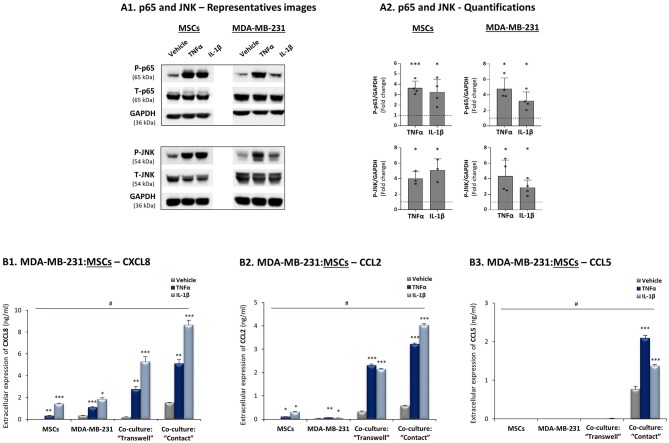
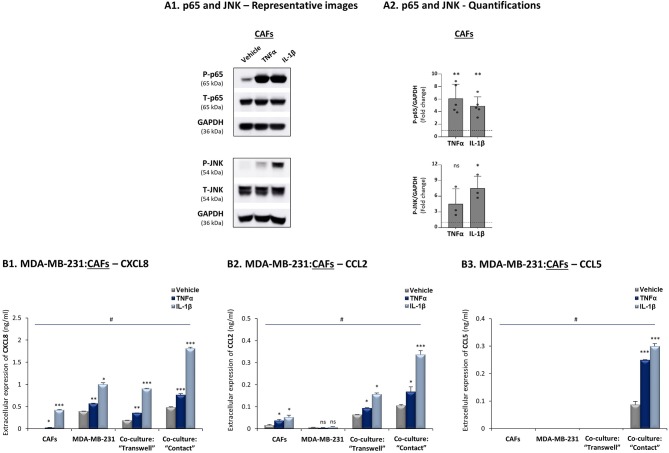
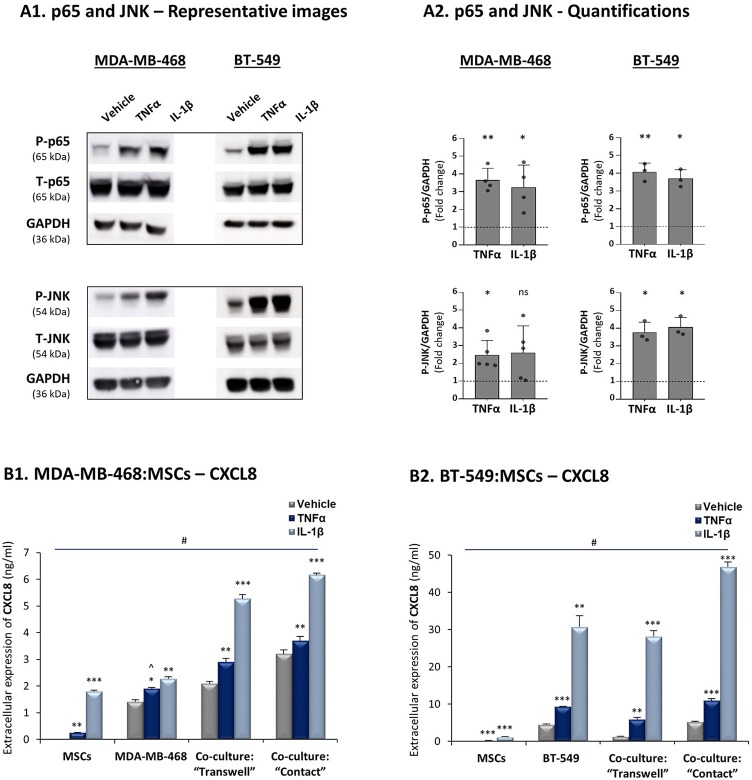
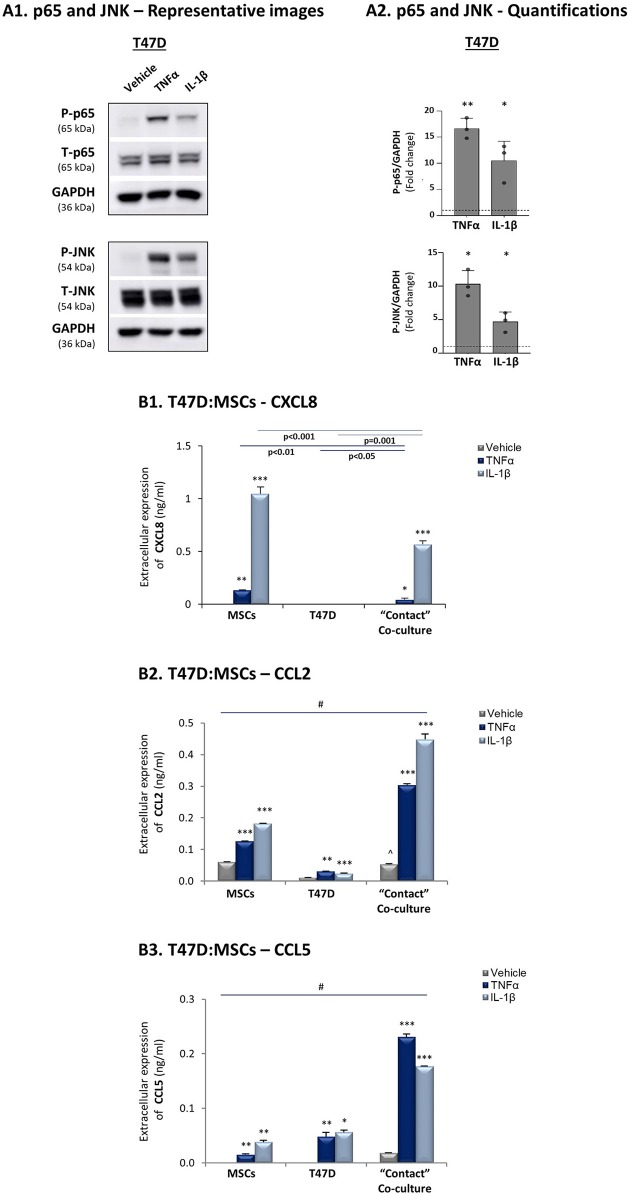
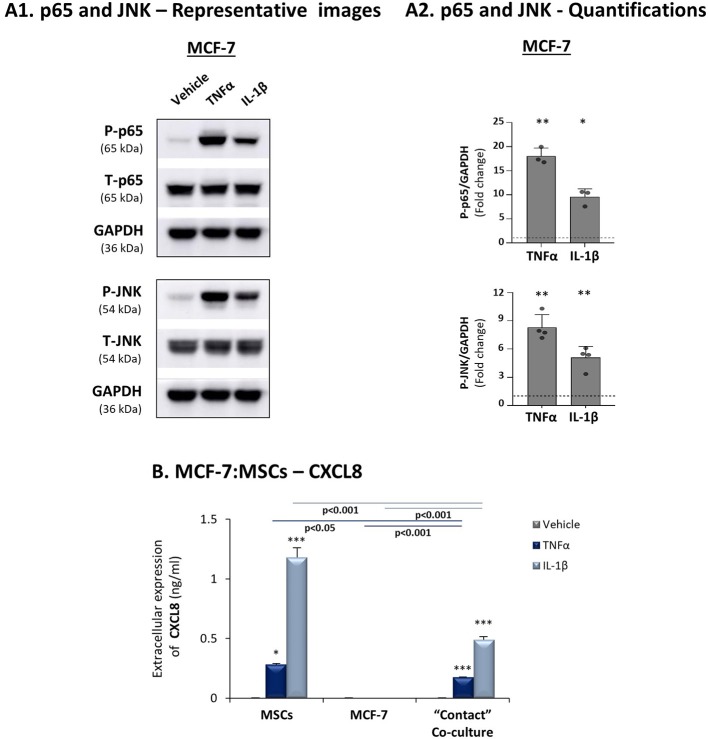
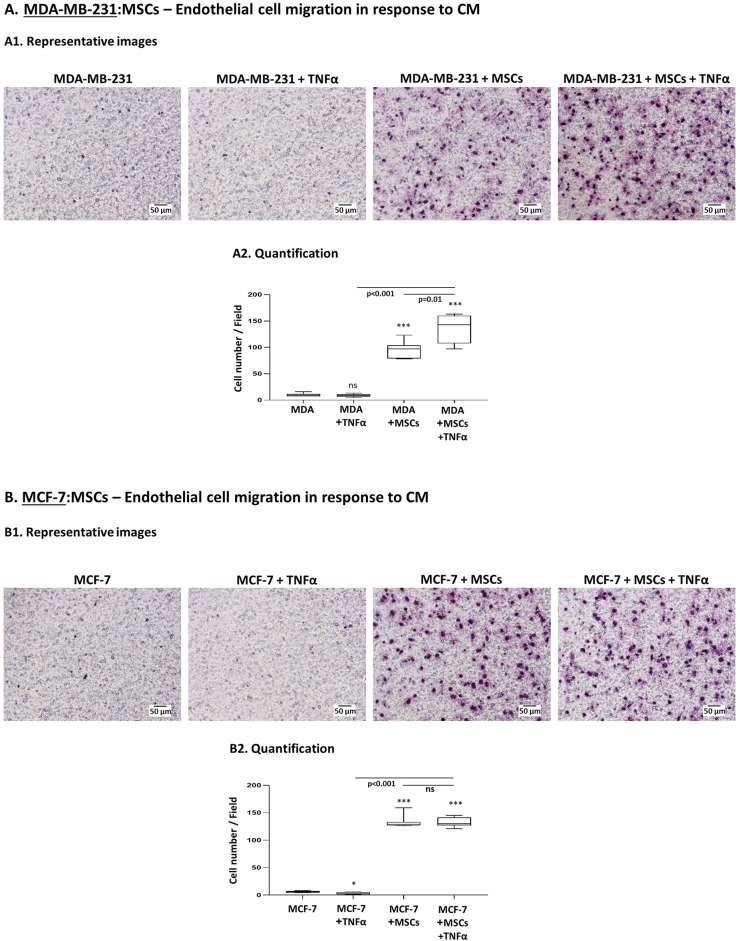
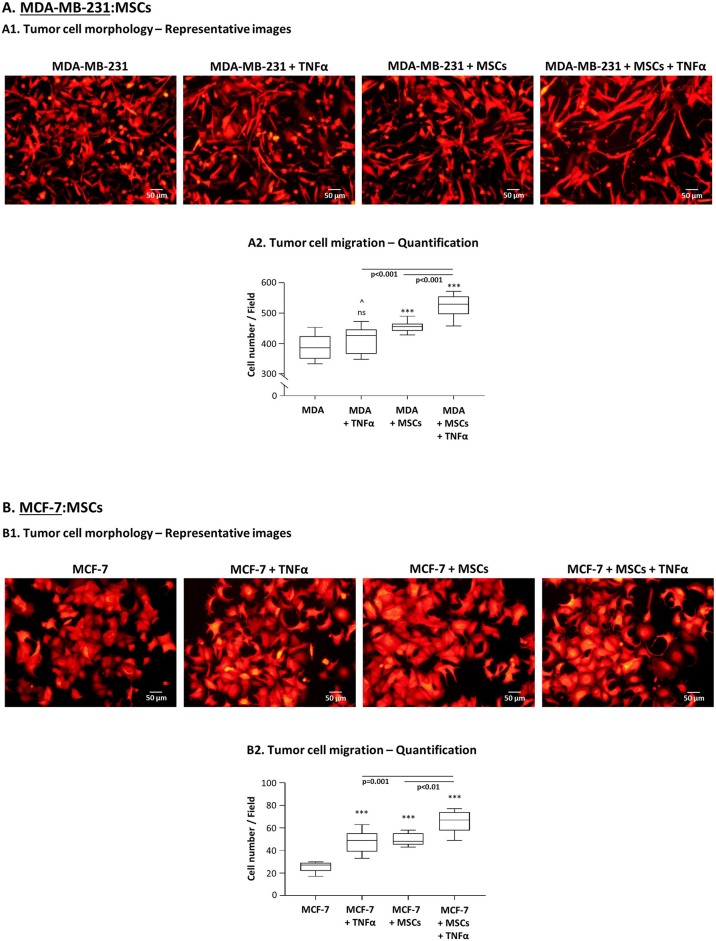
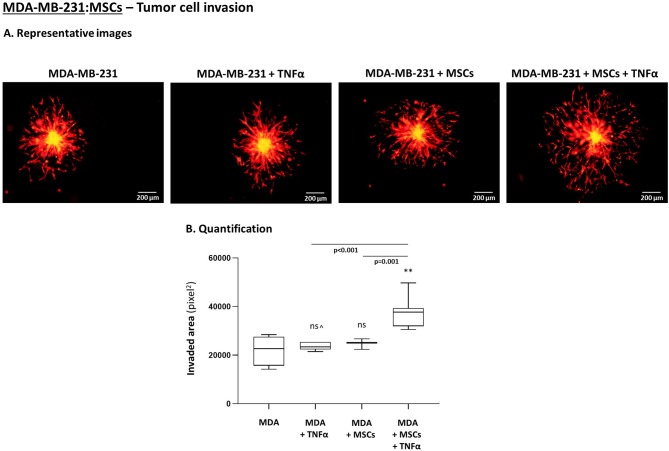
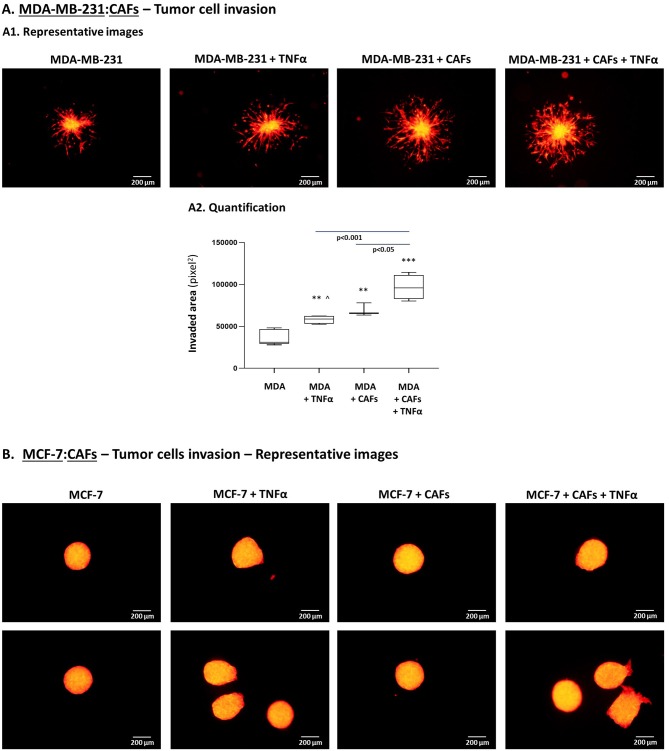
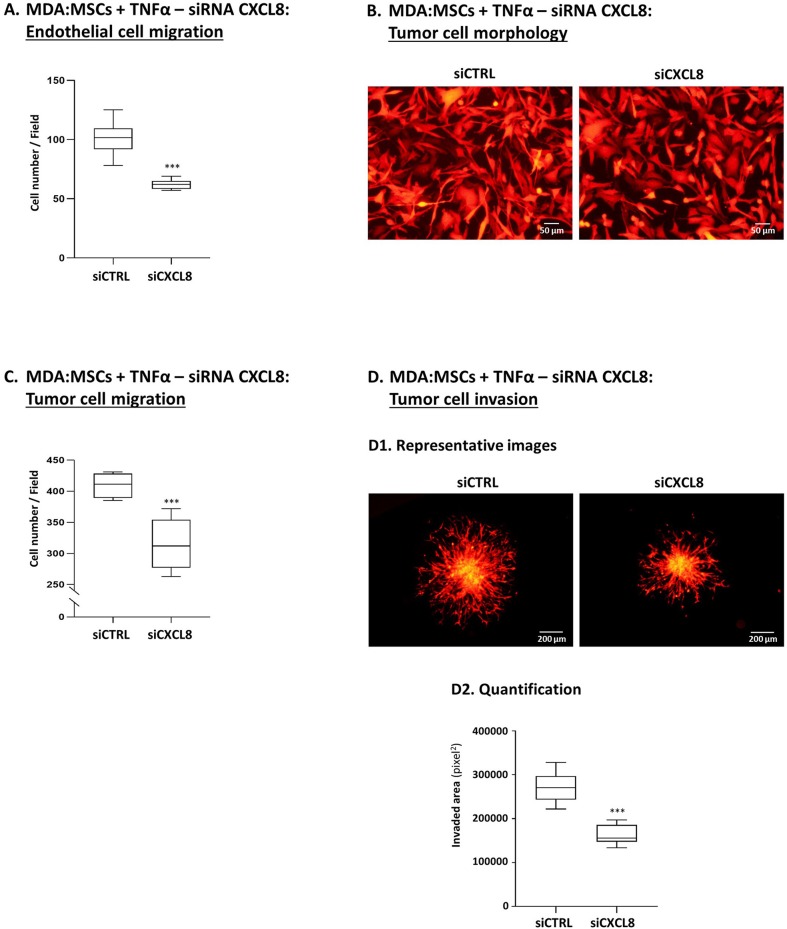
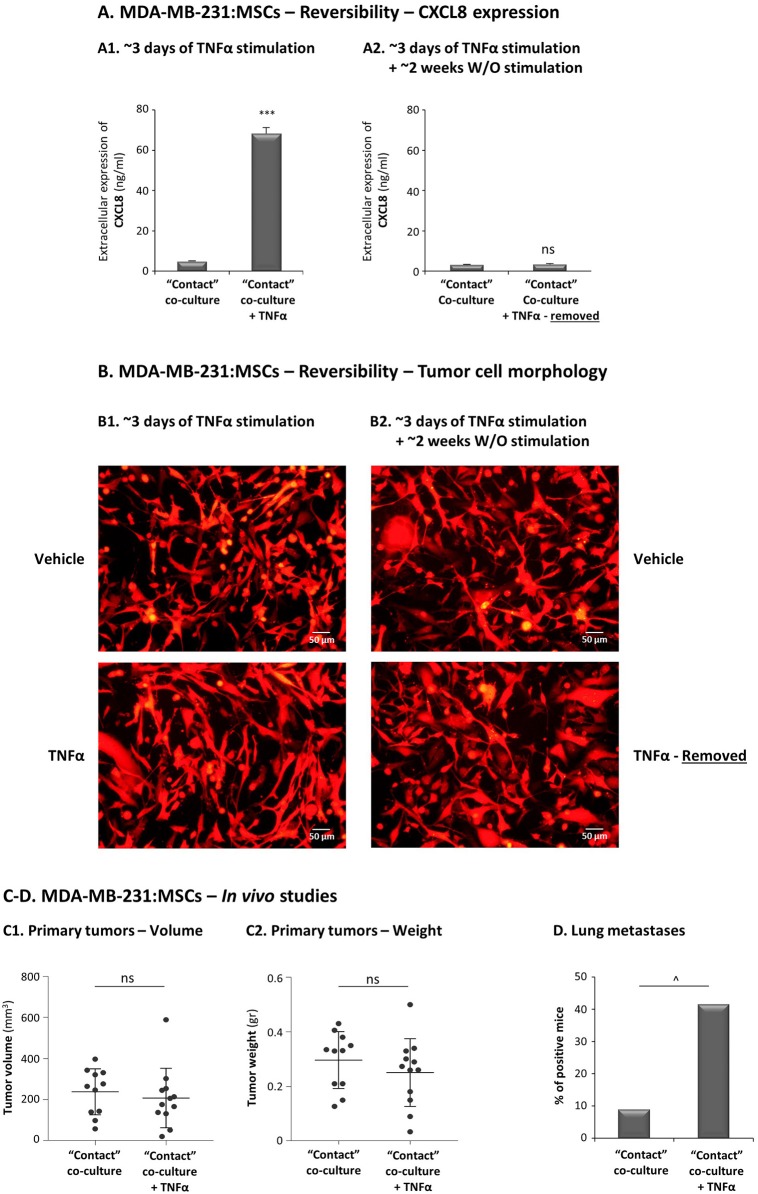
The tumor microenvironment (TME) plays key roles in promoting disease progression in the aggressive triple-negative subtype of breast cancer (TNBC; Basal/Basal-like). Here, we took an integrative approach and determined the impact of tumor-stroma-inflammation networks on pro-metastatic phenotypes in TNBC. With the TCGA dataset we found that the pro-inflammatory cytokines tumor necrosis factor α (TNFα) and interleukin 1β (IL-1β), as well as their target pro-metastatic chemokines CXCL8 (IL-8), CCL2 (MCP-1), and CCL5 (RANTES) were expressed at significantly higher levels in basal patients than luminal-A patients. Then, we found that TNFα- or IL-1β-stimulated co-cultures of TNBC cells (MDA-MB-231, MDA-MB-468, BT-549) with mesenchymal stem cells (MSCs) expressed significantly higher levels of CXCL8 compared to non-stimulated co-cultures or each cell type alone, with or without cytokine stimulation. CXCL8 was also up-regulated in TNBC co-cultures with breast cancer-associated fibroblasts (CAFs) derived from patients. CCL2 and CCL5 also reached the highest expression levels in TNFα/IL-1β-stimulated TNBC:MSC/CAF co-cultures. The elevations in CXCL8 and CCL2 expression partly depended on direct physical contacts between the tumor cells and the MSCs/CAFs, whereas CCL5 up-regulation was entirely dependent on cell-to-cell contacts. Supernatants of TNFα-stimulated TNBC:MSC "Contact" co-cultures induced robust endothelial cell migration and sprouting. TNBC cells co-cultured with MSCs and TNFα gained migration-related morphology and potent migratory properties; they also became more invasive when co-cultured with MSCs/CAFs in the presence of TNFα. Using siRNA to CXCL8, we found that CXCL8 was significantly involved in mediating the pro-metastatic activities gained by TNFα-stimulated TNBC:MSC "Contact" co-cultures: angiogenesis, migration-related morphology of the tumor cells, as well as cancer cell migration and invasion. Importantly, TNFα stimulation of TNBC:MSC "Contact" co-cultures in vitro has increased the aggressiveness of the tumor cells in vivo, leading to higher incidence of mice with lung metastases than non-stimulated TNBC:MSC co-cultures. Similar tumor-stromal-inflammation networks established in-culture with luminal-A cells demonstrated less effective or differently-active pro-metastatic functions than those of TNBC cells. Overall, our studies identify novel tumor-stroma-inflammation networks that may promote TNBC aggressiveness by increasing the pro-malignancy potential of the TME and of the tumor cells themselves, and reveal key roles for CXCL8 in mediating these metastasis-promoting activities.

Keywords: CCL2; CCL5; CXCL8; cancer-associated fibroblasts; interleukin 1β; mesenchymal stem cells; triple-negative breast cancer; tumor necrosis factor α.


Figures

Figure 1
Figure 1
The expression levels of the pro-inflammatory cytokines TNFα and IL-1β and of their chemokine targets are significantly higher in basal patients than in luminal-A patients. The Figure demonstrates gene expression analyses, performed with the TCGA breast cancer dataset. (A) TNFα, (B) IL-1β, (C) CXCL8, (D) CCL2, (E) CCL5. (A1–E1) Boxplots comparing expression levels in basal patients and luminal-A patients. ***p < 0.001. (A2–E2) Histograms demonstrating the distribution of expression levels of each of the factors in basal and luminal-A patient tumors. RSEM, RNAseq by expectation-maximization.
Figure 2
Figure 2
In basal patients, the expression levels of the pro-inflammatory cytokines TNFα and IL-1β are significantly coordinated with the expression levels of their chemokine targets. The Figure demonstrates correlation analyses of gene expression in basal patients, performed with the TCGA breast cancer dataset. (A) CXCL8 correlations with TNFα (A1) and IL-1β (A2). (B) CCL2 correlations with TNFα (B1) and IL-1β (B2). (C) CCL5 correlations with TNFα (C1) and IL-1β (C2). RSEM, RNAseq by expectation-maximization.
Figure 3
Figure 3
CXCL8, CCL2 and CCL5 reach their highest expression levels when TNBC:MSC “Contact” co-cultures are stimulated by TNFα or IL-1β. (A) Activation of p65 and JNK, determined by WB in MSCs and in human TNBC MDA-MB-231 cells upon 15 min stimulation by TNFα, IL-1β or vehicle control (based on kinetics and titration studies. Information on cytokine concentrations is given in “Materials and methods”). GAPDH was used as a loading control. (A1) A representative experiment and (A2) averages ± SD of p65 and JNK activation (fold induction) in n ≥ 3 independent experiments, performed with MSCs of 2 different donors. ***p < 0.001, *p ≤ 0.05 for differences between the values obtained for cytokine-stimulated cells and control non-stimulated cells. Dashed line stands for the value of 1 given to control cells. (B) CXCL8 (B1), CCL2 (B2) and CCL5 (B3) expression levels were determined in TNBC:MSC co-cultures or each of the cell types grown alone, with or without TNFα or IL-1β stimulation. Co-cultures of MDA-MB-231 cells with MSCs were generated in “Transwell” and “Contact” conditions and were stimulated by TNFα (10 ng/ml), IL-1β (350 pg/ml) or vehicle control (similar for both cytokines) for 7 h. After change of media and growth for additional 60 h, the extracellular expression of CXCL8 in TNFα/IL-1β-free CM was determined by ELISA. ***p ≤ 0.001, **p ≤ 0.01, *p ≤ 0.05 for differences between TNFα- or IL-1β-stimulated cells and vehicle-treated cells, within each group. #p-values were <0.01 or <0.001 (in most cases) in comparisons of “Contact” co-cultures with all other treatments, as well as in comparisons of “Transwell” co-cultures with all other treatments. The results are of a representative experiment of n ≥ 3 independent experiments, performed with MSCs of 3 different donors.
Figure 4
Figure 4
CXCL8, CCL2 and CCL5 reach their highest expression levels when TNBC:CAF “Contact” co-cultures are stimulated by TNFα and IL-1β. The Figure demonstrates similar experiments and statistical analyses as those of Figure 3, performed herein with MDA-MB-231 cells and CAFs, using similar cytokine concentrations. (A) Activation of p65 and JNK. (B) CXCL8 (B1), CCL2 (B2) and CCL5 (B3) expression levels. In all parts of the Figure, the results are of a representative experiment of n ≥ 3 independent experiments. *, **, ***, # - As described in Figure 3. ns=non-significant.
Figure 5
Figure 5
Increased production of CXCL8 is a general characteristic of tumor-stroma-inflammation networks established with TNBC cells. The Figure demonstrates similar experiments and statistical analyses as those of Figure 3, performed herein with human TNBC MDA-MB-468, BT-549 cells and MSCs. Cytokine concentrations: MDA-MB-468 cells - 50 ng/ml TNFα and 500 pg/ml IL-1β; BT-549 cells - 25 ng/ml TNFα and 350 pg/ml IL-1β. (A) Activation of p65 and JNK. (B) CXCL8 expression levels. In all parts of the Figure, the results are of a representative experiment of n ≥ 3 independent experiments, performed with MSCs of 2 different donors. In panel 5B1, this value was significant in 2 out of 3 experiments. *, **, ***, # - As described in Figure 3. ns=non-significant.
Figure 6
Figure 6
CXCL8 expression is down-regulated in TNFα- and IL-1β-stimulated luminal-A (T47D): MSC “Contact” co-cultures. The Figure demonstrates similar experiments and statistical analyses as those of Figure 3, performed herein with T47D cells and MSCs. Cytokine concentrations: 50 ng/ml TNFα and 500 pg/ml IL-1β. (A) Activation of p65 and JNK. (B) CXCL8 (B1), CCL2 (B2) and CCL5 (B3) expression levels. In panel B2, comparisons to non-stimulated MSCs were non-reproducible. In all parts of the Figure, the results are of a representative experiment of n = 3 independent experiments, performed with MSCs of ≥2 different donors. *, **, ***, # - As described in Figure 3.
Figure 7
Figure 7
CXCL8 expression is down-regulated in TNFα- and IL-1β-stimulated luminal-A (MCF-7): MSC “Contact” co-cultures. The Figure demonstrates similar experiments and statistical analyses as those of Figure 3, performed herein with MCF-7 cells and MSCs. Cytokine concentrations: 50 ng/ml TNFα and 500 pg/ml IL-1β. (A) Activation of p65 and JNK. (B) CXCL8 expression levels. In all parts of the Figure, the results are of a representative experiment of n≥3 independent experiments, performed with MSCs of 2 different donors. *, **, ***, # - As described in Figure 3.
Figure 8
Figure 8
The pro-angiogenic activities of factors released by tumor:MSC “Contact” co-cultures are promoted by TNFα in TNBC but not in luminal-A cells. Studies of endothelial cell (HPMEC) migration in response to CM derived from different cell combinations of MDA-MB-231 cells (“MDA”) (A) and MCF-7 cells (B). (A1, B1) Representative photos of HPMEC migration in response to TNFα-free CM derived from TNFα-stimulated tumor:MSC “Contact” co-cultures (10 ng/ml), from tumor cells alone, from tumor cells stimulated by TNFα alone and from tumor cells grown under “Contact” conditions with MSCs only. Bars, 50 μm. (A2, B2) Migrated HPMEC were counted in multiple photos per insert of the experiments presented in A1 and B1. ***p < 0.001, *p < 0.05, ns=non-significant for comparisons between CM of different cell combinations and CM of tumor cells treated by vehicle. Photos and their quantifications are representatives of n ≥ 3 independent experiments, performed with MSCs of 3 different donors.
Figure 9
Figure 9
TNBC cells, and less so luminal-A cells, acquire migration-related characteristics upon “Contact” co-culturing with MSCs in the presence of TNFα. (A) Morphology and migration phenotypes of MDA-MB-231 cells (“MDA”). (A1) Morphology of mCherry-MDA-MB-231 cells grown with MSCs in the presence of TNFα (10 ng/ml), compared to tumor cells treated by vehicle, tumor cells stimulated by TNFα or tumor cells grown with MSCs only. Bar, 50 μm. (A2) Migration of mCherry-MDA-MB-231 cells (“MDA”) grown in “Contact” co-cultures with MSCs in the presence of TNFα (10 ng/ml) compared to migration of MDA-MB-231 cells treated by vehicle only, of MDA-MB-231 cells stimulated by TNFα or of MDA-MB-231 cells grown in co-culture with MSCs only. Migration assays were performed in response to medium containing 10% FBS, for 12 h. ***p < 0.001, ns=non-significant for differences between migration of tumor cells in different combinations, compared to the migration of non-stimulated TNBC cells. In panel (A2), this value was significant in 1 out of 3 experiments. Representative fluorescent photos of migrating cells are presented in Supplementary Figure 4. In all sections of Part (A), the Figures demonstrate representative experiments of n = 3 independent experiments of each type, performed with MSCs of ≥2 different donors. (B) Morphology and migration phenotypes of MCF-7 cells, determined as described in Part (A), unless otherwise indicated. (B1) Morphology of mCherry-MCF-7 cells. Bar, 50 μm. (B2) Migration of Hoechst-loaded MCF-7 cells was performed in response to medium containing 10% FBS for 21 h through fibronectin-coated membranes, in similar combinations as of MDA-MB-231 cells in Part (A) (TNFα: 10 ng/ml). ***p < 0.001; Representative photos of migrating cells are presented in Supplementary Figure 5. In all sections of Part (B), the Figures demonstrate representative experiments of n ≥ 3 independent experiments, performed with MSCs of ≥2 different donors.
Figure 10
Figure 10
TNBC cells acquire elevated invasive properties upon “Contact” co-culturing with MSCs in the presence of TNFα. The Figure demonstrates tumor cell invasion out of 3D spheroids that were formed by mCherry-MDA-MB-231 cells (“MDA”) alone or by tumor cells in “Contact” co-culturing with MSCs. The spheroids were imbedded into matrigel and then stimulated by TNFα (10 ng/ml) or vehicle for 48 h. (A) Representative photos. Bar, 200 μm. (B) Invasion was quantified in multiple spheroids by ImageJ. **p < 0.01, ns=non-significant for differences between TNBC cell invaded out of spheroids in different combinations, compared to the invasion of non-stimulated TNBC-only spheroids. See “Note” in legend to Figure 11. Photos and their quantifications are representatives of n > 3 independent experiments, performed with MSCs of 2 different donors.
Figure 11
Figure 11
TNBC cells but not luminal-A cells acquire elevated invasive properties upon “Contact” co-culturing with patient-derived CAFs in the presence of TNFα. (A) The Figure demonstrates similar experimental setup as in Figure 10, performed herein with mCherry-MDA-MB-231 cells (“MDA”) and CAFs, using similar cytokine concentrations. [Note: Possibly due to technical reasons (different matrigel batches) TNFα stimulation elevated tumor cell invasion in this setting but not in Figure 10]. (A1) Representative photos. Bar, 200 μm. (A2) Invasion was quantified in multiple spheroids by ImageJ. ***p < 0.001, **p < 0.01 for differences between invasion of tumor cells in different combinations, compared to the invasion of TNBC cells grown alone in spheroids. Photos and their quantifications are representatives of n > 3 independent experiments. (B) MCF-7 cells have undergone similar procedures to those described in Figure 10, for 96 h (TNFα 10 ng/ml). Because invasion of MCF-7 cells out of the spheroids was minimal or absent, quantitation could not be performed. Instead, two representative photos out of many taken in n > 3 independent experiments, are provided for each treatment. Bar, 200 μm.
Figure 12
Figure 12
Tumor-stroma-inflammation networks lead through CXCL8 activities to increased angiogenesis, invasion-related tumor cell morphology, tumor cell migration and invasion in TNBC cells. MDA-MB-231 cells (“MDA”) and MSCs were both transfected by siCXCL8 or siCTRL. Parallel studies indicated that the efficiency of CXCL8 down-regulation was high [80–90% in most experiments, as in (80); Data not shown]. The cells were grown in “Contact” co-cultures and were stimulated by TNFα (10 ng/ml); then, the cells or their CM were assayed in the following tests: (A) Endothelial cell migration (Procedures as in Figure 8A). ***p < 0.001; (B) Tumor cell morphology (Procedures as in Figure 9A1). Bar, 50 μm; (C) Tumor cell migration (Procedures as in Figure 9A2). ***p < 0.001; (D) Tumor cell invasion (Procedures as in Figure 10). (D1) Representative photos. Bar, 200 μm. (D2) Quantification. ***p < 0.001. In all parts of the Figure, photos and their quantifications are representatives of n = 3 independent experiments, performed with MSCs of 2 different donors.
Figure 13
Figure 13
TNFα promotes the metastatic potential of TNBC cells grown in contact with MSCs. (A,B) Reversibility of TNFα-induced tumor-promoting phenotypes, generated in vitro in “Contact” MDA-MB-231:MSC co-cultures following TNFα removal. mCherry-MDA-MB-231 cells were co-cultured in “Contact” conditions with MSCs in the presence of TNFα (10 ng/ml) or vehicle control for 67 h (termed “~3 days of TNFα stimulation") (A1,B1). Then, vehicle-treated and TNFα-stimulated MDA-MB-231:MSCs co-cultures were re-cultured without further TNFα stimulation for additional 10–14 days (termed “~3 days of stimulation + ~2 weeks W/O TNFα stimulation) (A2,B2). At both time points (~3 days and ~2 weeks), extracellular CXCL8 levels were determined in cell supernatants by ELISA (A) and tumor cell morphology was determined by fluorescent microscopy (B). ***p < 0.001, ns, not significant. Bar, 50 μm. In all panels of section (A,B), the results are representatives of n = 3 independent experiments, performed with MSCs of 2 different donors. (C,D) mCherry-MDA-MB-231 cells were grown in “Contact” co-cultures with MSCs in the presence of TNFα (10 ng/ml) or vehicle control, for 67 h (~3 days). Then, co-cultured cells were injected to the mammary fat pad of nude mice in 2 independent experiments (For additional experimental details please see “Materials and methods”). Total mice numbers were: (1) In the group of mice administered with TNFα-stimulated co-cultures: n = 12; (2) In the group of mice administered with vehicle-exposed co-cultures: n = 11. At the end of the experiment (~30 days post injection), primary tumor size was determined by volume (C1) and weight (C2). ns=non-significant. (D) Metastases in lungs were detected by mCherry signals using the Cri Maestro fluorescence imaging system. p = 0.095.

Similar articles

Cited by

References

    1. Gerratana L, Fanotto V, Bonotto M, Bolzonello S, Andreetta C, Moroso S, et al. Pattern of metastatic spread and prognosis of breast cancer biologic subtypes. J Clin Oncol. (2014) 32:e12532 10.1200/jco.2014.32.15_suppl.e12532 - DOI
    1. Eroles P, Bosch A, Perez-Fidalgo JA, Lluch A. Molecular biology in breast cancer: intrinsic subtypes and signaling pathways. Cancer Treat Rev. (2012) 38:698–707. 10.1016/j.ctrv.2011.11.005 - DOI - PubMed
    1. Joensuu H, Gligorov J. Adjuvant treatments for triple-negative breast cancers. Ann Oncol. (2012) 23(Suppl. 6):vi40–5. 10.1093/annonc/mds194 - DOI - PubMed
    1. Bianchini G, Balko JM, Mayer IA, Sanders ME, Gianni L. Triple-negative breast cancer: challenges and opportunities of a heterogeneous disease. Nat Rev Clin Oncol. (2016) 13:674–90. 10.1038/nrclinonc.2016.66 - DOI - PMC - PubMed
    1. McAllister SS, Weinberg RA. The tumour-induced systemic environment as a critical regulator of cancer progression and metastasis. Nat Cell Biol. (2014) 16:717–27. 10.1038/ncb3015 - DOI - PMC - PubMed

Publication types

MeSH terms