. 2019 Apr 12:10:803.
doi: 10.3389/fimmu.2019.00803. eCollection 2019.

The Antidepressant Mirtazapine Inhibits Hepatic Innate Immune Networks to Attenuate Immune-Mediated Liver Injury in Mice

Affiliations

The Antidepressant Mirtazapine Inhibits Hepatic Innate Immune Networks to Attenuate Immune-Mediated Liver Injury in Mice

Wagdi Almishri et al. Front Immunol. .

Abstract

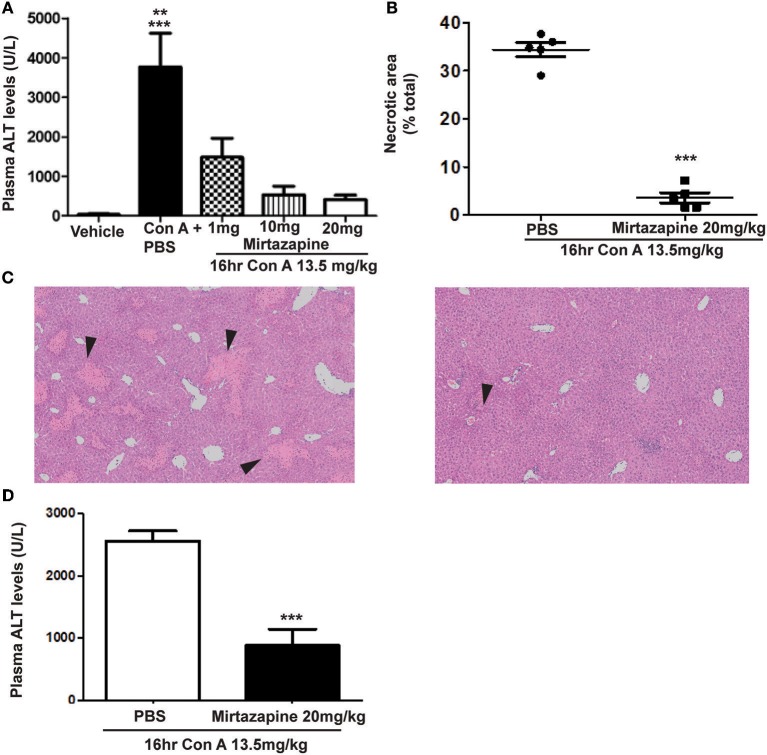
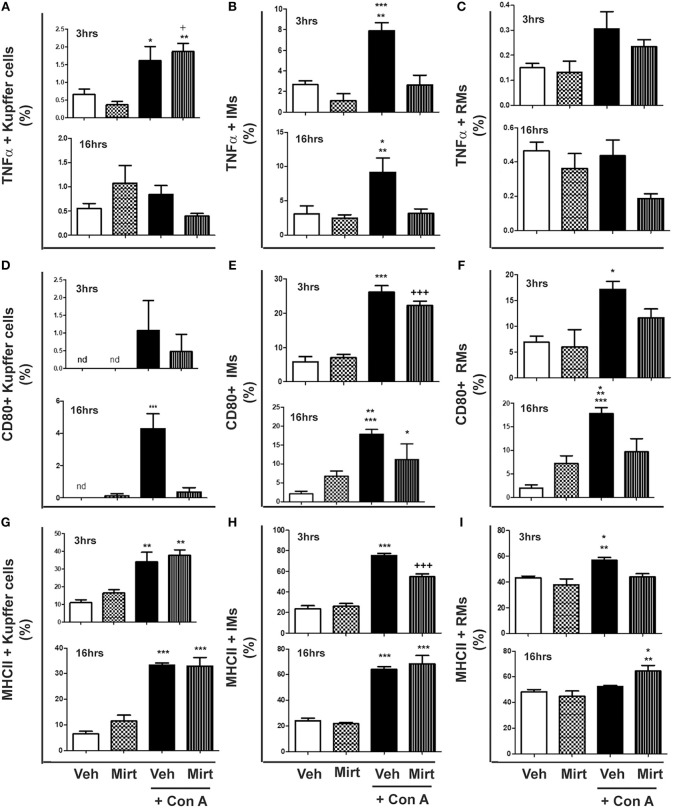
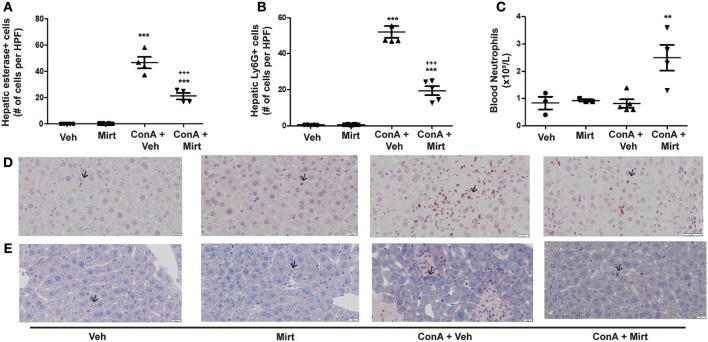
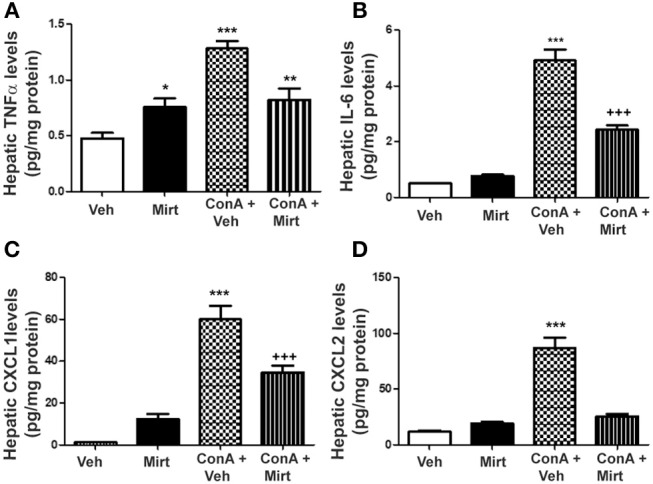
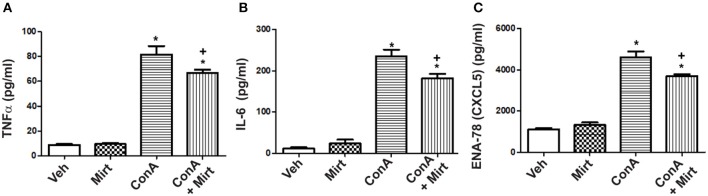
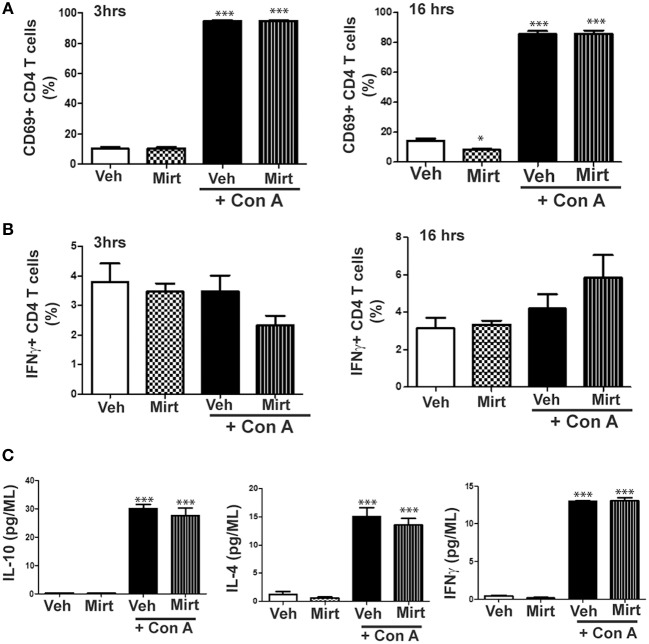
Activation of the innate immune system, including tissue macrophages and associated neutrophil infiltration, is an important driver of subsequent adaptive immune responses in many autoimmune diseases, including autoimmune hepatitis (AIH). The antidepressant mirtazapine has a unique complex pharmacology, altering signaling through a number of serotonin and histamine receptors that can impact macrophage function; an effect potentially influencing AIH outcome. In the mouse model of concanavalin A (Con A) induced liver injury (mimics many aspects of human AIH), in which early innate immune activation (i.e., stimulated hepatic macrophages/monocytes recruit neutrophils and additional monocytes to the liver) critically drives immune-mediated hepatitis induction, mirtazapine strikingly and dose-dependently inhibited Con A-induced liver injury. This inflammation-suppressing effect of mirtazapine was linked to an attenuation of Con A-stimulated early innate immune responses within the liver, including inhibition of hepatic macrophage/monocyte activation, decreased hepatic macrophage/monocyte-derived pro-inflammatory cytokine (e.g., TNFα) and chemokine (e.g., CXCL1 and CXCL2) production, suppression of Con A-induced increases in the hepatic expression of the neutrophil relevant endothelial cell adhesion molecule ICAM-1, with the resultant significant reduction in neutrophil recruitment into the liver. Consistent with our findings in the Con A model, mirtazapine also significantly reduced activation-induced release of cytokine/chemokine mediators from human CD14+ monocytes in vitro. Conclusion: Our data suggest that mirtazapine can attenuate hepatic innate immune responses that critically regulate the subsequent development of autoimmune liver injury. Therefore, given that it is a safe and widely used medication, mirtazapine may represent a novel therapeutic approach to autoimmune liver disease.

Keywords: autoimmunity; chemokine; cytokine; flow cytometry; inflammation; macrophage; neutrophil.


Figures

Figure 1
Figure 1
Mirtazapine pretreatment attenuates Con A-induced immune-mediated hepatitis. (A) Administration of mirtazapine leads to a marked reduction in liver damage 16 h post-Con A treatment, as reflected by plasma ALT levels (***p < 0.001 Con A + PBS group vs. vehicle, Con A + 10 mg/kg mirtazapine group, and Con A + 20 mg/kg mirtazapine groups; **p < 0.01 Con A + PBS group vs. Con A + 1 mg/kg mirtazapine group; n = 4–5 mice/group), and by (B) quantification of histological damage in H&E stained liver sections (i.e., as total (%) area of liver cell necrosis). (C) Representative H&E stained liver sections from Con A-treated mice that received either mirtazapine (20 mg/kg) (C, right panel) or mirtazapine vehicle (C, left panel). Mice treated with Con A + vehicle showed extensive liver cell necrosis (black arrowheads) whereas mice treated with Con A + mirtazapine showed only minimal hepatocyte damage (images are 100 X). (D) Mirtazapine treatment 2 h after Con A administration significantly attenuates Con A hepatitis 16 h post-treatment. ***p < 0.0007; n = 4 (Con A) and 5 (Con A + mirt) mice per group.
Figure 2
Figure 2
Mirtazapine treatment inhibits Con A-induced hepatic monocyte/macrophage activation. Mice were treated with vehicle (veh), mirtazapine (mirt; 20 mg/kg), Con A + veh or Con A + mirt. At 3 and 16 h post-Con A treatment hepatic immune cells were isolated and the effect of mirt treatment on hepatic monocyte/macrophage activation assessed by flow cytometry. (A) TNFα production by hepatic Kupffer cells; 3 h *p < 0.05 Con A + veh vs. veh and mirt groups. +p < 0.05 Con A + mirt vs. veh group. **p < 0.01 Con A + mirt vs. mirt group. Sixteen hours groups were not statistically different. (B) TNFα production by hepatic IMs; 3 h ***p < 0.0001 Con A + veh vs. veh and mirt groups. **p < 0.01 Con A + veh vs. Con A + mirt group; 16 h *p < 0.05 Con A + veh vs. veh and mirt groups. **p < 0.01 Con A + veh vs. Con A + mirt group. (C) TNFα production of hepatic RMs; 3 and 16 h, groups are not statistically different. (D) CD80 expression on hepatic KCs; 3 h, groups are not statistically different. Sixteen hours ***p < 0.0001 Con A+ veh vs. all other groups. (E) CD80 expression on hepatic IMs; 3 h ***p < 0.0001 Con A+ veh vs. veh and mirt groups. +++p < 0.0001 Con A + mirt vs. veh and mirt groups. Sixteen hours, ***p < 0.0001 Con A+ veh vs. veh. **p < 0.01 Con A+ veh vs. mirt. *p < 0.05 Con A + mirt vs. Con A + veh and veh groups. (F) CD80 expression on hepatic RMs; 3 h, *p < 0.05 Con A + veh vs. veh and mirt groups. Sixteen hours ***p < 0.0001 Con A+ veh vs. veh. **p < 0.01 Con A+ vehicle vs. Con A + mirt. *p < 0.05 Con A + veh vs. mirt. (G) MHC II expression on hepatic KCs; 3 h, **p < 0.01 Con A+ veh and Con A+ mirt vs. veh and mirt groups. Sixteen hours, ***p < 0.0001 Con A+ veh and Con A+ mirt vs. veh and mirt groups. (H) MHC II expression on hepatic IMs; 3 h, ***p < 0.0001 Con A+ veh vs. all other groups. +++p < 0.0001 Con A+ mirt vs. all other groups. Sixteen hours, ***p < 0.0001 Con A+ veh and Con A+ mirt vs. veh and mirt groups. (I) MHC II expression on hepatic RMs; 3 h, **p < 0.01 Con A+ veh vs. veh. *p < 0.05 Con A + veh vs. Con A + veh and mirt groups. Sixteen hours, **p < 0.01 Con A+ mirt vs. mirt group. *p < 0.05 Con A + mirt vs. Con A + veh and veh groups. n = 4–5 mice per group.
Figure 3
Figure 3
Mirtazapine treatment significantly decreases neutrophil recruitment into the liver, and increases circulating neutrophil numbers, in Con A treated mice. (A,B) Mirtazapine treatment significantly reduces Con A-mediated hepatic neutrophil recruitment, as reflected by esterase staining (A) or Ly6G staining (B). Treatment with mirtazapine alone did not alter hepatic neutrophil numbers (A,B). Administration of mirtazapine leads to a striking reduction in the number of neutrophils recruited to the liver post-Con A administration. Esterase or Ly6G positive cells were counted in 60 random high power fields (HPF)/liver section, and numbers of positive cells averaged for each liver section. Although mirtazapine treatment alone did not alter hepatic neutrophil numbers, administration of mirtazapine resulted in a >2-fold reduction in numbers of neutrophils recruited to the liver post-Con A administration. ***p < 0.0001 Con A + vehicle and Con A + mirt vs. mirt and vehicle alone groups. +++p < 0.0001 vs. Con A + vehicle treated groups; n = 4–5 mice/group). (C) Significant increase in circulating blood neutrophil count in Con A + mirtazapine treated mice vs. Con A + vehicle, mirtazapine alone or vehicle alone treated groups, determined 8 h post-Con A treatment. **p < 0.01 Con A + mirtazapine vs. other groups; n = 3–5 mice/group). (D) Representative immunohistochemical images of Ly6G+ staining neutrophils (black arrows) in liver sections. (E) Representative immunohistochemical images of positive esterase staining immune cells (black arrows) in liver sections.
Figure 4
Figure 4
Mirtazapine administration significantly attenuates Con A-induced increases in hepatic cytokine (TNFα, IL-6) and chemokine (CXCL1, CXCL2) levels. (A) Mirtazapine treatment significantly increases hepatic TNFα levels, compared to vehicle treated animals, and Con A treatment further increases hepatic TNFα levels; an increase that is prevented by mirtazapine treatment. *p < 0.05 mirtazapine vs. vehicle groups; **p < 0.01 Con A + mirtazapine vs. vehicle group; ***p < 0.0001 Con A+ vehicle vs. all other groups; n = 6–7 mice/group). (B) Con A treatment significantly increases hepatic IL-6 levels which is attenuated by mirtazapine treatment. ***p < 0.0001 Con A + vehicle vs. all other groups; +++p < 0.0001 Con A + mirtazapine vs. all other groups. n = 6–7 mice/group). (C,D) Con A treatment significantly increases hepatic CXCL1 levels, and mirtazapine treatment significantly attenuates this Con A-induced increase. ***p < 0.0001 Con A + vehicle vs. all other groups; +++p < 0.0001 Con A + mirtazapine vs. all other groups. n = 6–7 mice/group. (D) Con A treatment significantly increases hepatic CXCL2 levels which is significantly attenuated by mirtazapine treatment. ***p < 0.0001 Con A + vehicle vs. all other groups. n = 6–7 mice/group.
Figure 5
Figure 5
Mirtazapine suppresses Con A-mediated upregulation of hepatic ICAM-1 expression. ICAM-1 immunohistochemistry of representative liver sections from vehicle, mirtazapine, Con A, and Con A + mirtazapine treated mice, showing: (A,B) limited sinusoidal expression and weak central vein endothelium expression of ICAM-1 in vehicle and mirtazapine treated mice. No ICAM-1 expression was detected in portal vein endothelium. (B) striking increase of hepatic ICAM-1 expression in sinusoidal endothelium and central veins at 16 h post-Con A treatment. (C) marked reduction in the Con A-induced increase in hepatic ICAM-1 expression post-mirtazapine treatment. Portal veins are indicated by a black arrow head, central veins by a double-headed arrow, and sinusoids by a single-headed arrow (100X).
Figure 6
Figure 6
Mirtazapine attenuates TNFα, IL-6, and CXCL5 production by activated human monocytes/macrophages in vitro. Plastic adherent human CD14+ monocytes/macrophages were stimulated with Con A (5 μg/ml) for 24 h in the presence or absence of mirtazapine (10 μM). Levels of IL-6, TNFα, and CXCL5 were measured in culture supernatants using a Luminex® assay. (A–C) Stimulation with Con A for 24 h induced a significant increase in culture supernatant levels of TNFα, IL-6, and CXCL5 (pg/ml). Mirtazapine treatment resulted in a significant attenuation of the Con A-induced release of all three mediators into culture supernatants. For all panels, *p < 0.0001 Con A + vehicle and Con A + mirtazapine vs. vehicle + DMSO and mirtazapine treated control groups. (A) +p < 0.05 for Con A + vehicle vs. Con A + mirtazapine group. (B,C) +p < 0.01 Con A + vehicle vs. Con A + mirtazapine group (n = 4 for all groups).
Figure 7
Figure 7
Mirtazapine does not alter Con A-induced mouse CD4 T cell activation in vivo or human CD4 T cell cytokine production in vitro. (A) Con A treatment significantly increases hepatic CD4 T cell expression of the cellular activation marker CD69 at 3 and 16 h post-Con A treatment, which was not altered by mirtazapine (20 mg/kg) treatment. ***p < 0.001 vs. vehicle and mirtazapine treated groups. Mirtazapine significantly reduced CD69 expression on CD4 T cells at 16 h post-treatment compared to vehicle treated mice. *p < 0.05 vs. vehicle treated group (n = 5 mice/group). (B) Hepatic CD4 T cell production of IFNγ at 3 or 16 h post-vehicle, mirtazapine, Con A and Con A + mirtazapine treatment was not significantly different in all treatment groups (n = 5 mice/group). (C) Freshly isolated human peripheral blood CD4 T cells were stimulated with Con A (5 μg/ml) in vitro for 24 h in the presence or absence of mirtazapine (10 μM) and supernatant levels of IFNγ, IL-10, and IL-4 measured by Luminex. Con A stimulation significantly increased production of all three cytokines compared to vehicle and mirtazapine alone treated groups, and mirtazapine did not alter Con A stimulated secretion of any of the three cytokines. ***p < 0.001 vs. vehicle and mirtazapine alone groups (n = 3–4 for all groups).

Similar articles

Cited by

References

    1. Zhang Q, Vignali DA. Co-stimulatory and co-inhibitory pathways in autoimmunity. Immunity. (2016) 44:1034–51. 10.1016/j.immuni.2016.04.017 - DOI - PMC - PubMed
    1. Mantovani A, Cassatella MA, Costantini C, Jaillon S. Neutrophils in the activation and regulation of innate and adaptive immunity. Nat Rev Immunol. (2011) 11:519–31. 10.1038/nri3024 - DOI - PubMed
    1. Prame Kumar K, Nicholls AJ, Wong CHY. Partners in crime: neutrophils and monocytes/macrophages in inflammation and disease. Cell Tissue Res. (2018) 371:551–65. 10.1007/s00441-017-2753-2 - DOI - PMC - PubMed
    1. Nemeth T, Mocsai A, Lowell CA. Neutrophils in animal models of autoimmune disease. Semin Immunol. (2016) 28:174–86. 10.1016/j.smim.2016.04.001 - DOI - PMC - PubMed
    1. Suzuki A, Brunt EM, Kleiner DE, Miquel R, Smyrk TC, Andrade RJ, et al. . The use of liver biopsy evaluation in discrimination of idiopathic autoimmune hepatitis versus drug-induced liver injury. Hepatology. (2011) 54:931–9. 10.1002/hep.24481 - DOI - PMC - PubMed

Publication types

MeSH terms