Dual-Inhibition of mTOR and Bcl-2 Enhances the Anti-tumor Effect of Everolimus against Renal Cell Carcinoma In Vitro and In Vivo
- PMID: 31031856
- PMCID: PMC6485234
- DOI: 10.7150/jca.29192
Dual-Inhibition of mTOR and Bcl-2 Enhances the Anti-tumor Effect of Everolimus against Renal Cell Carcinoma In Vitro and In Vivo
Abstract
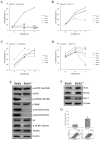
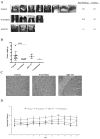
Renal cell carcinoma (RCC) is the predominant type of kidney cancer. Mammalian target of rapamycin (mTOR) inhibitor everolimus is currently used as a second-line therapy for sorafenib or sunitinib-refractory metastatic RCC patients. The clinical limitation confronted during everolimus therapy is the onset of drug resistance that decreases the efficacy of the drug. Elevated level of anti-apoptotic Bcl-2 protein is proposed to be an emerging feedback loop for the acquired drug-resistance in various cancer types. In this study, the Bcl-2 inhibitor ABT-737 was used in combination with everolimus to enhance its anti-tumor effectiveness in everolimus-resistant RCC cell lines. Everolimus and ABT-737 combination synergistically led to a decrease in the proliferation of primary site A-498 and metastatic site Caki-1 RCC cell lines, which was accompanied by a reduction in protein levels of cell cycle and mTOR pathway proteins. In both RCC cell lines, everolimus-ABT-737 combination not only induced apoptosis, caspase and PARP-1 cleavage but also a decrease in Bcl-2 protein levels in parallel with a concomitant increase in Bim and Noxa levels. In order to confirm our in vitro findings, we have generated everolimus-resistant RenCa cell line (RenCares) to establish a RCC mouse xenograft model. Animals co-treated with everolimus and ABT-737 exhibited a complete suppression of tumor growth without any notable toxicity. This study thus proposes the everolimus-ABT-737 combination as a novel therapeutic strategy for the treatment of RCC to overcome the current clinical problem of everolimus resistance.
Keywords: Bcl-2; Everolimus-ABT 737 combination; Renal Cell Carcinoma; mTOR.
Conflict of interest statement
Competing Interests: The authors have declared that no competing interest exists.
Figures
Similar articles
-
The selective MEK1 inhibitor Selumetinib enhances the antitumor activity of everolimus against renal cell carcinoma in vitro and in vivo.Oncotarget. 2017 Mar 28;8(13):20825-20833. doi: 10.18632/oncotarget.15346. Oncotarget. 2017. PMID: 28212559 Free PMC article.
-
ERK Inhibitor Enhances Everolimus Efficacy through the Attenuation of dNTP Pools in Renal Cell Carcinoma.Mol Ther Nucleic Acids. 2019 Mar 1;14:550-561. doi: 10.1016/j.omtn.2019.01.001. Epub 2019 Jan 10. Mol Ther Nucleic Acids. 2019. PMID: 30771617 Free PMC article.
-
The mTOR kinase inhibitor everolimus synergistically enhances the anti-tumor effect of the Bruton's tyrosine kinase (BTK) inhibitor PLS-123 on Mantle cell lymphoma.Int J Cancer. 2018 Jan 1;142(1):202-213. doi: 10.1002/ijc.31044. Epub 2017 Oct 16. Int J Cancer. 2018. PMID: 28905990
-
Targeted therapies for renal cell carcinoma in Chinese patients: focus on everolimus.Onco Targets Ther. 2015 Jan 29;8:313-21. doi: 10.2147/OTT.S64660. eCollection 2015. Onco Targets Ther. 2015. PMID: 25674006 Free PMC article. Review.
-
Everolimus in the management of metastatic renal cell carcinoma: an evidence-based review of its place in therapy.Core Evid. 2016 Sep 1;11:23-36. doi: 10.2147/CE.S98687. eCollection 2016. Core Evid. 2016. PMID: 27621699 Free PMC article. Review.
Cited by
-
Molecular Mechanisms of Kidney Injury and Repair.Int J Mol Sci. 2022 Jan 28;23(3):1542. doi: 10.3390/ijms23031542. Int J Mol Sci. 2022. PMID: 35163470 Free PMC article. Review.
-
Molecular characteristics and therapeutic implications of Toll-like receptor signaling pathway in melanoma.Sci Rep. 2023 Sep 4;13(1):13788. doi: 10.1038/s41598-023-38850-y. Sci Rep. 2023. PMID: 37666853 Free PMC article.
-
Identification of tumor mutation burden-related hub genes and the underlying mechanism in melanoma.J Cancer. 2021 Mar 1;12(8):2440-2449. doi: 10.7150/jca.53697. eCollection 2021. J Cancer. 2021. PMID: 33758620 Free PMC article.
-
A Mesenchymal Tumor Cell State Confers Increased Dependency on the BCL-XL Antiapoptotic Protein in Kidney Cancer.Clin Cancer Res. 2022 Nov 1;28(21):4689-4701. doi: 10.1158/1078-0432.CCR-22-0669. Clin Cancer Res. 2022. PMID: 35776130 Free PMC article.
-
Integrative Characterization of the Role of IL27 In Melanoma Using Bioinformatics Analysis.Front Immunol. 2021 Oct 18;12:713001. doi: 10.3389/fimmu.2021.713001. eCollection 2021. Front Immunol. 2021. PMID: 34733272 Free PMC article.
References
-
- Jemal A, Bray F, Center MM, Ferlay J, Ward E, Forman D. Global cancer statistics. CA Cancer J Clin. 2011;61(2):69–90. - PubMed
-
- Shuch B, Amin A, Armstrong AJ, Eble JN, Ficarra V, Lopez-Beltran A. et al. Understanding pathologic variants of renal cell carcinoma: distilling therapeutic opportunities from biologic complexity. European urology. 2015;67(1):85–97. - PubMed
-
- Cheville JC, Lohse CM, Zincke H, Weaver AL, Blute ML. Comparisons of outcome and prognostic features among histologic subtypes of renal cell carcinoma. Am J Surg Pathol. 2003;27(5):612–24. - PubMed
-
- Rini BI, Atkins MB. Resistance to targeted therapy in renal-cell carcinoma. Lancet Oncol. 2009;10(10):992–1000. - PubMed
LinkOut - more resources
Full Text Sources
Molecular Biology Databases
Research Materials
Miscellaneous

