

Significance of Amphiregulin (AREG) for the Outcome of Low and High Grade Astrocytoma Patients
- PMID: 31031857
- PMCID: PMC6485216
- DOI: 10.7150/jca.29282
Significance of Amphiregulin (AREG) for the Outcome of Low and High Grade Astrocytoma Patients
Abstract
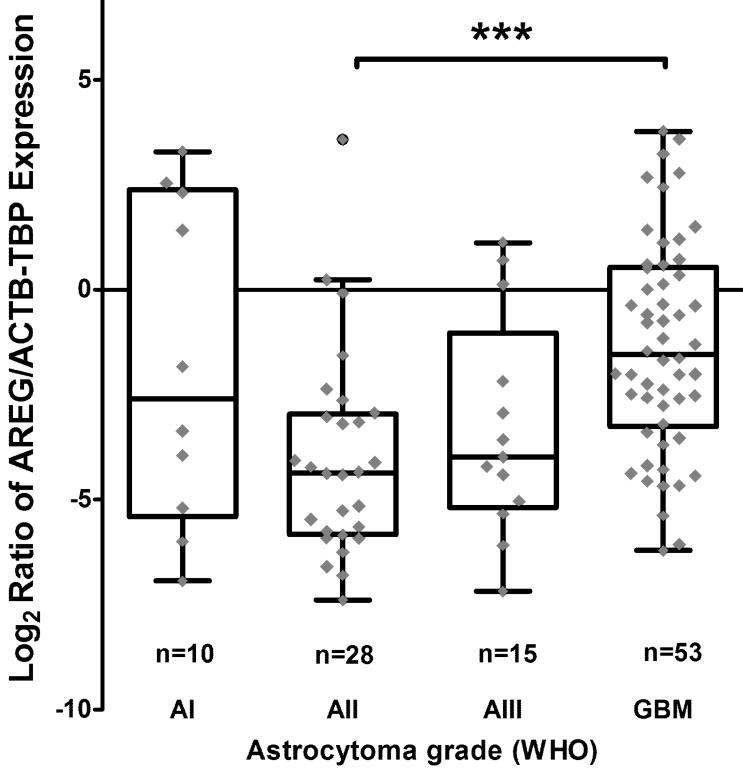
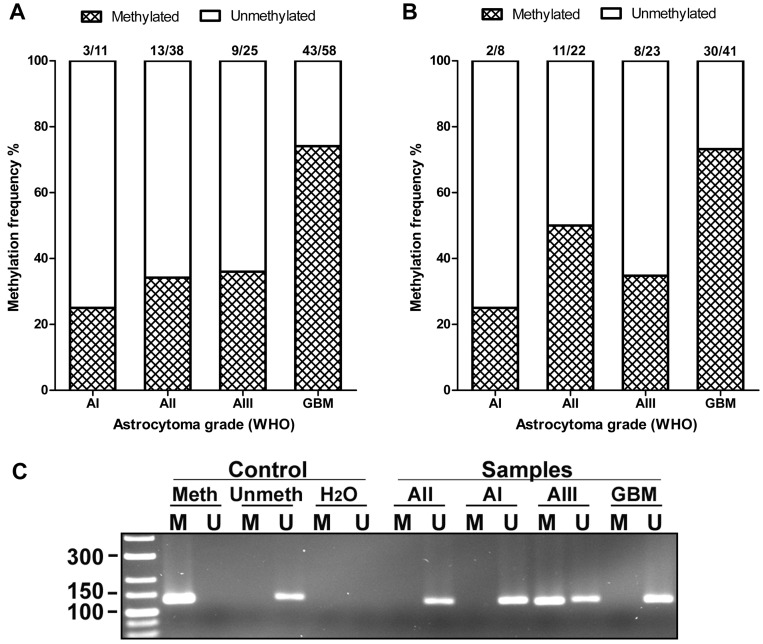
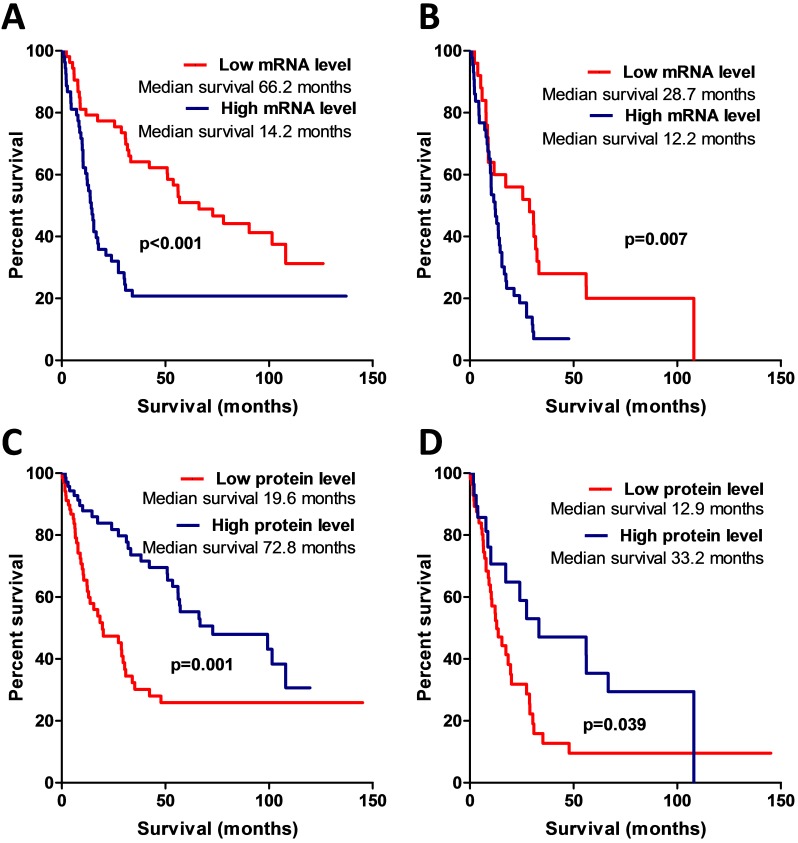
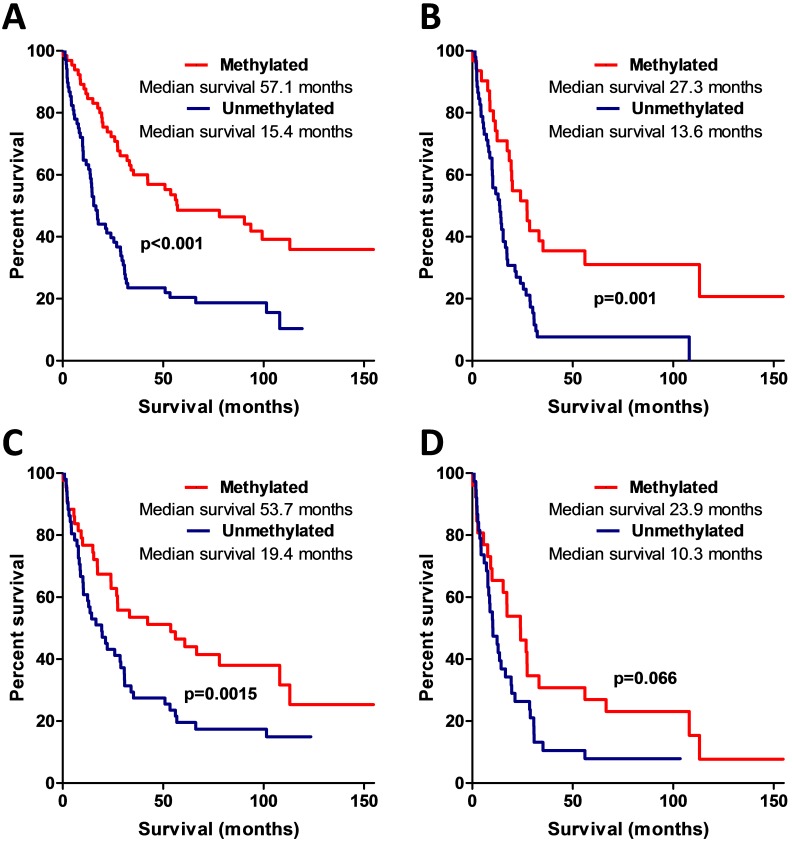
Background: Amphiregulin (AREG) is one of the ligands of the epidermal growth factor receptor which levels was shown to have a tight coherence with various types of cancer. AREG was also designated to be a promising marker for several types of cancer however precious little data about AREG role in the most frequent and generally lethal human brain tumours - astrocytomas reported up to date. The aim of the study was to investigate how AREG changes at epigenetic and expression levels reflect on astrocytoma malignancy and patient outcome. Methods: In total 205 low and high grade astrocytoma samples (15 pilocytic astrocytomas, 56 diffuse astrocytomas, 32 anaplastic astrocytomas and 102 glioblastomas) were used for target mRNA, protein expression and DNA methylation analysis applying qRT-PCR, Western-Blot and MS-PCR assays, respectively. Results: Present research revealed that AREG expression level and methylation in cancer tissue is dependent on the grade of astrocytoma. GBM tissue disclosed elevated AREG mRNA expression but reduced AREG protein level as compared to grade II and grade III astrocytomas (p<0.001). Increased methylation frequency was also more abundant in GBM (74%) than grade I, II and III astrocytomas (25%, 34%, and 36%, respectively). The survival analysis revealed relevant differences in patient overall survival between AREG methylation, mRNA and protein expression groups. Kaplan-Meier analysis encompassing only malignant tumours showed similar results indicating that AREG is associated with astrocytoma patient survival independently from astrocytoma grade. Conclusions: Current findings demonstrate that AREG appearance is associated with patient survival as well as astrocytomas malignancy indicating its influence on tumour progression and suggest its applicability as a promising marker.
Keywords: amphiregulin; astrocytoma; expression; glioma; methylation.
Conflict of interest statement
Competing Interests: The authors have declared that no competing interest exists.
Figures


Similar articles
-
Glioma Malignancy-Dependent NDRG2 Gene Methylation and Downregulation Correlates with Poor Patient Outcome.J Cancer. 2014 May 13;5(6):446-56. doi: 10.7150/jca.9140. eCollection 2014. J Cancer. 2014. PMID: 24847385 Free PMC article.
-
Testin (TES) as a candidate tumour suppressor and prognostic marker in human astrocytoma.Oncol Lett. 2016 Nov;12(5):3305-3311. doi: 10.3892/ol.2016.5077. Epub 2016 Sep 1. Oncol Lett. 2016. PMID: 27899997 Free PMC article.
-
High CHI3L1 expression is associated with glioma patient survival.Diagn Pathol. 2016 Apr 27;11:42. doi: 10.1186/s13000-016-0492-4. Diagn Pathol. 2016. PMID: 27121858 Free PMC article.
-
Juvenile pilocytic astrocytomas do not undergo spontaneous malignant transformation: grounds for designation as hamartomas.Br J Ophthalmol. 2008 Jan;92(1):40-6. doi: 10.1136/bjo.2007.125567. Epub 2007 Oct 25. Br J Ophthalmol. 2008. PMID: 17962395 Review.
-
Gliomas.Cancer Surv. 1998;32:37-51. Cancer Surv. 1998. PMID: 10489622 Review.
Cited by
-
Identification of an m6A RNA Methylation Regulator Risk Score Model for Prediction of Clinical Prognosis in Astrocytoma.Comput Math Methods Med. 2022 Jan 10;2022:7168929. doi: 10.1155/2022/7168929. eCollection 2022. Comput Math Methods Med. 2022. Retraction in: Comput Math Methods Med. 2023 Dec 6;2023:9896149. doi: 10.1155/2023/9896149. PMID: 35047056 Free PMC article. Retracted.
-
mRNA markers for survival prediction in glioblastoma multiforme patients: a systematic review with bioinformatic analyses.BMC Cancer. 2024 May 21;24(1):612. doi: 10.1186/s12885-024-12345-z. BMC Cancer. 2024. PMID: 38773447 Free PMC article.
-
Oncosuppressive Role of RUNX3 in Human Astrocytomas.J Oncol. 2019 Aug 5;2019:1232434. doi: 10.1155/2019/1232434. eCollection 2019. J Oncol. 2019. PMID: 31467531 Free PMC article.
-
Identification of Astrocytoma Blood Serum Protein Profile.Cells. 2019 Dec 19;9(1):16. doi: 10.3390/cells9010016. Cells. 2019. PMID: 31861636 Free PMC article.
-
Particulate matter facilitates amphiregulin-dependent lung cancer proliferation through glutamine metabolism.Int J Biol Sci. 2024 May 27;20(8):3126-3139. doi: 10.7150/ijbs.96210. eCollection 2024. Int J Biol Sci. 2024. PMID: 38904011 Free PMC article.
References
-
- Schwartzbaum JA, Fisher JL, Aldape KD, Wrensch M. Epidemiology and molecular pathology of glioma. Nat Clin Pract Neurol. 2006;2(9):494–503. - PubMed
-
- Berasain C, Avila MA. Amphiregulin. Semin Cell Dev Biol. 2014;28:31–41. - PubMed
-
- Hayden EC. Genomics boosts brain-cancer work. Nature. 2010;463(7279):278–278. - PubMed
-
- The Cancer Genome Atlas - Data Portal. Available at: https://tcga-data.nci.nih.gov/docs/publications/tcga/?
LinkOut - more resources
Full Text Sources
Research Materials
