. 2011;3(2):253-265.
doi: 10.1198/sbr.2011.10013. Epub 2012 Jan 1.

Time to All-cause Treatment Discontinuation as the Primary Outcome in the Clinical Antipsychotic Trials of Intervention Effectiveness (CATIE) Schizophrenia Study

Affiliations

Time to All-cause Treatment Discontinuation as the Primary Outcome in the Clinical Antipsychotic Trials of Intervention Effectiveness (CATIE) Schizophrenia Study

Sonia M Davis et al. Stat Biopharm Res. 2011.

Abstract

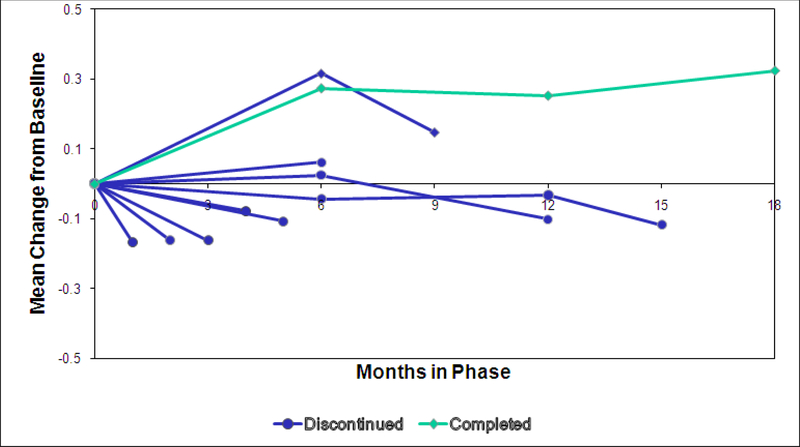
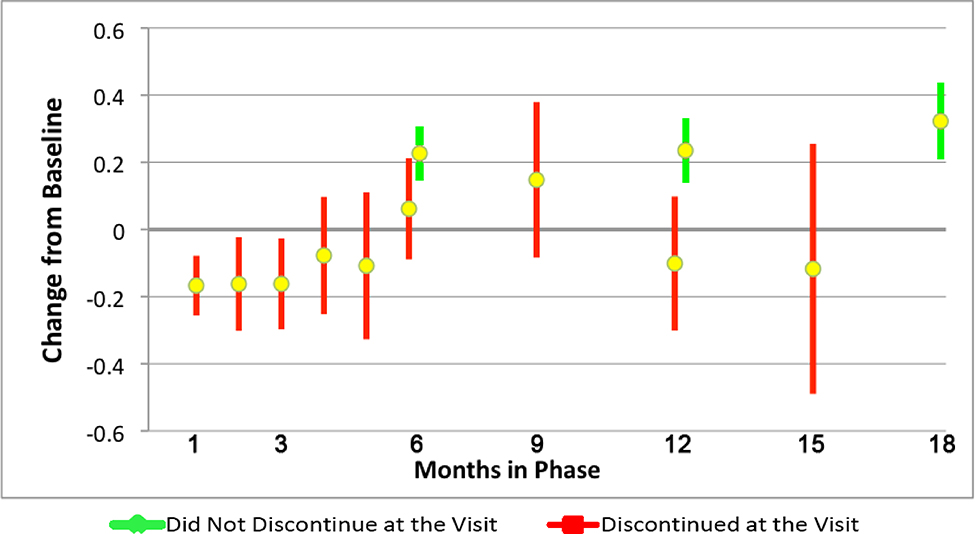
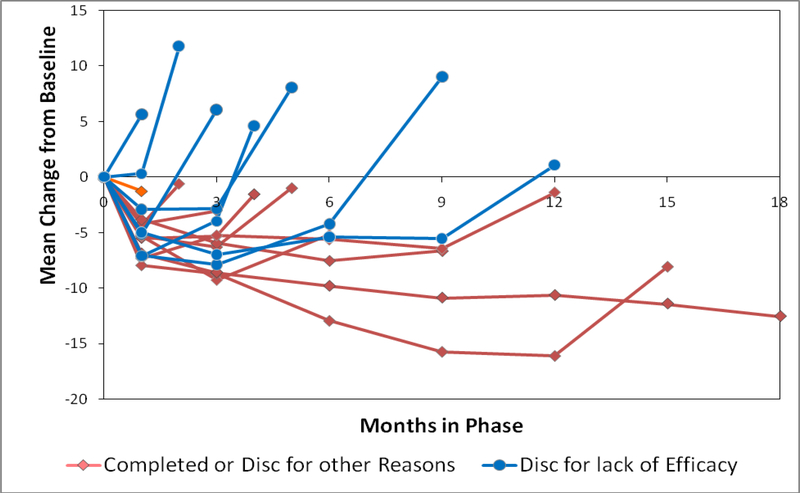
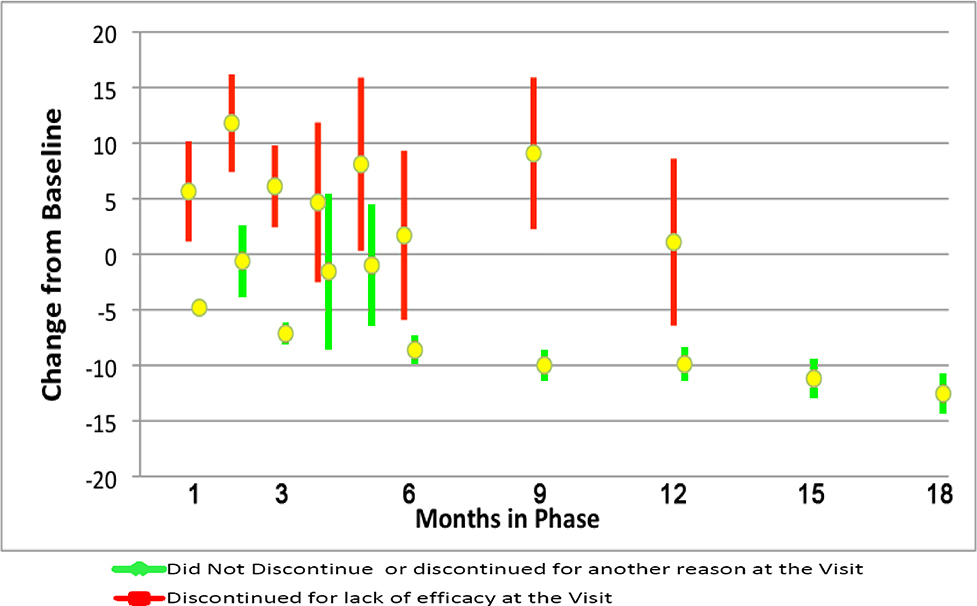
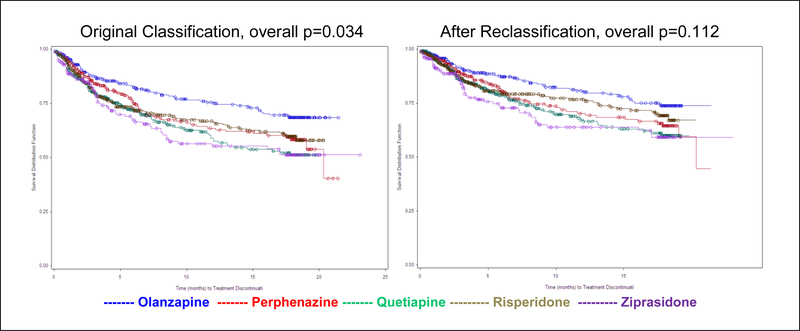
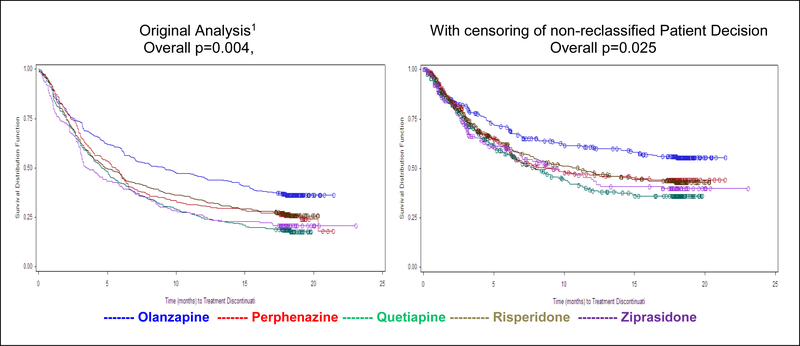
Time until all-cause treatment discontinuation was the primary outcome of the CATIE trial. We discuss the advantages and disadvantages of this outcome, and evaluate its association with clinical correlates through graphical response profiles. We investigate the characteristics of patients who discontinued for patient decision, including a reclassification of patient decision into other reasons. All-cause discontinuation is compared to a related outcome, time until treatment failure. Patients who discontinued had lower quality of life scores than other patients. Patients discontinuing for lack of efficacy had worsened efficacy scores compared with an improvement for other patients. Those who discontinued for patient decision had lower compliance. Blinded reclassification of discontinuation for patient decision identified 5% of cases as lack of efficacy and 21% as intolerable side effects. Reclassified patients participated in the next study phase at a higher rate than those remaining as patient decision (67% vs. 10%). Treatment group differences for time to discontinuation due to patient decision were attenuated after censoring the reclassified patients, but were still suggestive. Treatment comparisons for time to treatment failure were consistent with all cause discontinuation, although somewhat smaller. All-cause discontinuation is recommended as a simple and comprehensive outcome for pharmaceutical Phase II-IV clinical trials.

Keywords: drop-out; graphical response profiles; informative missing data; lost to follow-up; treatment failure.


Figures

Figure 1.
Figure 1.. Quality of Life Score Mean Change from Baseline by Cohorts Based on Duration of Phase Participation
QOL score is the mean of 21 items, and ranges from 0 (worst) to 6 (best). QOL was measured at months 6, 12, 18, and early phase discontinuation (as available). Sample size of QOL by cohort based on last visit: month 1: n=168, month 2: n=109, month 3: n=107, month 4: n=62, month 5: n=46, month 6: n=108, months7– 9: n=75, months 10–12: n=76, months 13– 15: n=26, month 18 completers, n=363.
Figure 2.
Figure 2.. Quality of Life Score Mean Change from Baseline and 95% CIs by Discontinuation Status per Month
Month 6: Mean difference = 0.17, 95% CI= [−0.02, 0.35], p=0.056. Months 9–12: Mean difference = 0.34, 95% CI= [0.10, 0.57], p=0.005. Sample sizes: Discontinued at the visit: month 1: n=168, month 2: n=109, month 3: n=107, month 4: n=62, month 5: n=46, month 6: n=108, months7– 9: n=75, months 10–12: n=76, months 13– 15: n=26, Did not discontinue at the visit: month 6: n=540, month 12: n=401,month 18 completers, n=363.
Figure 3.
Figure 3.. PANSS Mean Change from Baseline by Cohorts Based on Reason for Discontinuation and Duration of Phase Participation
PANSS Total score is the sum of 30 items, and ranges from 30 (best) to 210 (worst). PANSS was measured at month 1, quarterly from months 3–18, and early phase discontinuation. Sample size of PANSS cohorts: Discontinued for lack of efficacy at: month 1: n=49, month 2: n=55, month 3: n=64, month 4: n=36, month 5: n=21, month 6: n=26, months 7–9: n=40, months 10–12: n=24, Discontinued for other reasons: month 1: n=216, month 2: n=60, month 3: n=100, month 4: n=29, month 5: n=26, month 6: n=62, months 7–9: n=59, months 10–12: n=43, months 13–15: n=24, month 18 completers, n=371.
Figure 4.
Figure 4.. PANSS Mean Change from Baseline and 95% CI by Month for Patients Discontinuing for Lack of Efficacy Versus Discontinuing for Another Reason or Not Discontinuing at the Visit
P< 0.01 at months 1, 2, 3, 6, 7–9, 10–12. Mean differences [95% CI] by month are: 1: −10.5 [−13.9, −7.0], 2: −12.4 [−17.7, −7.1], 3: −13.3 [−16.8, −9.7], 4: −6.2 [−16.2, 3.8], 5: −9.1 [−18.1, −0.1], 6: −10.3 [−16.6, −4.1], 7–9: −19.1 [−24.3, −13.8], 10–12: −11.0 [−17.8, −4.2]. Sample size of PANSS cohorts: Discontinued for lack of efficacy at: month 1: n=49, month 2: n=55, month 3: n=64, month 4: n=36, month 5: n=21, month 6: n=26, months 7–9: n=40, months 10–12: n=24, Discontinued for other reason or did not discontinue at: month 1: n=1263, month 2: n=60, month 3: n=856, month 4: n=29, month 5: n=26, month 6: n=633, months 7–9: n=531, months 10–12: n=458, months 13–15: n=396, month 18 completers, n=371.
Figure 5.
Figure 5.. Kaplan-Meier Plot of Time to Discontinuation Due to Reclassified Patient Decision
Figure 6.
Figure 6.. Sensitivity Analysis of Time to Discontinuation With Censoring of Non-Reclassified Events of Patient Decision
1 Lieberman 2005

References

    1. Alison P (2010), “Survival Analysis Using the SAS® System: A Practical Guide, Second Edition” Cary, N.C., SAS Institute, Inc.
    1. Cheng Y, Fine JP, Kosorok MR (2007), “Nonparametric Association Analysis of Bivariate Competing Risks Data,” Journal of American Statistical Association, 102(480), 1407–1415.
    1. Cox D (1972), “Regression models and Life Tables,” Journal of the Royal Statistical Society, B34, 187–220.
    1. Davis SM, Koch GG, Davis CE, and LaVange LM (2003), “ Statistical approaches to effectiveness measurement and outcome-driven re-randomizations in the Clinical Antipsychotic Trials of Intervention Effectiveness (CATIE) studies,” Schizophrenia Bulletin, 29(1), 73–80. - PubMed
    1. Gueorguieva R, Rosenheck R, Lin H (2010) “Joint Modeling of Longitudinal Measurements and Interval-censored competing risk data,” In submission. - PMC - PubMed

LinkOut - more resources