. 2018 Aug;123(8):6576-6590.
doi: 10.1029/2018JA025311. Epub 2018 Aug 22.

The Largest Electron Differential Energy Flux Observed at Mars by the Mars Express Spacecraft, 2004-2016

Affiliations

The Largest Electron Differential Energy Flux Observed at Mars by the Mars Express Spacecraft, 2004-2016

R A Frahm et al. J Geophys Res Space Phys. 2018 Aug.

Abstract

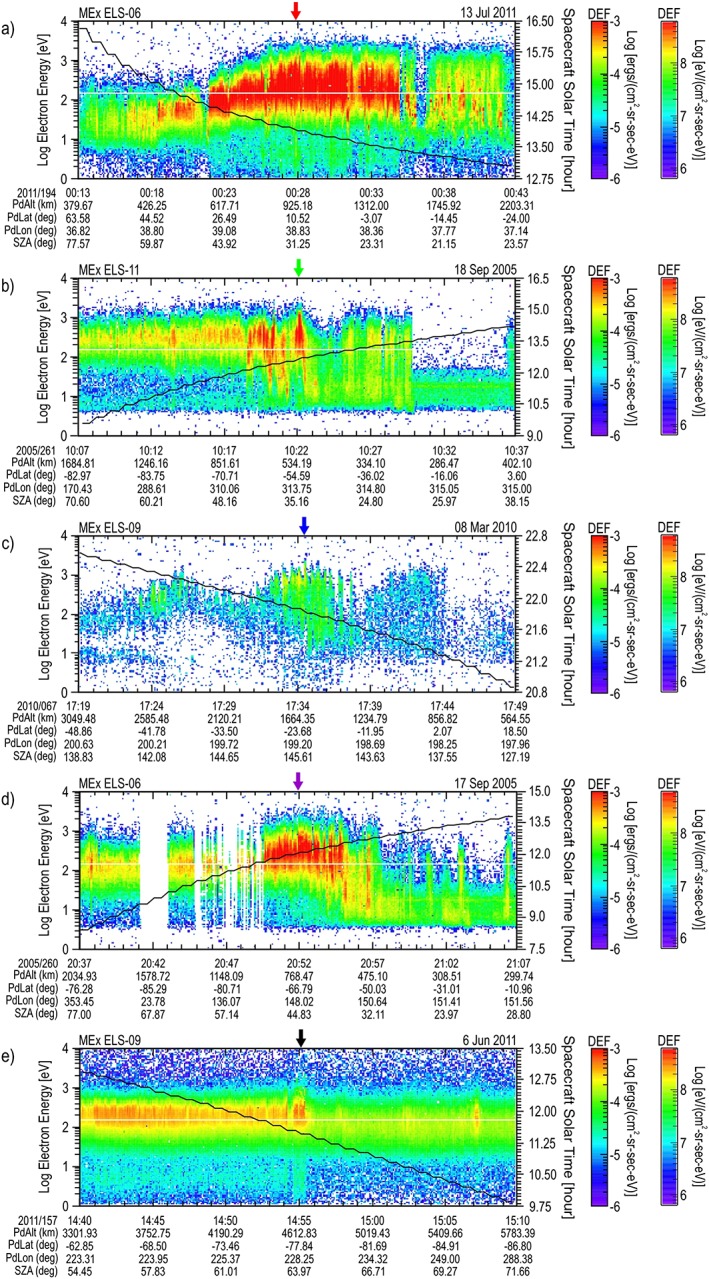
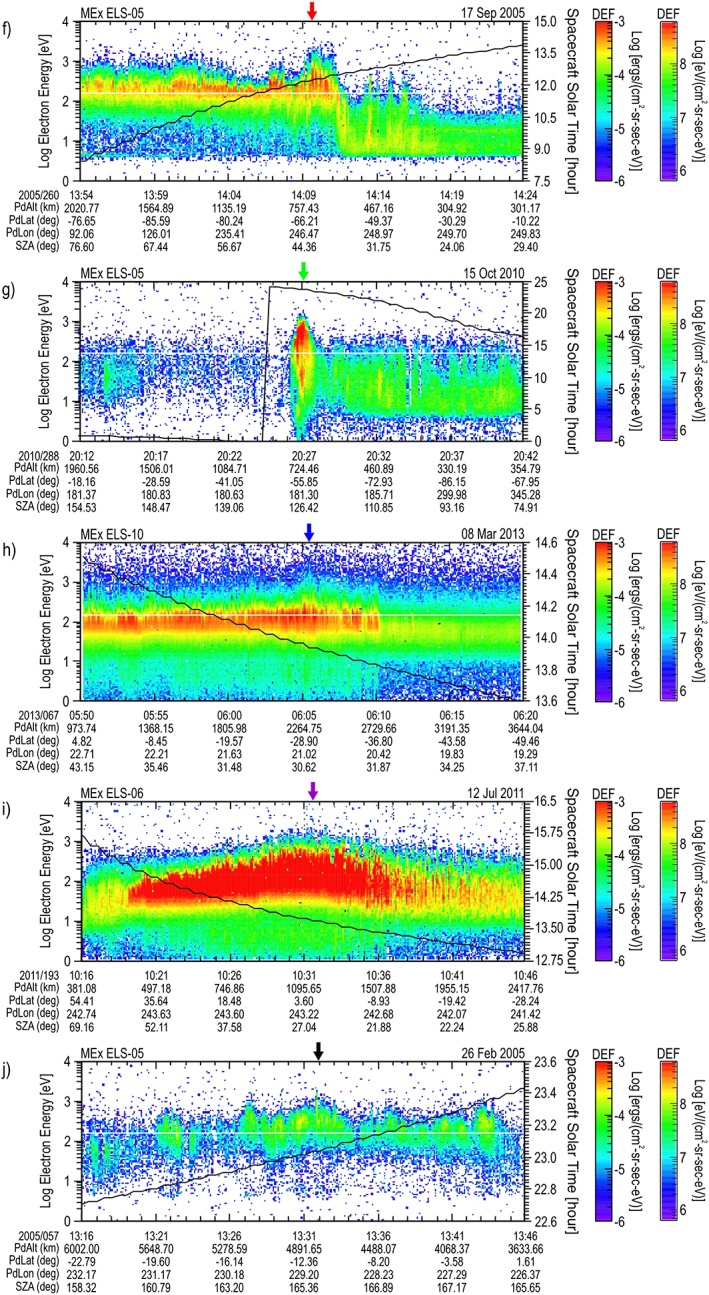
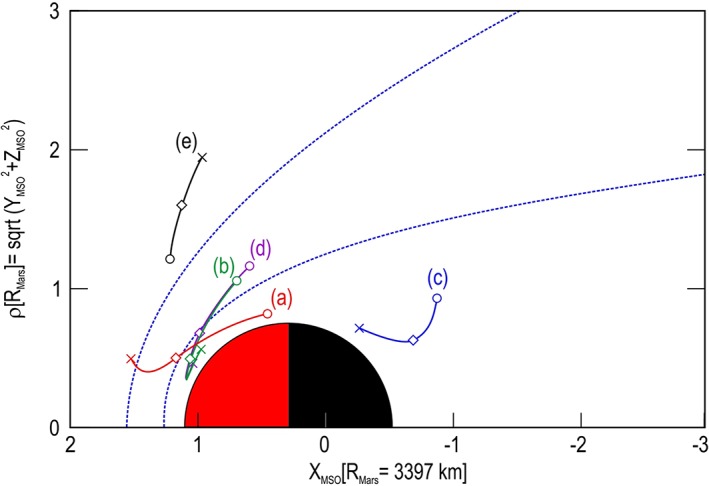
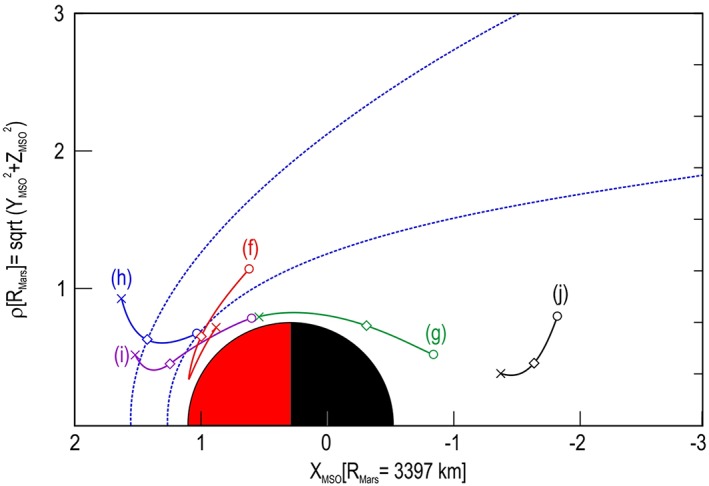
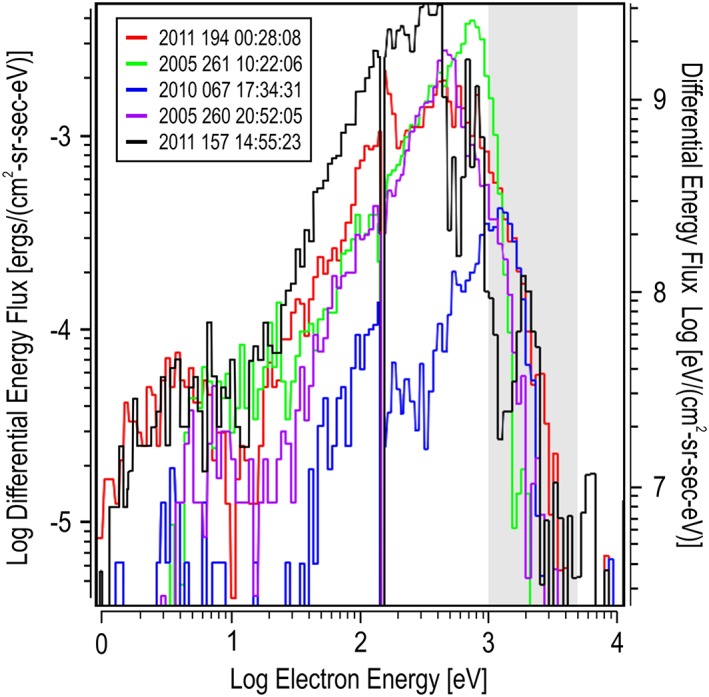
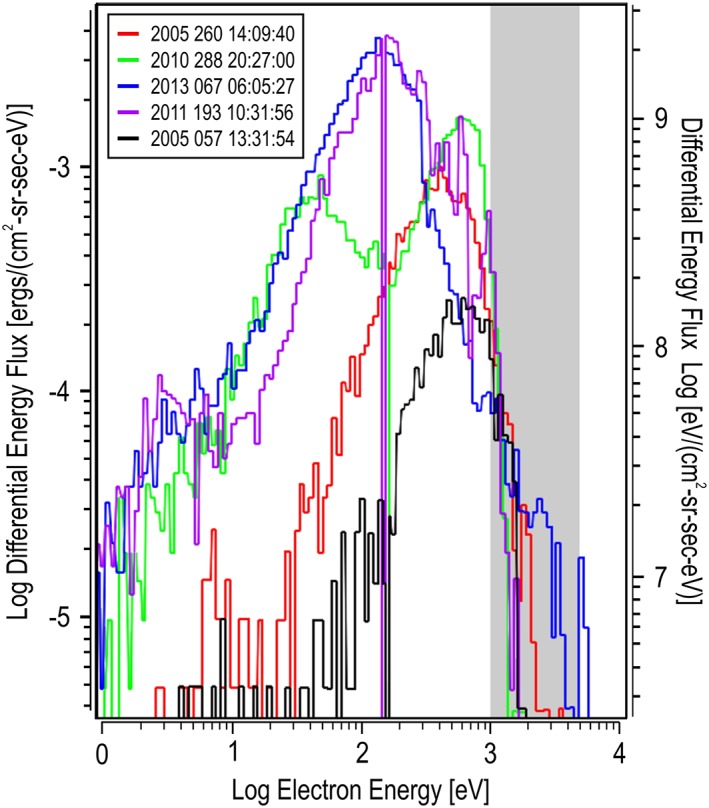
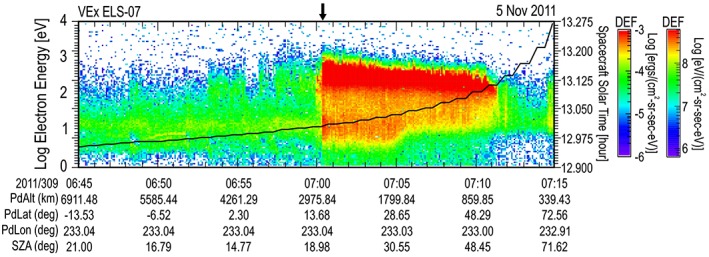
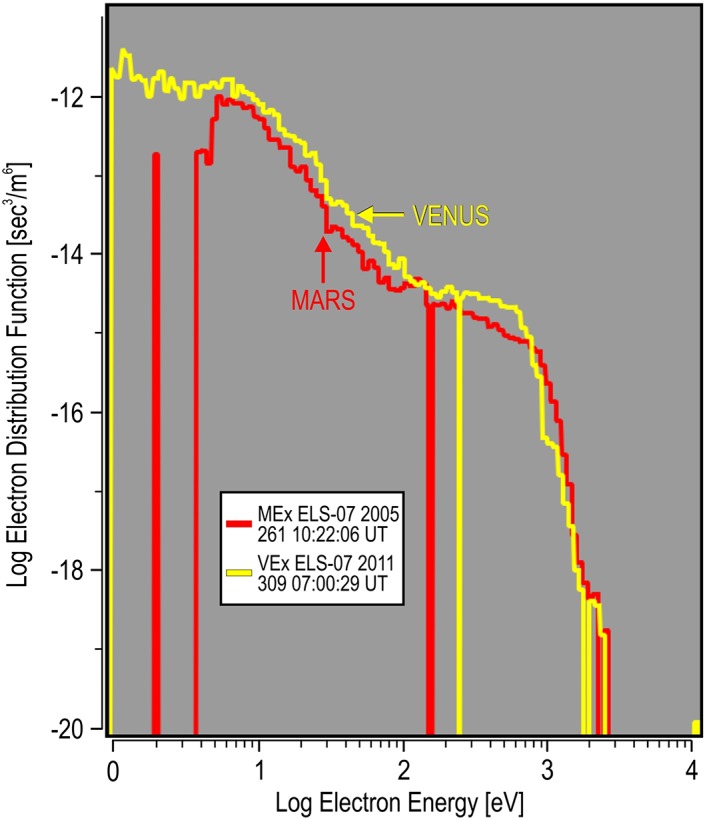
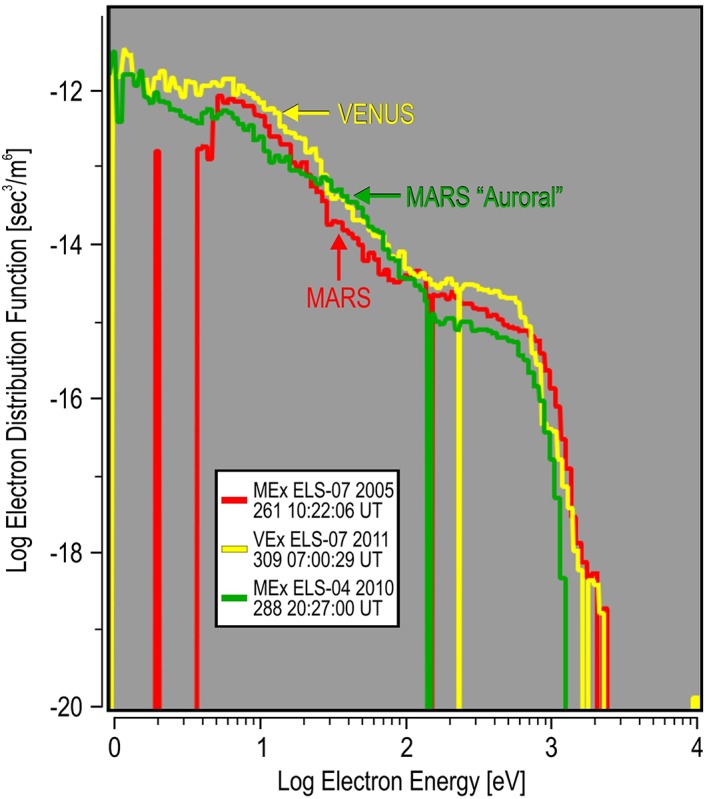
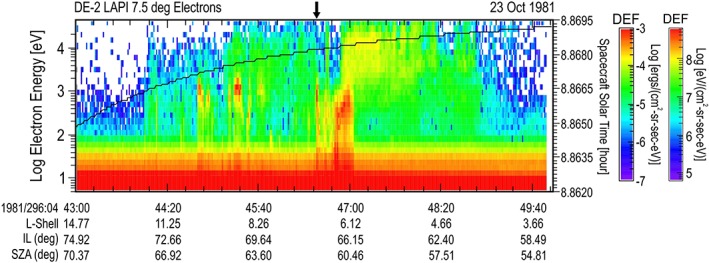
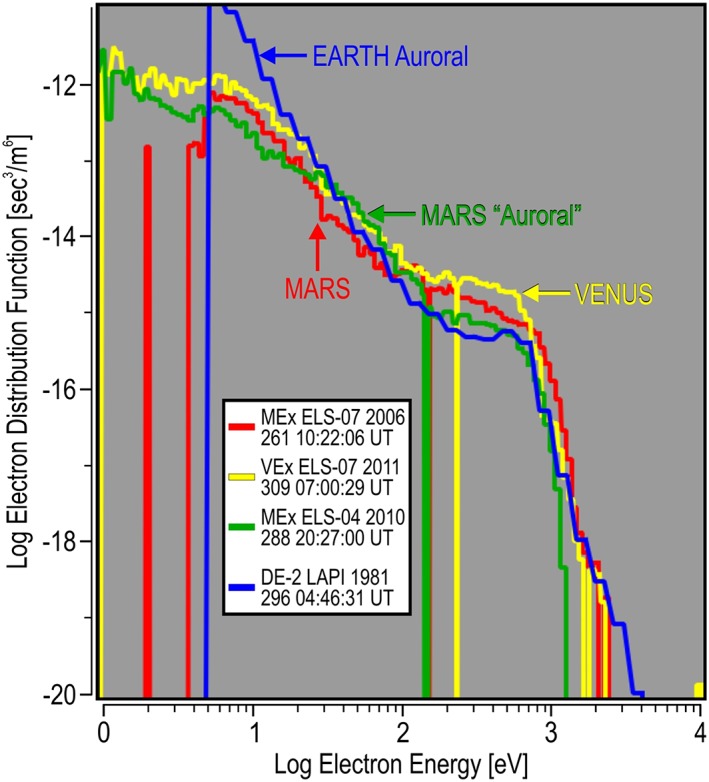
The goal of this paper is to understand the processes by which solar wind electrons are energized in the Martian magnetosphere and how this compares to processes at Venus and Earth. Each is unique in the source of its magnetic field topology and how this influences electron energization. To achieve this goal, 24 million spectra spanning 13 years have been examined using the electron spectrometer from the Mars Express spacecraft between about 12,000 km and about 250 km altitude, and from all latitudes and local times. The top 10 largest differential energy flux at energies above the differential energy flux peak have been found: seven spectra from the magnetosheath near noon, three from the dark tail (the largest two from the middle and ionospheric edge of the magnetosheath). Spectral comparisons show a decade range in the peak of the electron distributions; however, all distributions show a similar energy maximum dictated by solar wind/planet interaction. Similarly derived, the largest Venus spectrum occurred near the magnetosheath bow shock and had the same shape as the most intense Mars inner magnetosheath spectrum. The Mars and Venus dayside spectra compared to the Mars nightside spectrum that included an enhanced optical signal attributed to discrete "auroral" precipitation show a similar shape. These spectra are also compared to a selected auroral zone electron spectra from the Earth. The Mars and Venus results suggest that there is no more energy needed to generate electrons forming the nightside precipitation than is gained during the solar wind/planet interaction.


Figures

Figure 1
Figure 1
Top five maximum differential energy flux (DEF) energy‐time spectrograms. The order (a–e) is that listed in Table 1. For each spectrogram, an overlay shows the solar local time (hr) with the scale on the right axis. At the bottom of each plot are given the planetodetic altitude (PdAlt in km), latitude (PdLat in deg), and longitude (PdLon in deg) along with the solar zenith angle (SZA in deg) of the spacecraft. An arrow at the top of each panel marks the location of the largest DEF spectrum (the color of this arrow corresponds to the color of the orbit presented in Figure 3 and the maximum DEF spectrum presented in Figure 5).
Figure 2
Figure 2
Second five maximum differential energy flux (DEF) energy‐time spectrograms. The order (f–j) is that listed in Table 1. The overlay and bottom plot label definitions are the same as in Figure 1. An arrow at the top of each panel marks the location of the largest DEF spectrum (the color of this arrow corresponds to the color of the orbit presented in Figure 4 and the maximum DEF spectrum presented in Figure 6).
Figure 3
Figure 3
Orbital location of top five. Shown are the orbital locations in cylindrical Mars Solar Orbital (MSO) coordinates from which the top five spectra were collected around Mars. The horizontal axis is the MSO X direction, which points toward the Sun (at left). The vertical axis is the cylindrical radius, ρ, formed from the perpendicular MSO Y and Z components. Circles correspond to the beginning times of the spectrograms shown in Figure 1, and crosses, the end times. The event locations are marked with diamonds. The empirical average bow shock (outer boundary) and the magnetic pileup boundary (inner boundary) based on Vignes et al. (2000) are shown (blue conical shaped dashed lines).
Figure 4
Figure 4
Orbital location of second five. The format is the same as Figure 3, except that shown are the orbital locations for those spectrograms presented in Figure 2.
Figure 5
Figure 5
Top five maximum differential energy flux spectra. Each differential energy flux energy spectrum represents a slice of the spectrogram shown in Figure 1 indicated at the location of the arrows and listed as entries (a–e) in Table 1. Each spectrum is color coded, matching the spectrogram's arrow and indicated in the legend.
Figure 6
Figure 6
Second five maximum differential energy flux spectra. Each differential energy flux energy spectrum represents a slice of the spectrogram shown in Figure 2 indicated at the location of the arrows and listed as entries (f–j) in Table 1. Each spectrum is color coded, matching the spectrogram's arrow and indicated in the legend.
Figure 7
Figure 7
The spectrogram containing the largest differential energy flux (DEF) measured at Venus between 2006 and 2014. The format is similar to that presented in Figure 1. The arrow at the top of the spectrogram indicates the location of the maximum spectrum.
Figure 8
Figure 8
The largest Venus differential energy flux energy spectrum compared to the large Mars differential energy flux. The spectrum at Mars is taken from the inner magnetosheath shown in Figure 1b and Table 1. Comparison between planets is shown in units of the electron distribution function.
Figure 9
Figure 9
The largest Venus differential energy flux energy spectrum compared to the large Mars differential energy flux spectrum from the inner magnetosheath (Figure 1b) and the “auroral” spectrum (Figure 2g). Format is similar to Figure 8.
Figure 10
Figure 10
An auroral zone pass from the Earth observed by the Low Altitude Plasma Instrument flown on the Dynamics Explorer‐2 satellite. Format is similar to the spectrograms shown in Figure 1. Parameters listed at the bottom of the spectrogram are the L‐shell, invariant latitude (IL), and solar zenith angle (SZA) of the satellite.
Figure 11
Figure 11
The largest differential energy flux energy spectrum at Venus, a dayside inner magnetosheath spectrum at Mars, the nightside “auroral” spectrum at Mars, and an auroral spectrum from the Earth are shown. Comparison between planets is shown in units of the electron distribution function.

References

    1. Acuña, M. H. , Connerney, J. E. P. , Wasilewski, P. , Lin, R. P. , Anderson, K. A. , Carlson, C. W. , et al. (1992). The Mars Observer magnetic fields investigation. Journal of Geophysical Research, 97(E5), 7799–7814. 10.1029/92JE00344 - DOI
    1. Barabash, S. , Lundin, R. , Andersson, H. , Brinkfeldt, K. , Grigoriev, A. , Gunell, H. , et al. (2006). The Analyzer of Space Plasmas and Energetic Atoms (ASPERA‐3) for the Mars Express mission. Space Science Reviews, 126, 113–164.
    1. Barabash, S. , Sauvaud, J.‐A. , Gunell, H. , Andersson, H. , Grigoriev, A. , Brinkfeldt, K. , et al. (2007). The Analyser of Space Plasmas and Energetic Atoms (ASPERA‐4) for the Venus express mission. Planetary and Space Science, 55(12), 1772–1792. 10.1016/j.pss.2007.01.014 - DOI
    1. Barbash, S. , Lundin, R. , Andersson, H. , Gimholt, J. , Holmström, M. , Norberg, O. , et al. (2004). ASPERA‐3: Analyser of space plasmas and energetic ions for Mars Express In Wilson A. (Ed.), Mars Express: The Scientific Payload, ESA SP‐1240 (pp. 121–139). Noordwijk, The Netherlands: European Space Agency Publications Division, European Space and Technology Centre.
    1. Bertaux, J.‐L. , Fonteyn, D. , Korablev, O. , Chassefière, E. , Dimarellis, E. , Dubois, J. P. , et al. (2004). SPICAM: Studying the global structure and composition of the Martian atmosphere In Wilson A. (Ed.), Mars Express: The Scientific Payload, ESA SP‐1240 (pp. 95–120). Noordwijk, The Netherlands: European Space Agency Publications Division, European Space and Technology Centre.